| Param | Original file | Final file |
|---|---|---|
| Filename | modeM0/AS1G07_029T01_9000001158_08326cztM0_level2.evt | modeM0/AS1G07_029T01_9000001158_08326cztM0_level2_quad_clean.evt |
| Size (bytes) | 308,819,520 | 45,835,200 |
| Size | 294.5 MB | 43.7 MB |
| Events in quadrant A | 2,170,419 | 271,151 |
| Events in quadrant B | 2,644,934 | 274,789 |
| Events in quadrant C | 2,138,792 | 271,029 |
| Events in quadrant D | 2,098,157 | 261,328 |
| Mode SS | |||
|---|---|---|---|
| Quadrant | BADHDUFLAG | Total packets | Discarded packets |
| A | 0 | 90 | 0 |
| B | 0 | 90 | 0 |
| C | 0 | 90 | 0 |
| D | 0 | 90 | 0 |
| Mode M0 | |||
|---|---|---|---|
| Quadrant | BADHDUFLAG | Total packets | Discarded packets |
| A | 0 | 9364 | 2 |
| B | 0 | 10665 | 1 |
| C | 0 | 9356 | 1 |
| D | 0 | 9352 | 1 |
| Mode M9 | |||
|---|---|---|---|
| Quadrant | BADHDUFLAG | Total packets | Discarded packets |
| A | 0 | 2 | 0 |
| B | 0 | 2 | 0 |
| C | 0 | 2 | 0 |
| D | 0 | 2 | 0 |
| Quadrant | Total seconds | Saturated seconds | Saturation percentage |
|---|---|---|---|
| A | 4394 | 186 | 4.233045% |
| B | 4394 | 395 | 8.989531% |
| C | 4394 | 142 | 3.231680% |
| D | 4394 | 142 | 3.231680% |
Noise dominated data is calculated using 1-second bins in cleaned event files. If a bin has >2000 counts, and if more than 50% of those come from <1% of pixels, then it is considered to be noise-dominated and hence unusable.
| Quadrant | # 1 sec bins | Bins with >0 counts | Bins with >2000 counts | High rate bins dominated by noise | Noise dominated (total time) | Noise dominated (detector-on time) | Marked lightcurve |
|---|---|---|---|---|---|---|---|
| A | 4564 | 4395 | 0 | 0 | 0.00% | 0.00% | 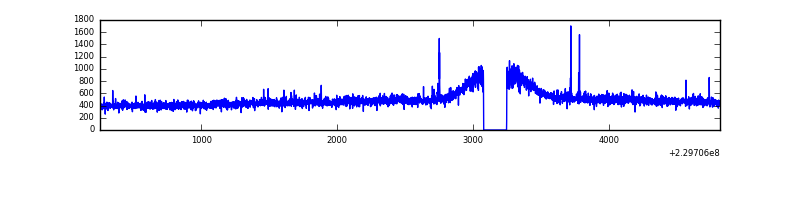 |
| B | 4564 | 4395 | 37 | 37 | 0.81% | 0.84% | 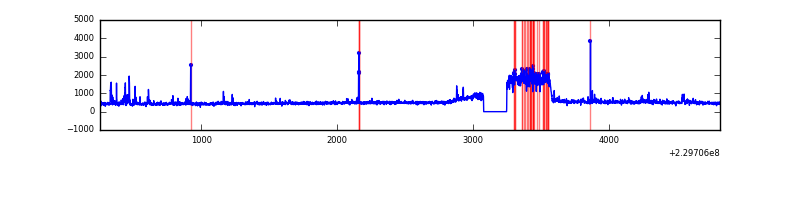 |
| C | 4564 | 4395 | 2 | 2 | 0.04% | 0.05% | 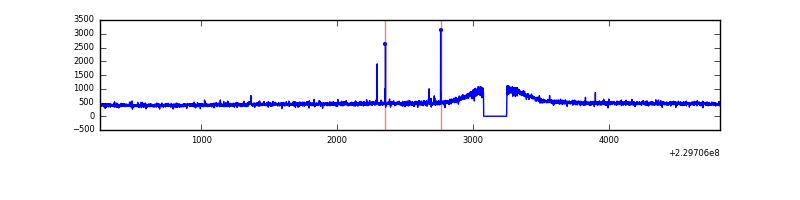 |
| D | 4564 | 4395 | 1 | 1 | 0.02% | 0.02% | 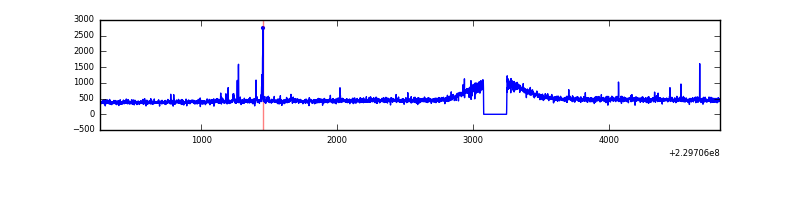 |
Top three noisy pixels from each quadrant. If the there are fewer than three noisy pixels in the level2.evt file, extra rows are filled as -1
| Pixel properties | Quadrant properties | ||||||
|---|---|---|---|---|---|---|---|
| Quadrant | DetID | PixID | Counts | Sigma | Mean | Median | Sigma |
| A | 13 | 251 | 10286 | 83.04 | 559 | 545 | 117.3 |
| A | 15 | 223 | 6135 | 47.65 | 559 | 545 | 117.3 |
| A | 0 | 226 | 5236 | 39.99 | 559 | 545 | 117.3 |
| B | 4 | 81 | 437661 | 4110.44 | 541 | 528 | 106.3 |
| B | 0 | 214 | 34883 | 323.05 | 541 | 528 | 106.3 |
| B | 12 | 0 | 17472 | 159.33 | 541 | 528 | 106.3 |
| C | 9 | 54 | 19604 | 148.73 | 543 | 545 | 128.1 |
| C | 13 | 61 | 4197 | 28.5 | 543 | 545 | 128.1 |
| C | 3 | 202 | 1283 | 5.76 | 543 | 545 | 128.1 |
| D | 2 | 14 | 18363 | 133.32 | 543 | 526 | 133.8 |
| D | 2 | 234 | 15377 | 111.01 | 543 | 526 | 133.8 |
| D | 2 | 152 | 12528 | 89.71 | 543 | 526 | 133.8 |
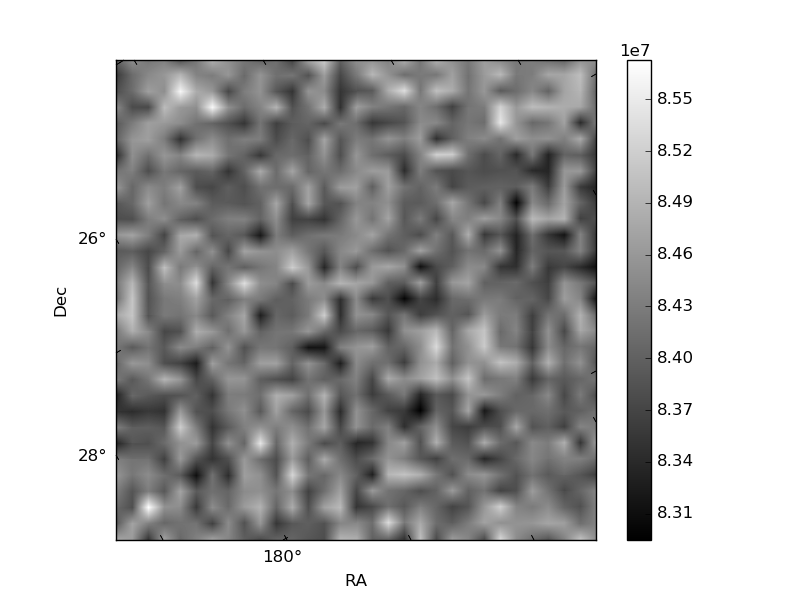
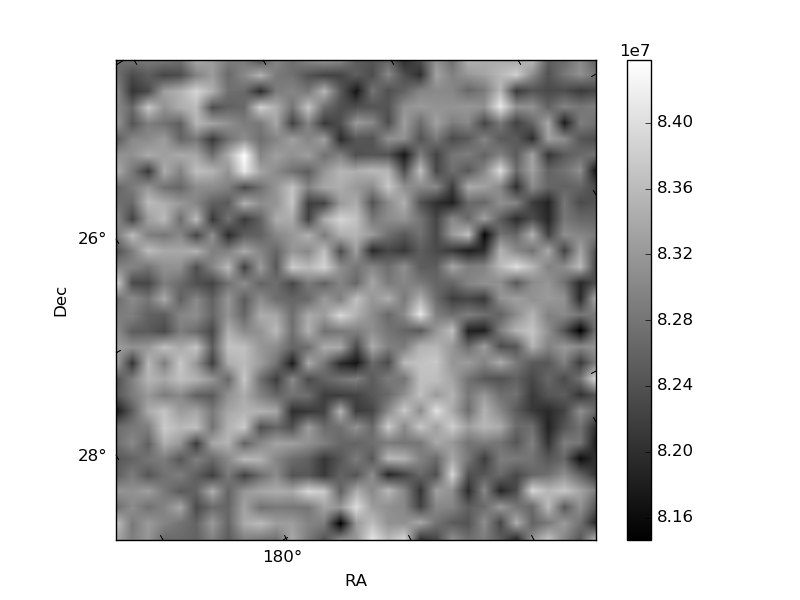
Histogram calculated using DETX and DETY for each event in the final _common_clean file
| Quadrant A |  |
 |
Quadrant B |
|---|---|---|---|
| Quadrant D | 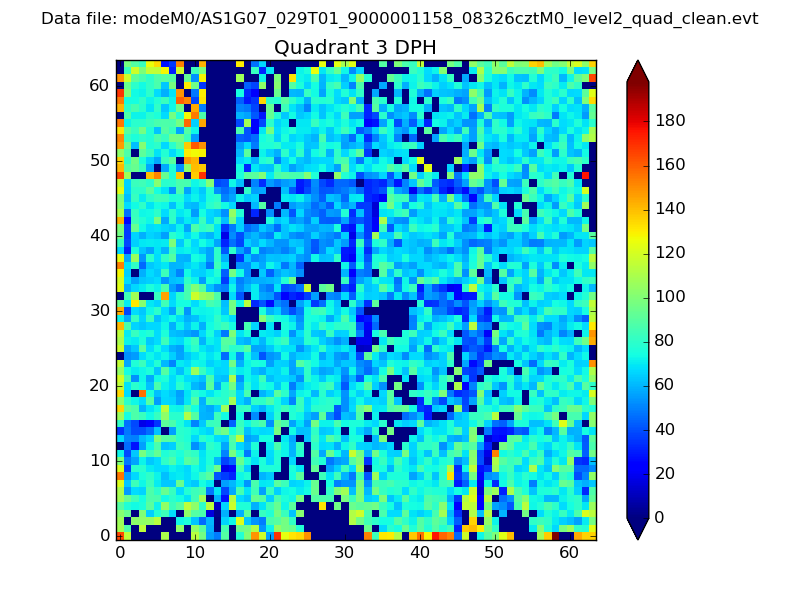 |
 |
Quadrant C |
| Plot type | Count rate plots | Images |
|---|---|---|
| Comparison with Poisson distribution Blue bars denote a histogram of data divided into 1 sec bins. Red curve is a Poisson curve with rate = median count rate of data. |
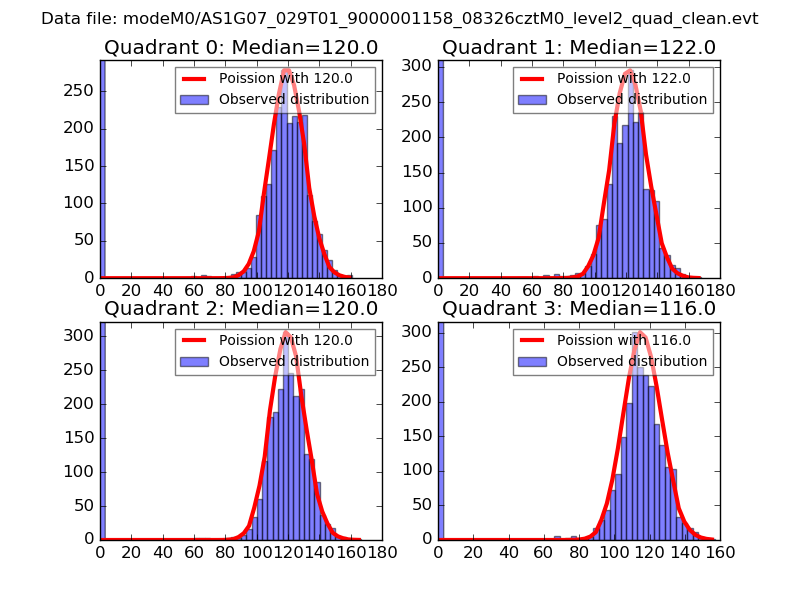 |
 |
| Quadrant-wise count rates Data is divided into 100 sec bins |
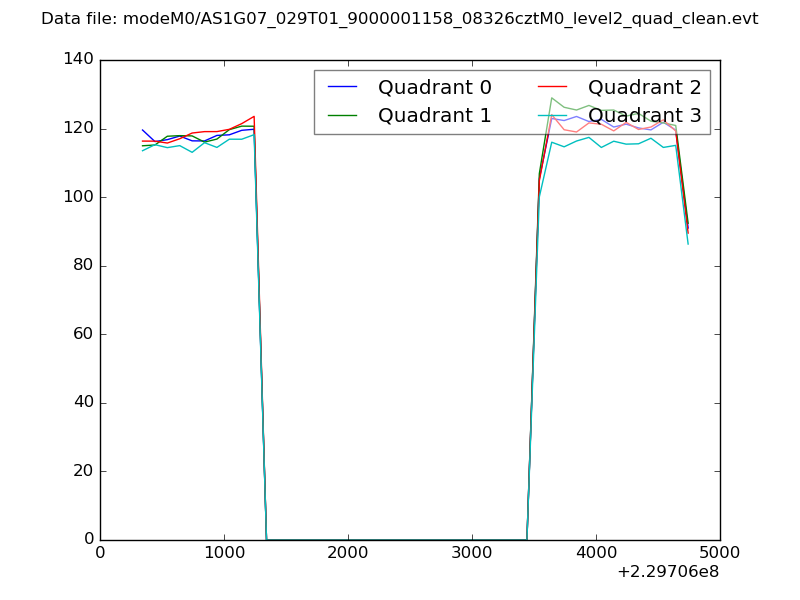 |
|
| Module-wise count rates for Quadrant A Data is divided into 100 sec bins |
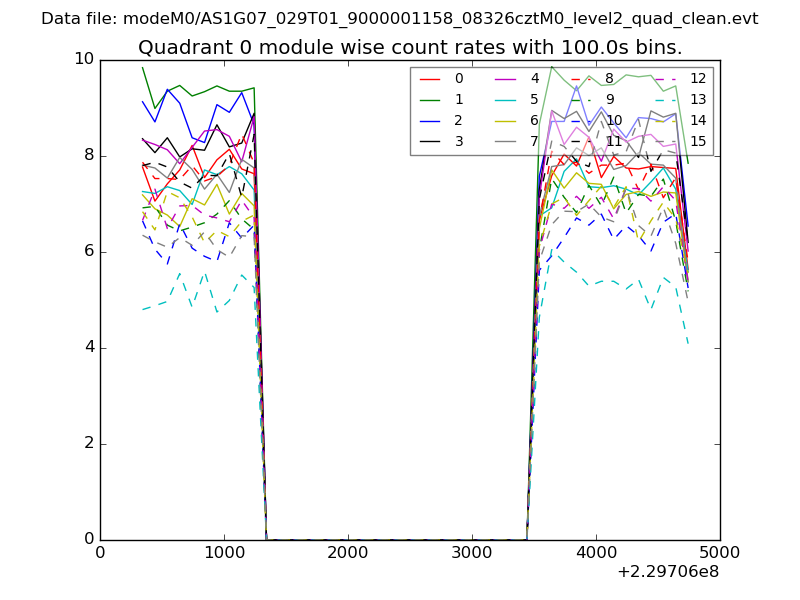 |
 |
| Module-wise count rates for Quadrant B Data is divided into 100 sec bins |
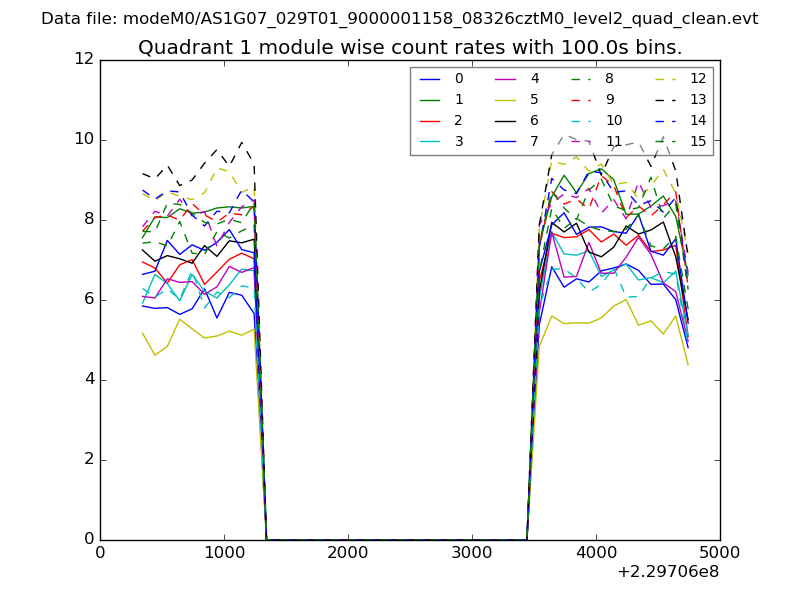 |
 |
| Module-wise count rates for Quadrant C Data is divided into 100 sec bins |
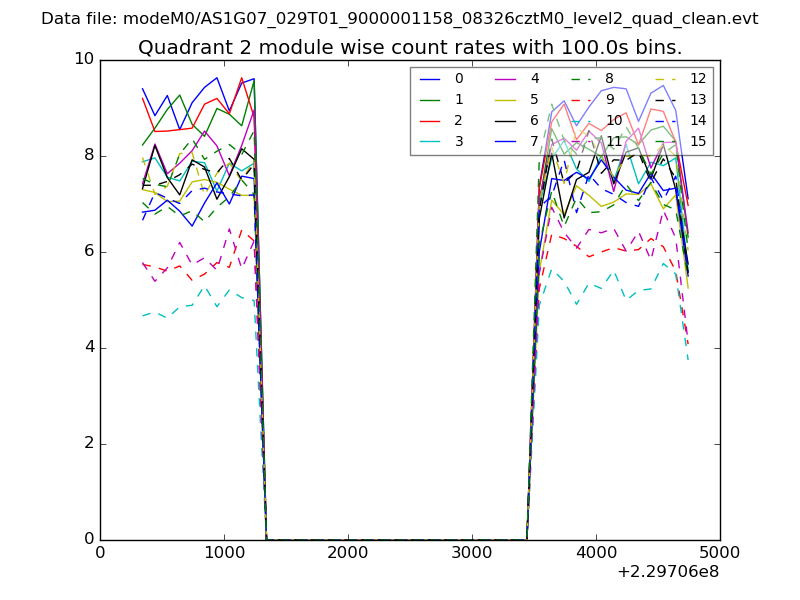 |
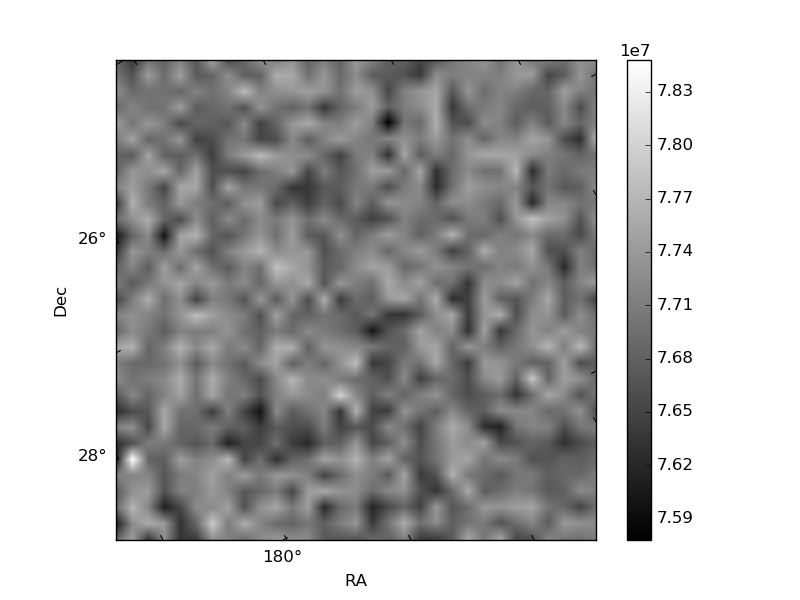 |
| Module-wise count rates for Quadrant D Data is divided into 100 sec bins |
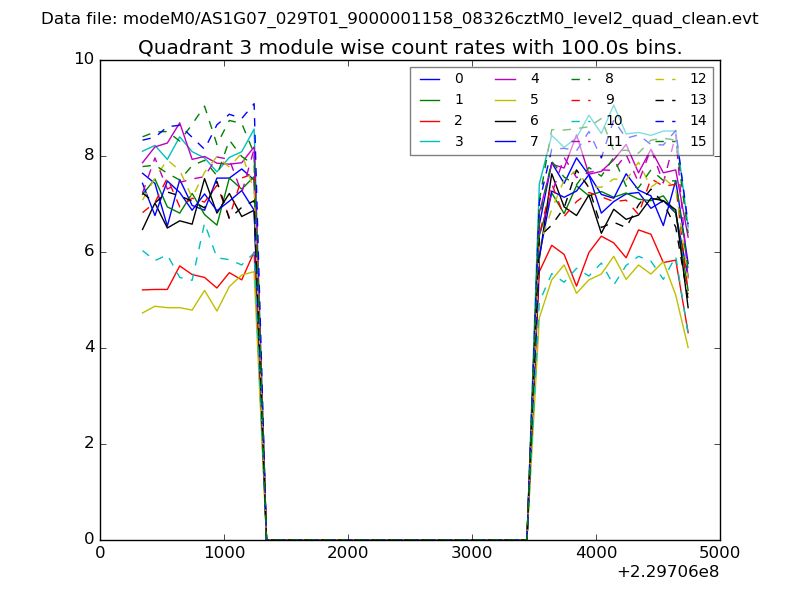 |
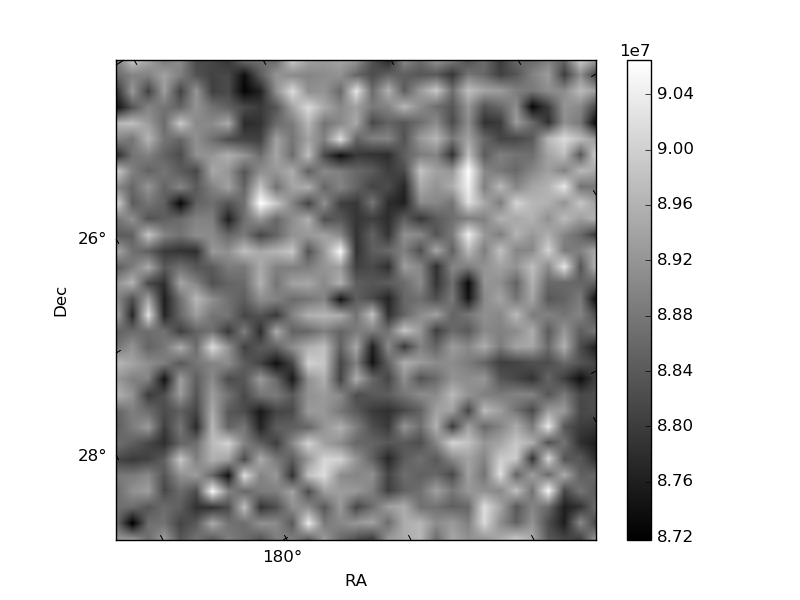 |
| Parameter | Plot |
|---|---|
| CZT HV Monitor |  |
| D_VDD | 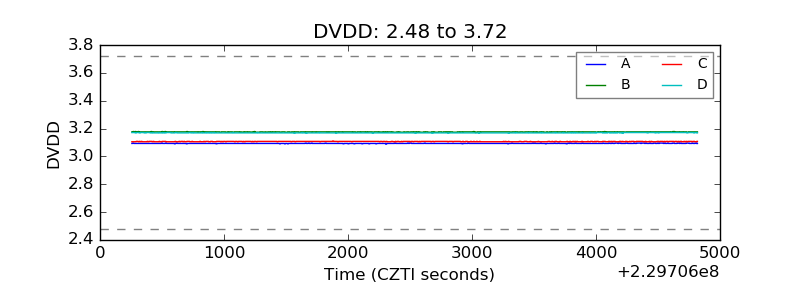 |
| Temperature 1 | 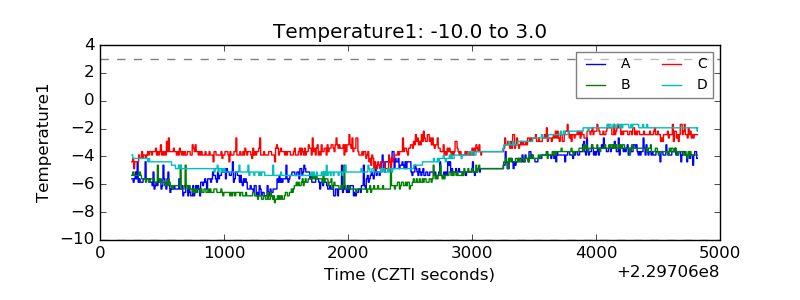 |
| Veto HV Monitor | 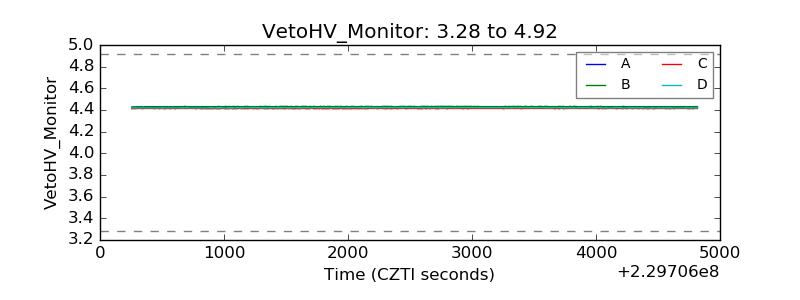 |
| Veto LLD | 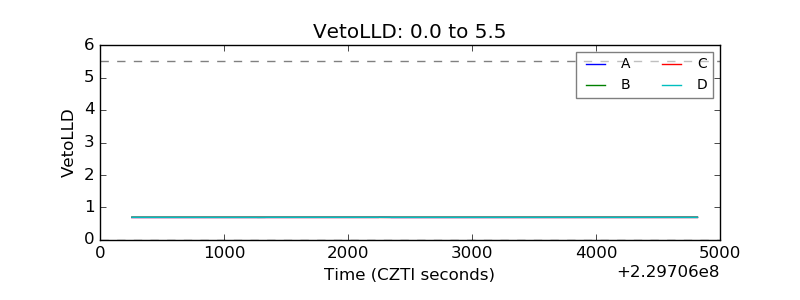 |
| Alpha Counter | 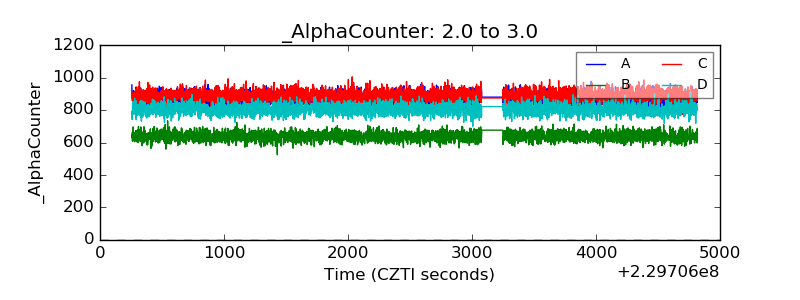 |
| _CPM_Rate | 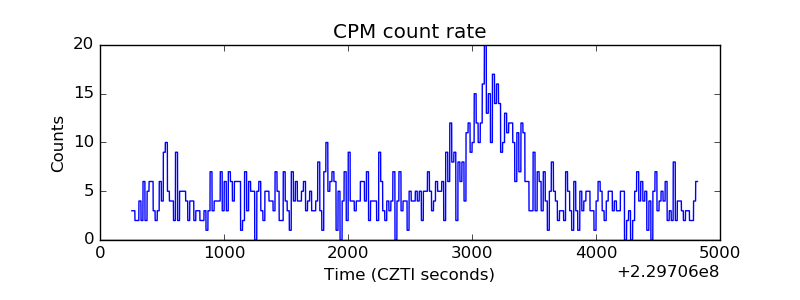 |
| CZT Counter | 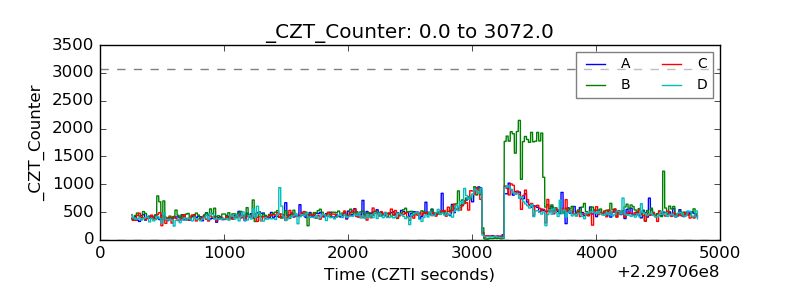 |
| +2.5 Volts monitor |  |
| +5 Volts monitor |  |
| _ROLL_ROT | 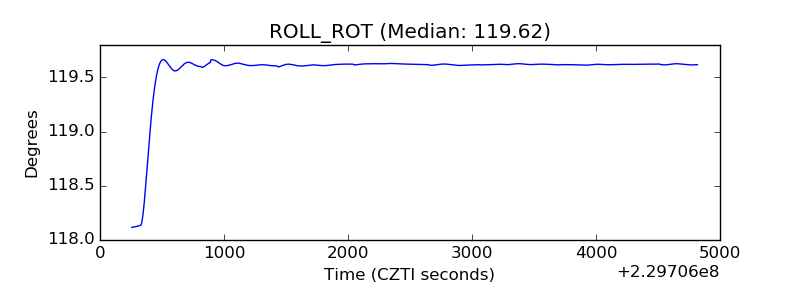 |
| _Roll_DEC | 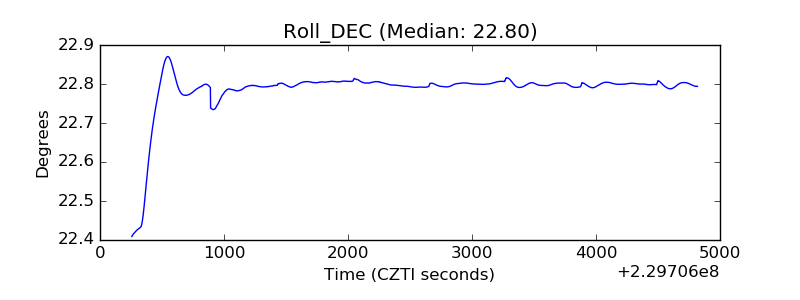 |
| _Roll_RA | 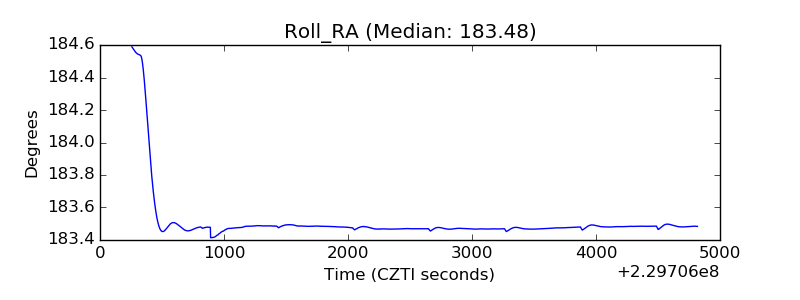 |
| Veto Counter | 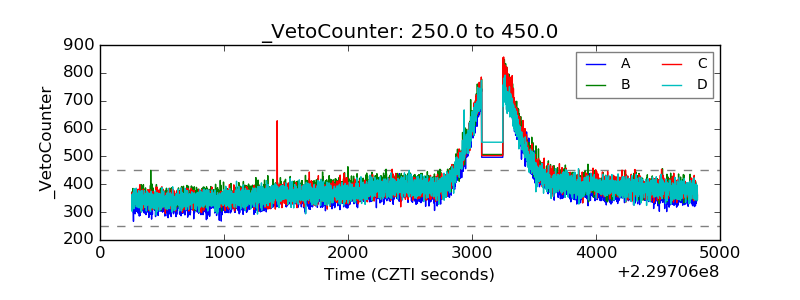 |