| Param | Original file | Final file |
|---|---|---|
| Filename | modeM0/AS1G07_029T01_9000001158_08327cztM0_level2.evt | modeM0/AS1G07_029T01_9000001158_08327cztM0_level2_quad_clean.evt |
| Size (bytes) | 510,511,680 | 98,038,080 |
| Size | 486.9 MB | 93.5 MB |
| Events in quadrant A | 3,546,315 | 617,249 |
| Events in quadrant B | 4,191,039 | 625,877 |
| Events in quadrant C | 3,793,959 | 617,404 |
| Events in quadrant D | 3,430,674 | 597,336 |
| Mode SS | |||
|---|---|---|---|
| Quadrant | BADHDUFLAG | Total packets | Discarded packets |
| A | 0 | 146 | 0 |
| B | 0 | 146 | 0 |
| C | 0 | 146 | 0 |
| D | 0 | 146 | 0 |
| Mode M0 | |||
|---|---|---|---|
| Quadrant | BADHDUFLAG | Total packets | Discarded packets |
| A | 0 | 15547 | 1 |
| B | 0 | 17421 | 0 |
| C | 0 | 16449 | 0 |
| D | 0 | 15484 | 0 |
| Quadrant | Total seconds | Saturated seconds | Saturation percentage |
|---|---|---|---|
| A | 7343 | 182 | 2.478551% |
| B | 7343 | 318 | 4.330655% |
| C | 7343 | 193 | 2.628354% |
| D | 7343 | 110 | 1.498025% |
Noise dominated data is calculated using 1-second bins in cleaned event files. If a bin has >2000 counts, and if more than 50% of those come from <1% of pixels, then it is considered to be noise-dominated and hence unusable.
| Quadrant | # 1 sec bins | Bins with >0 counts | Bins with >2000 counts | High rate bins dominated by noise | Noise dominated (total time) | Noise dominated (detector-on time) | Marked lightcurve |
|---|---|---|---|---|---|---|---|
| A | 7343 | 7343 | 6 | 6 | 0.08% | 0.08% |  |
| B | 7343 | 7343 | 51 | 51 | 0.69% | 0.69% |  |
| C | 7343 | 7343 | 104 | 104 | 1.42% | 1.42% |  |
| D | 7343 | 7343 | 6 | 6 | 0.08% | 0.08% |  |
Top three noisy pixels from each quadrant. If the there are fewer than three noisy pixels in the level2.evt file, extra rows are filled as -1
| Pixel properties | Quadrant properties | ||||||
|---|---|---|---|---|---|---|---|
| Quadrant | DetID | PixID | Counts | Sigma | Mean | Median | Sigma |
| A | 13 | 251 | 29980 | 156.45 | 896 | 874 | 186.0 |
| A | 15 | 223 | 27894 | 145.24 | 896 | 874 | 186.0 |
| A | 14 | 111 | 27456 | 142.88 | 896 | 874 | 186.0 |
| B | 4 | 81 | 601634 | 3480.7 | 892 | 870 | 172.6 |
| B | 0 | 214 | 59297 | 338.51 | 892 | 870 | 172.6 |
| B | 0 | 219 | 45345 | 257.68 | 892 | 870 | 172.6 |
| C | 9 | 54 | 406162 | 2002.48 | 868 | 874 | 202.4 |
| C | 13 | 61 | 6723 | 28.9 | 868 | 874 | 202.4 |
| C | 14 | 222 | 3146 | 11.23 | 868 | 874 | 202.4 |
| D | 2 | 152 | 72941 | 321.77 | 874 | 852 | 224.0 |
| D | 2 | 234 | 27490 | 118.9 | 874 | 852 | 224.0 |
| D | 2 | 14 | 26430 | 114.17 | 874 | 852 | 224.0 |
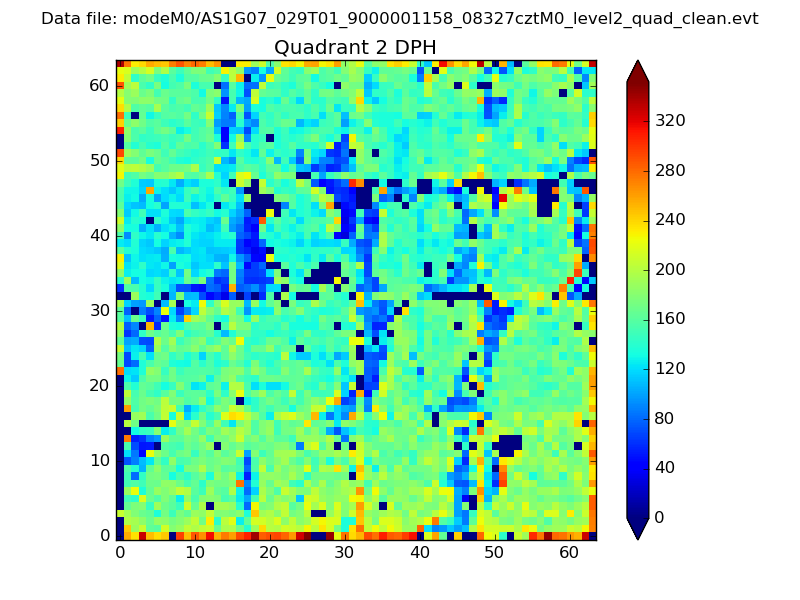
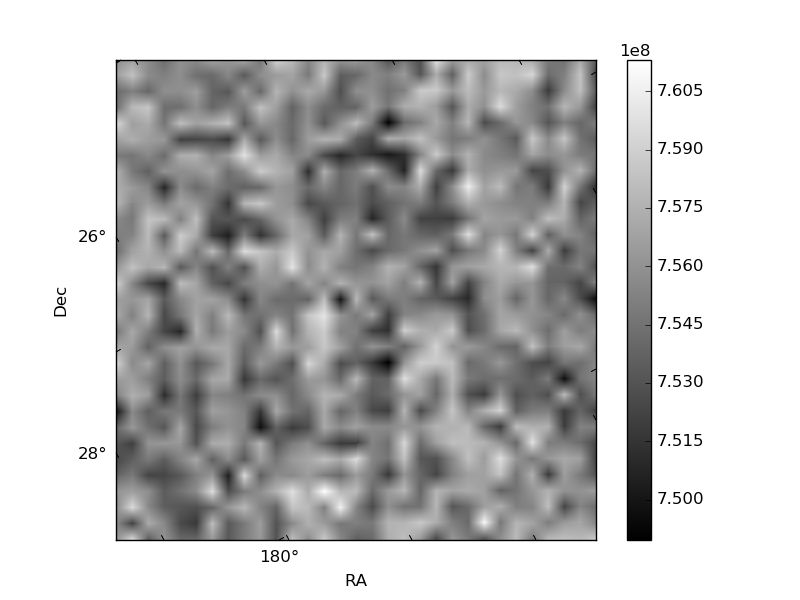
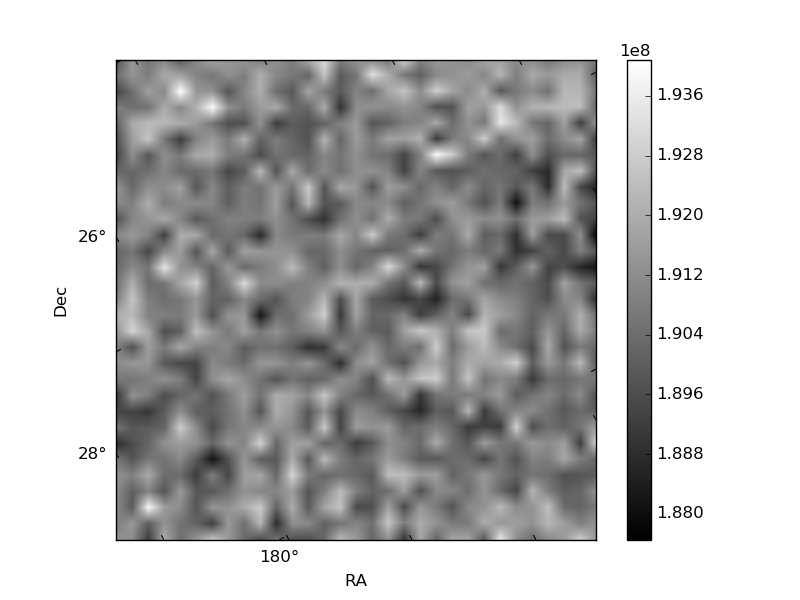
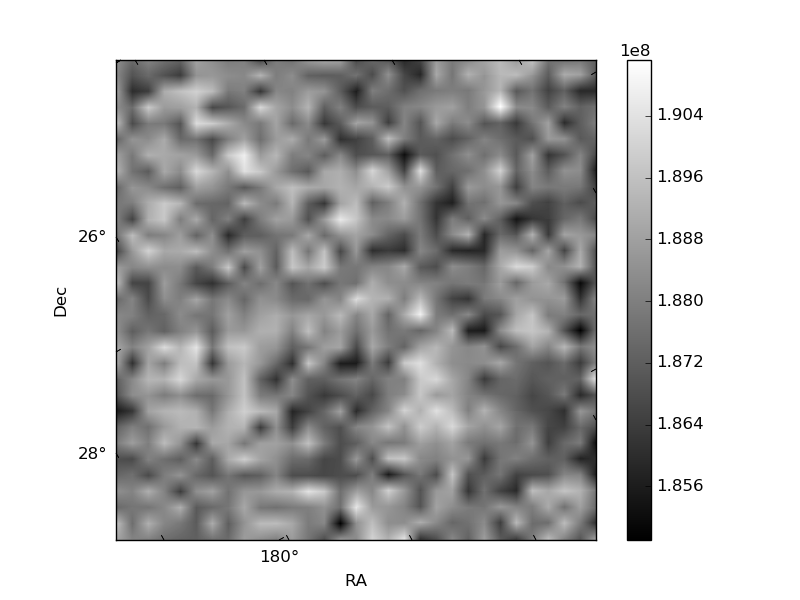
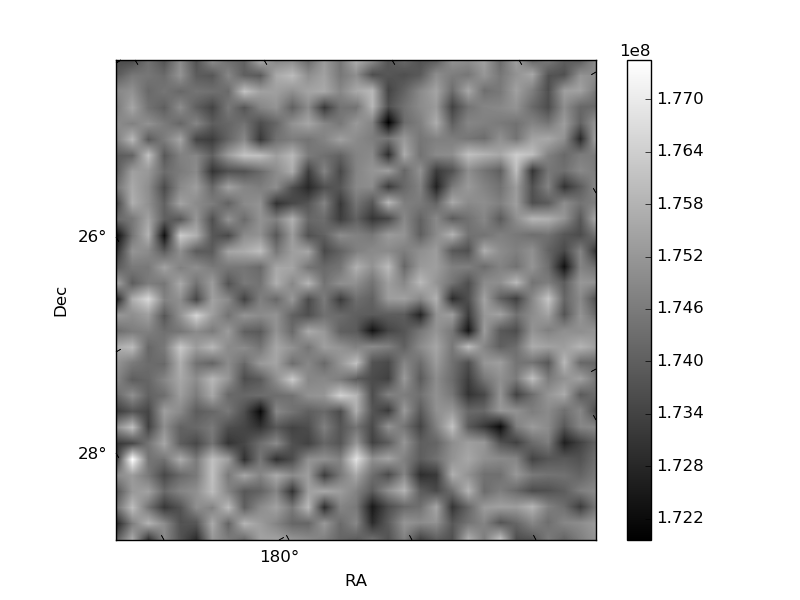
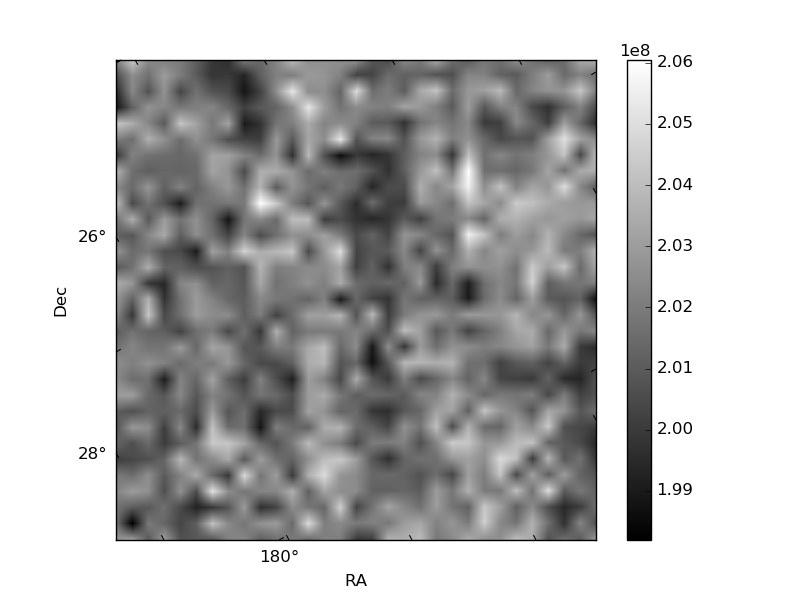
Histogram calculated using DETX and DETY for each event in the final _common_clean file
| Quadrant A | 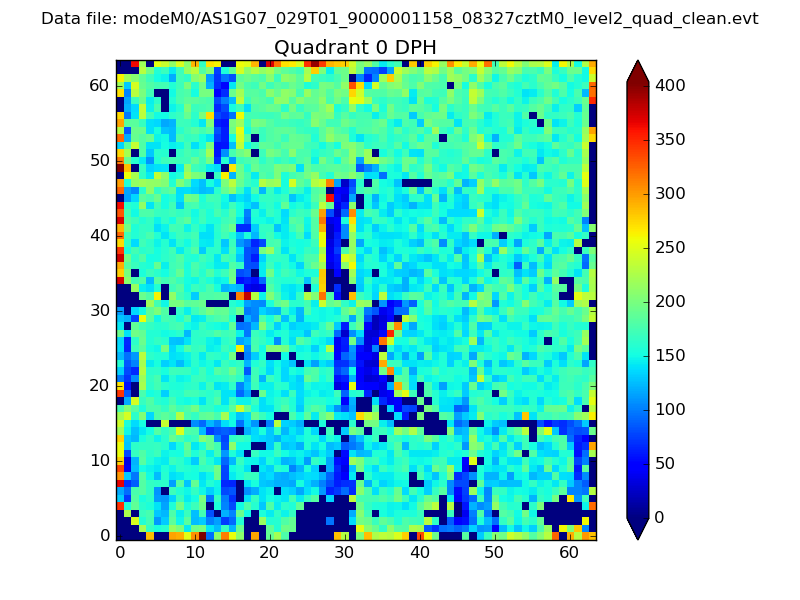 |
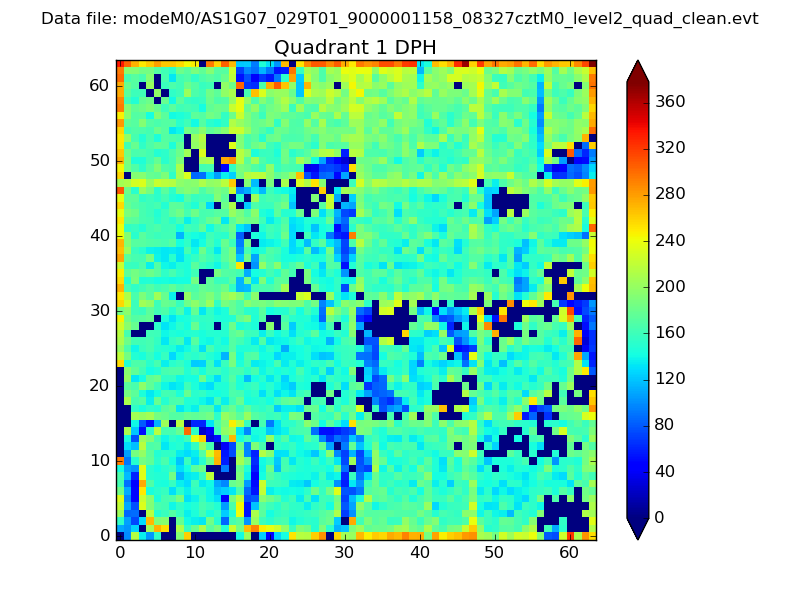 |
Quadrant B |
|---|---|---|---|
| Quadrant D | 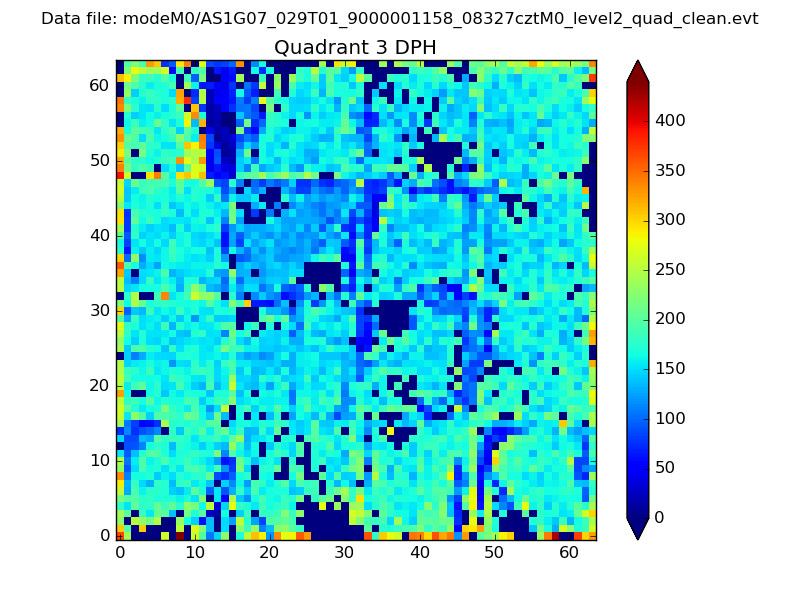 |
 |
Quadrant C |
| Plot type | Count rate plots | Images |
|---|---|---|
| Comparison with Poisson distribution Blue bars denote a histogram of data divided into 1 sec bins. Red curve is a Poisson curve with rate = median count rate of data. |
 |
 |
| Quadrant-wise count rates Data is divided into 100 sec bins |
 |
|
| Module-wise count rates for Quadrant A Data is divided into 100 sec bins |
 |
 |
| Module-wise count rates for Quadrant B Data is divided into 100 sec bins |
 |
 |
| Module-wise count rates for Quadrant C Data is divided into 100 sec bins |
 |
 |
| Module-wise count rates for Quadrant D Data is divided into 100 sec bins |
 |
 |
| Parameter | Plot |
|---|---|
| CZT HV Monitor | 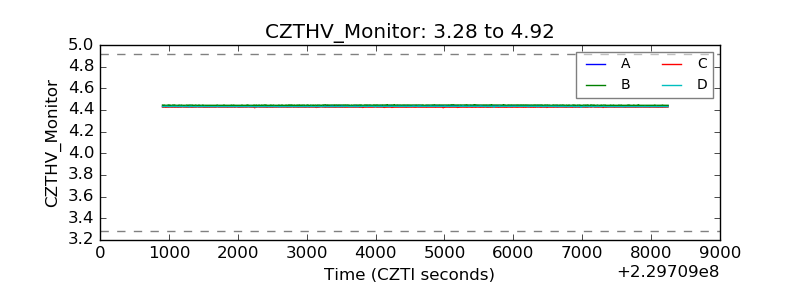 |
| D_VDD | 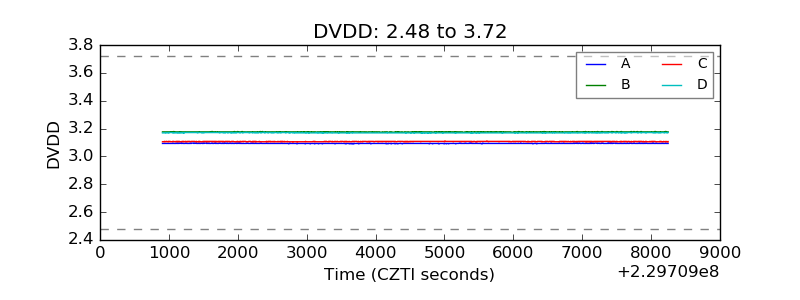 |
| Temperature 1 |  |
| Veto HV Monitor | 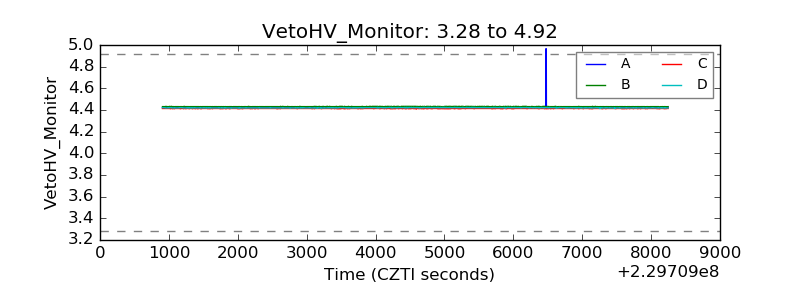 |
| Veto LLD | 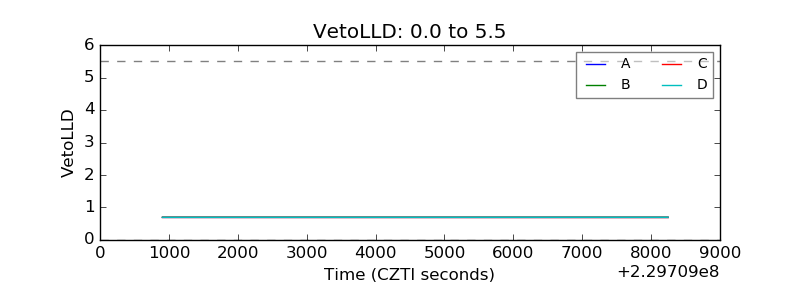 |
| Alpha Counter | 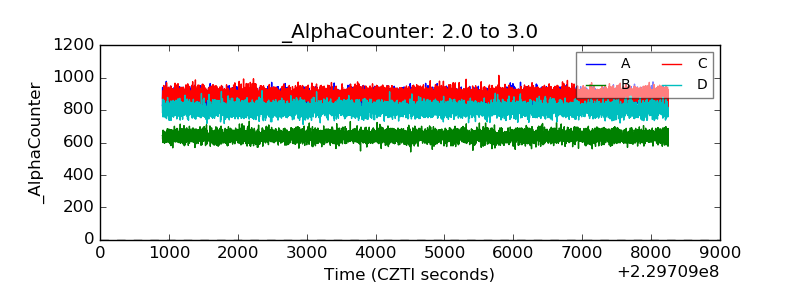 |
| _CPM_Rate | 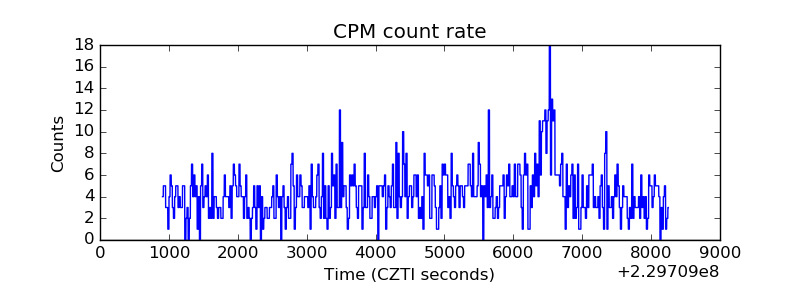 |
| CZT Counter | 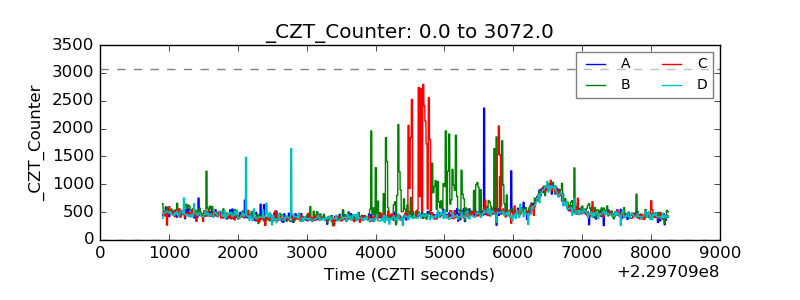 |
| +2.5 Volts monitor |  |
| +5 Volts monitor |  |
| _ROLL_ROT |  |
| _Roll_DEC |  |
| _Roll_RA | 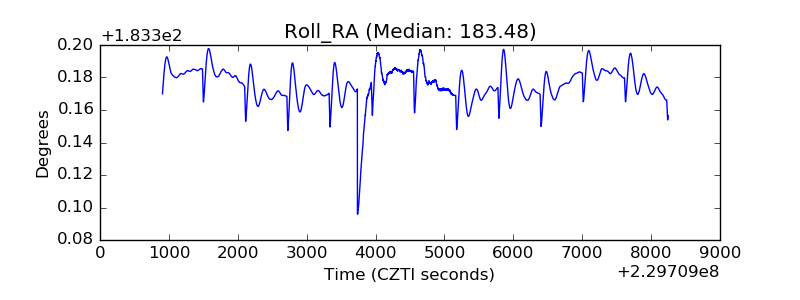 |
| Veto Counter | 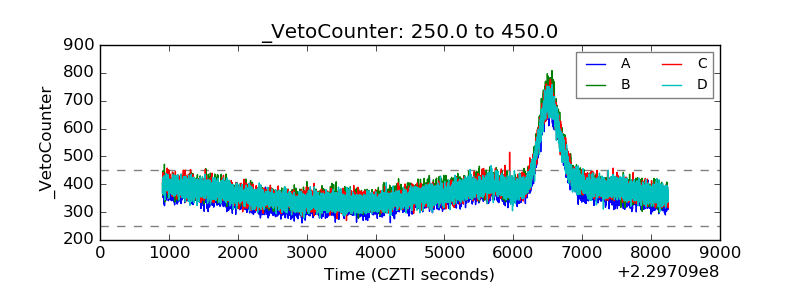 |