| Param | Original file | Final file |
|---|---|---|
| Filename | modeM0/AS1G07_029T01_9000001158_08328cztM0_level2.evt | modeM0/AS1G07_029T01_9000001158_08328cztM0_level2_quad_clean.evt |
| Size (bytes) | 469,578,240 | 96,805,440 |
| Size | 447.8 MB | 92.3 MB |
| Events in quadrant A | 3,335,670 | 609,221 |
| Events in quadrant B | 3,521,521 | 614,768 |
| Events in quadrant C | 3,393,343 | 608,190 |
| Events in quadrant D | 3,473,281 | 590,369 |
| Mode SS | |||
|---|---|---|---|
| Quadrant | BADHDUFLAG | Total packets | Discarded packets |
| A | 0 | 148 | 0 |
| B | 0 | 148 | 0 |
| C | 0 | 148 | 0 |
| D | 0 | 148 | 0 |
| Mode M0 | |||
|---|---|---|---|
| Quadrant | BADHDUFLAG | Total packets | Discarded packets |
| A | 0 | 15081 | 2 |
| B | 0 | 15368 | 1 |
| C | 0 | 15259 | 1 |
| D | 0 | 15588 | 1 |
| Mode M9 | |||
|---|---|---|---|
| Quadrant | BADHDUFLAG | Total packets | Discarded packets |
| A | 0 | 4 | 0 |
| B | 0 | 4 | 0 |
| C | 0 | 4 | 0 |
| D | 0 | 4 | 0 |
| Quadrant | Total seconds | Saturated seconds | Saturation percentage |
|---|---|---|---|
| A | 7322 | 88 | 1.201857% |
| B | 7322 | 113 | 1.543294% |
| C | 7322 | 69 | 0.942365% |
| D | 7322 | 69 | 0.942365% |
Noise dominated data is calculated using 1-second bins in cleaned event files. If a bin has >2000 counts, and if more than 50% of those come from <1% of pixels, then it is considered to be noise-dominated and hence unusable.
| Quadrant | # 1 sec bins | Bins with >0 counts | Bins with >2000 counts | High rate bins dominated by noise | Noise dominated (total time) | Noise dominated (detector-on time) | Marked lightcurve |
|---|---|---|---|---|---|---|---|
| A | 7607 | 7324 | 0 | 0 | 0.00% | 0.00% | 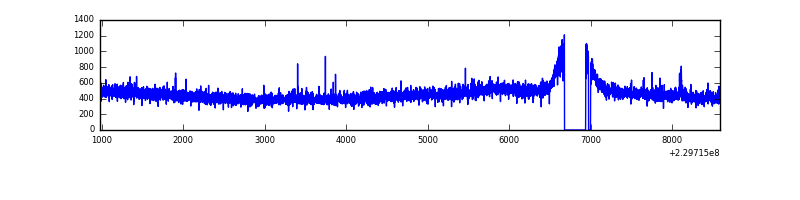 |
| B | 7607 | 7324 | 1 | 1 | 0.01% | 0.01% | 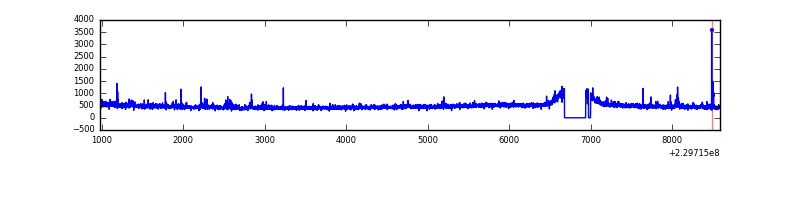 |
| C | 7607 | 7324 | 7 | 7 | 0.09% | 0.10% | 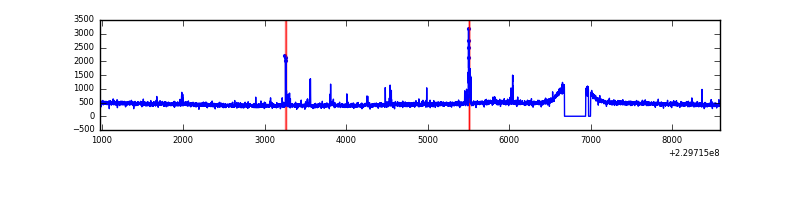 |
| D | 7607 | 7324 | 6 | 6 | 0.08% | 0.08% | 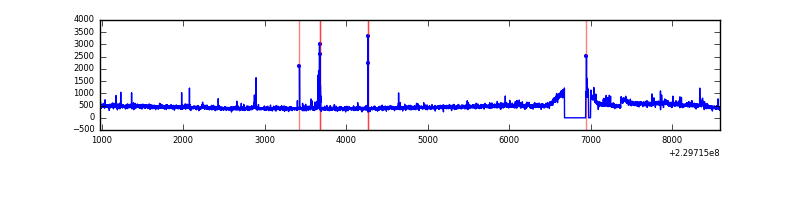 |
Top three noisy pixels from each quadrant. If the there are fewer than three noisy pixels in the level2.evt file, extra rows are filled as -1
| Pixel properties | Quadrant properties | ||||||
|---|---|---|---|---|---|---|---|
| Quadrant | DetID | PixID | Counts | Sigma | Mean | Median | Sigma |
| A | 13 | 251 | 11266 | 58.31 | 862 | 839 | 178.8 |
| A | 0 | 226 | 7940 | 39.71 | 862 | 839 | 178.8 |
| A | 12 | 194 | 7647 | 38.07 | 862 | 839 | 178.8 |
| B | 0 | 214 | 68493 | 404.25 | 865 | 844 | 167.3 |
| B | 0 | 219 | 50507 | 296.77 | 865 | 844 | 167.3 |
| B | 4 | 81 | 25088 | 144.87 | 865 | 844 | 167.3 |
| C | 9 | 54 | 94312 | 474.16 | 844 | 848 | 197.1 |
| C | 13 | 61 | 6507 | 28.71 | 844 | 848 | 197.1 |
| C | 8 | 128 | 5179 | 21.97 | 844 | 848 | 197.1 |
| D | 1 | 52 | 181756 | 851.58 | 840 | 819 | 212.5 |
| D | 2 | 14 | 51992 | 240.84 | 840 | 819 | 212.5 |
| D | 2 | 152 | 32359 | 148.44 | 840 | 819 | 212.5 |
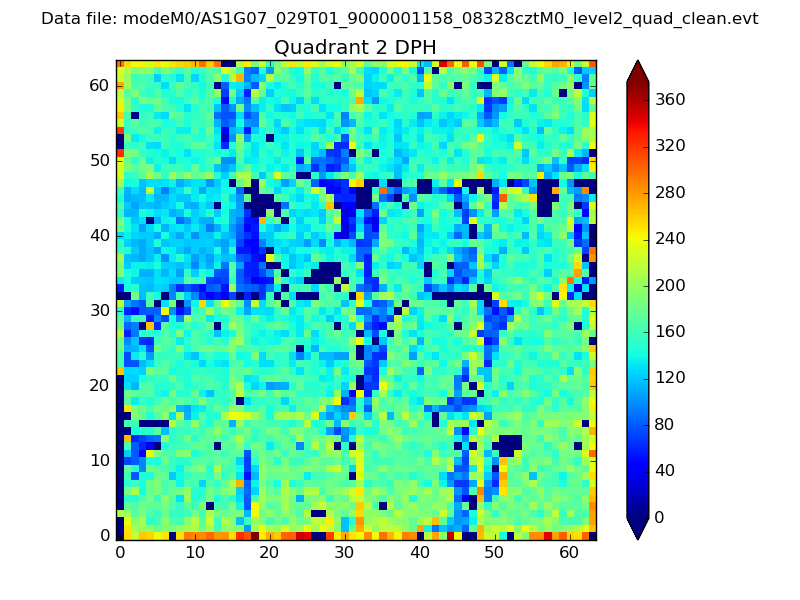
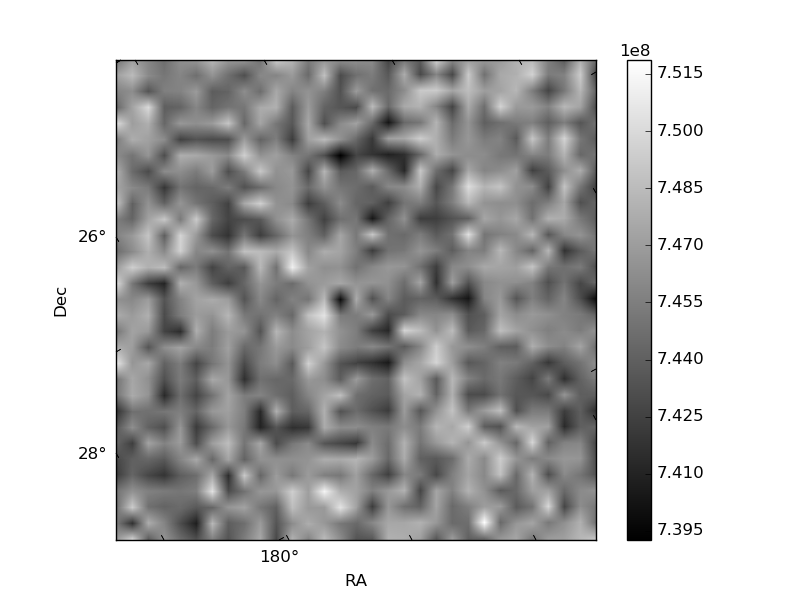
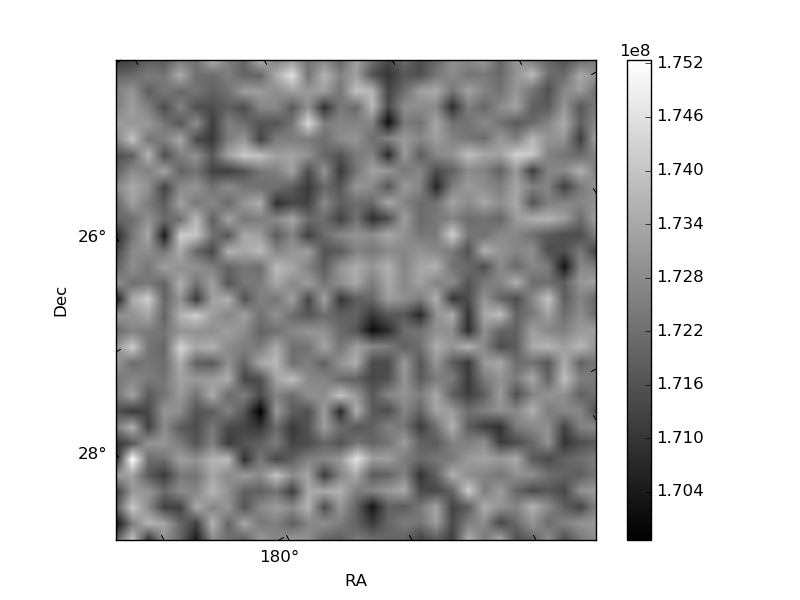
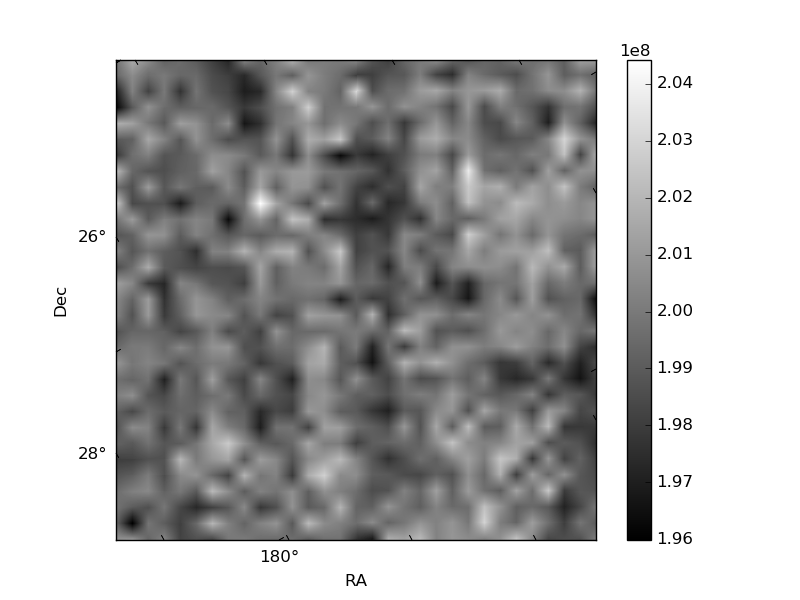
Histogram calculated using DETX and DETY for each event in the final _common_clean file
| Quadrant A | 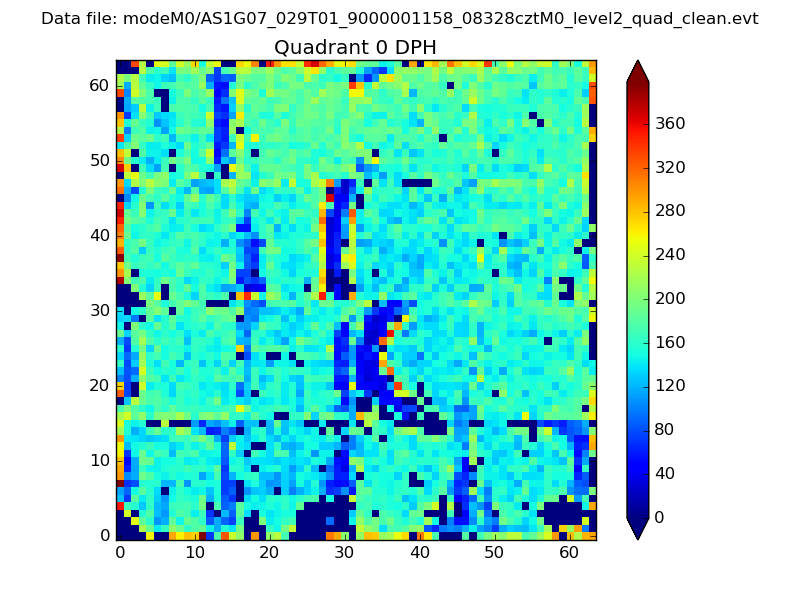 |
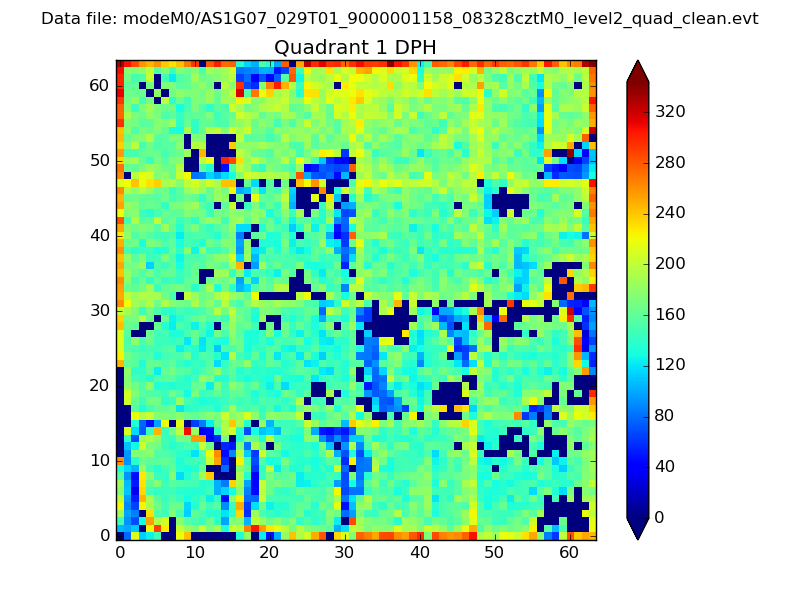 |
Quadrant B |
|---|---|---|---|
| Quadrant D | 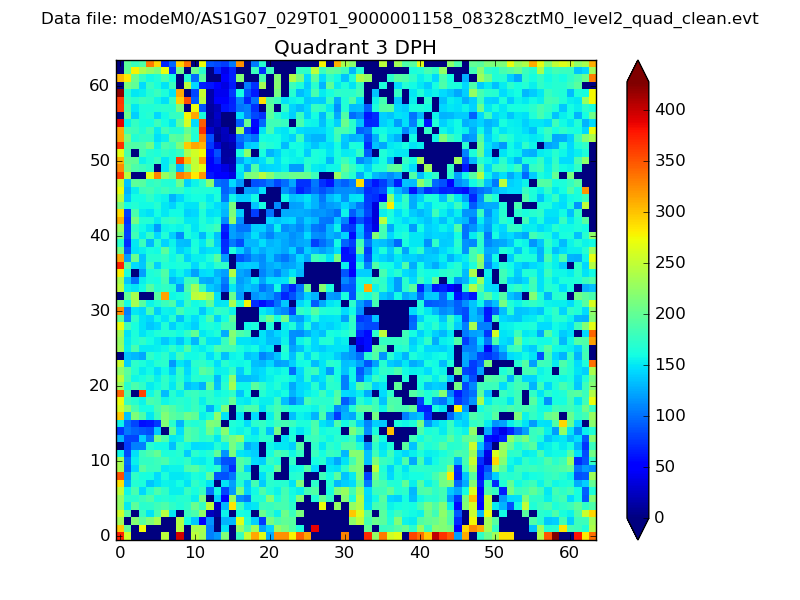 |
 |
Quadrant C |
| Plot type | Count rate plots | Images |
|---|---|---|
| Comparison with Poisson distribution Blue bars denote a histogram of data divided into 1 sec bins. Red curve is a Poisson curve with rate = median count rate of data. |
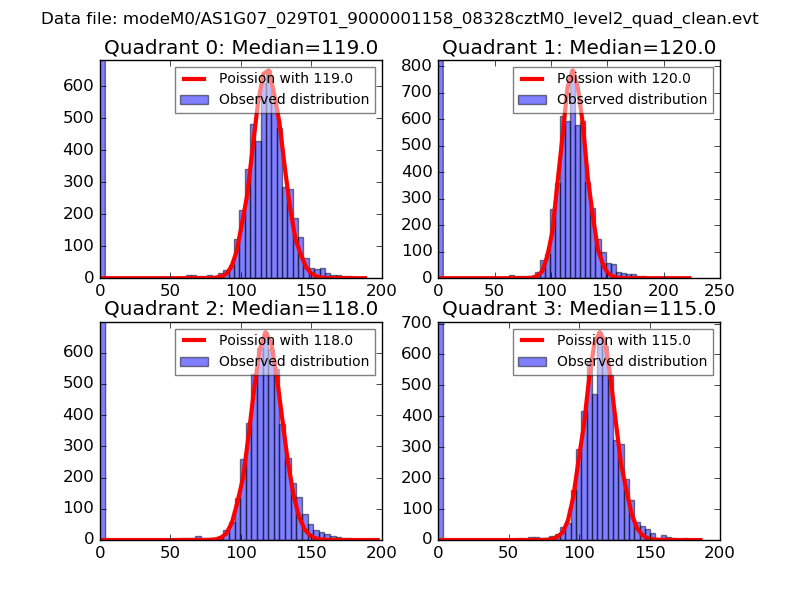 |
 |
| Quadrant-wise count rates Data is divided into 100 sec bins |
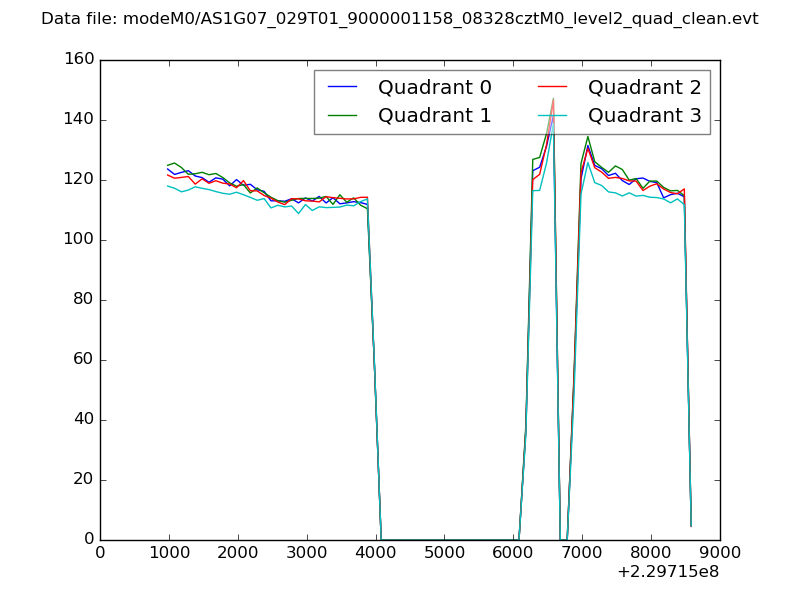 |
|
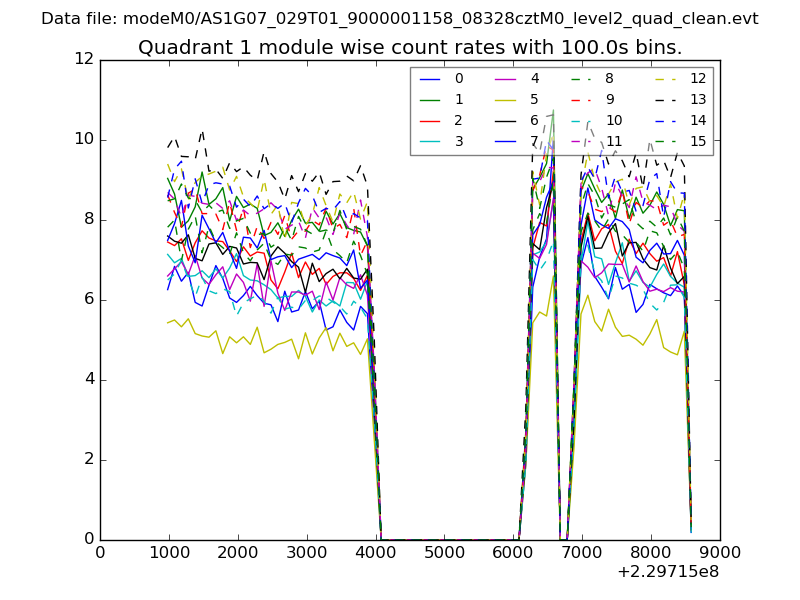
| Module-wise count rates for Quadrant A Data is divided into 100 sec bins |
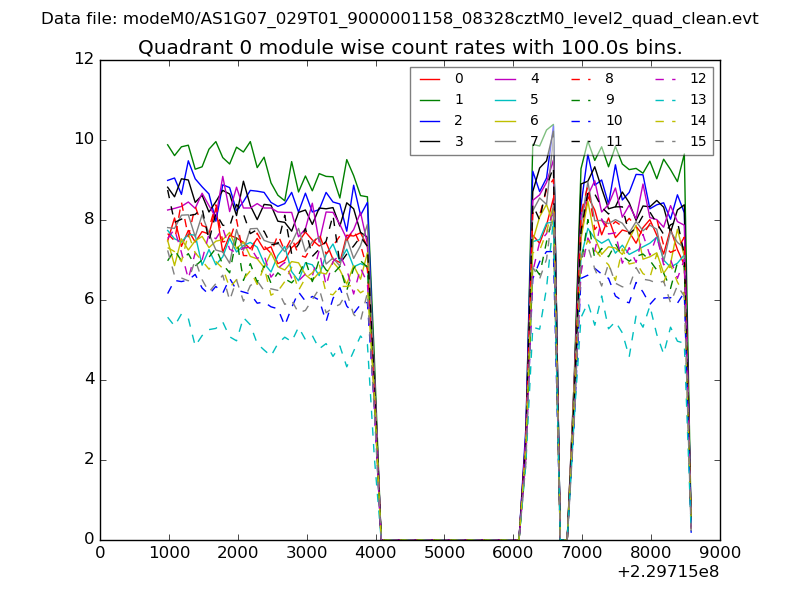 |
 |
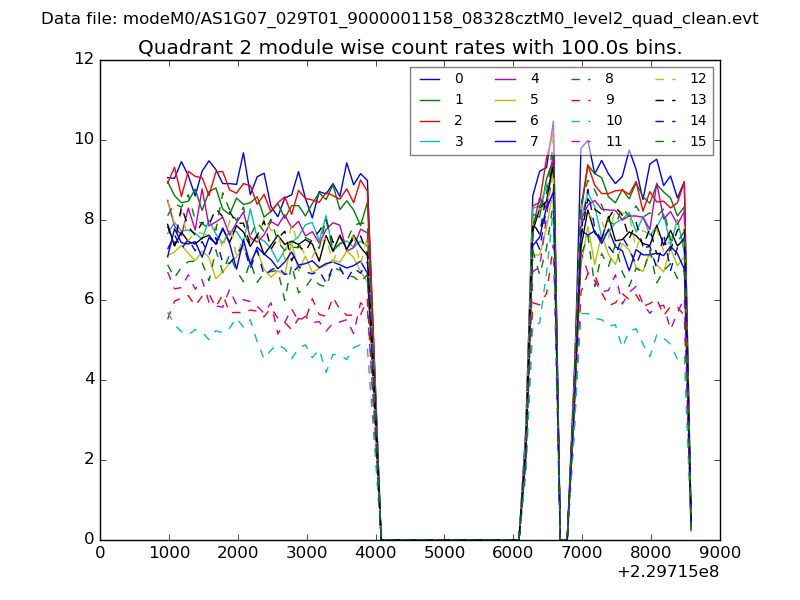
| Module-wise count rates for Quadrant B Data is divided into 100 sec bins |
 |
 |
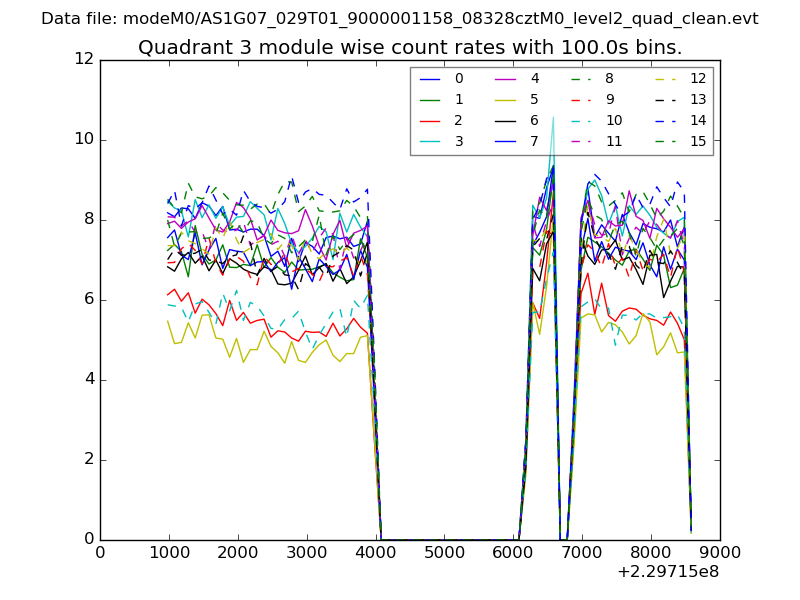
| Module-wise count rates for Quadrant C Data is divided into 100 sec bins |
 |
 |
| Module-wise count rates for Quadrant D Data is divided into 100 sec bins |
 |
 |
| Parameter | Plot |
|---|---|
| CZT HV Monitor | 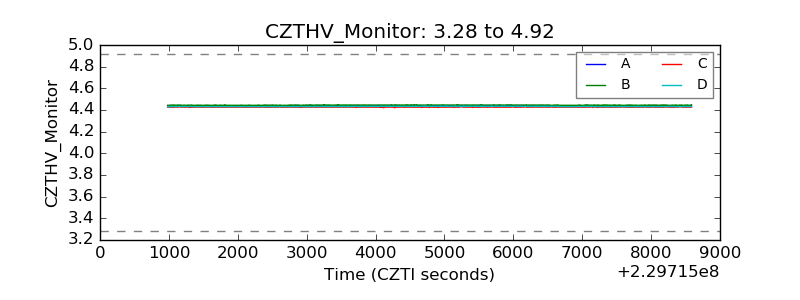 |
| D_VDD |  |
| Temperature 1 |  |
| Veto HV Monitor | 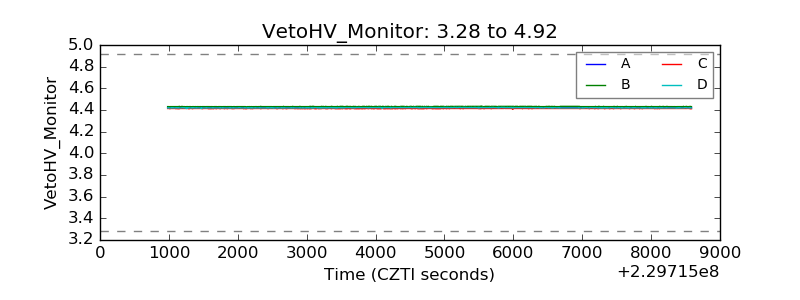 |
| Veto LLD | 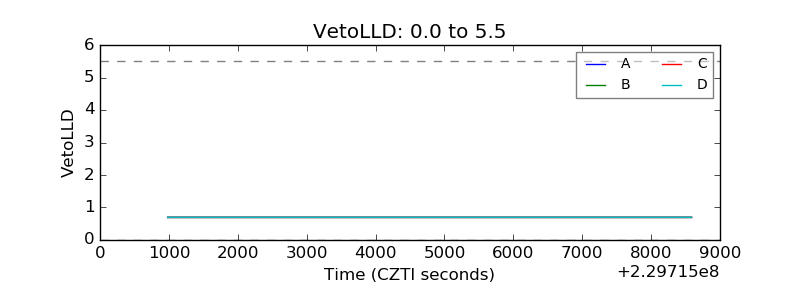 |
| Alpha Counter | 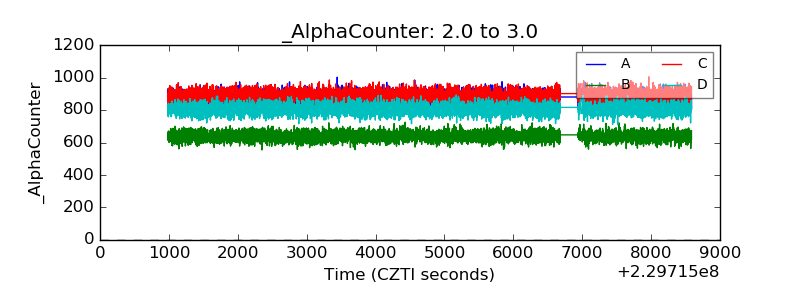 |
| _CPM_Rate | 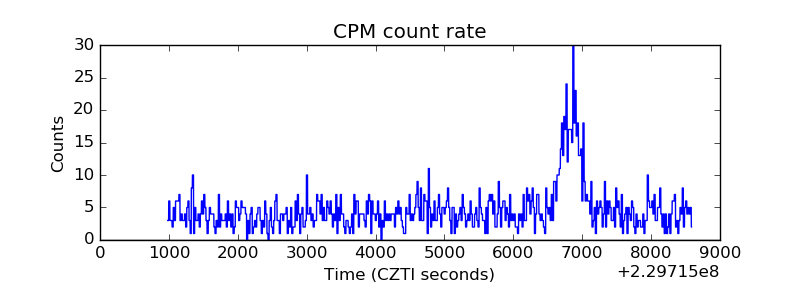 |
| CZT Counter | 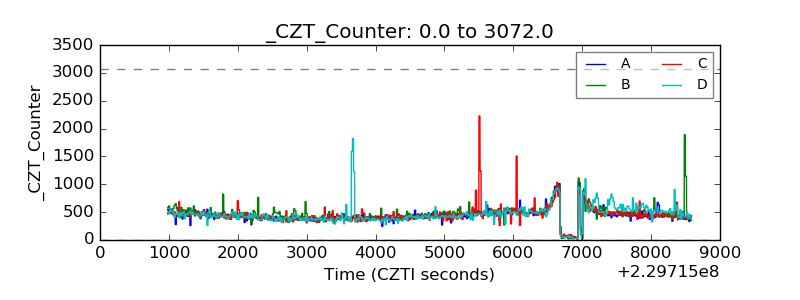 |
| +2.5 Volts monitor |  |
| +5 Volts monitor |  |
| _ROLL_ROT | 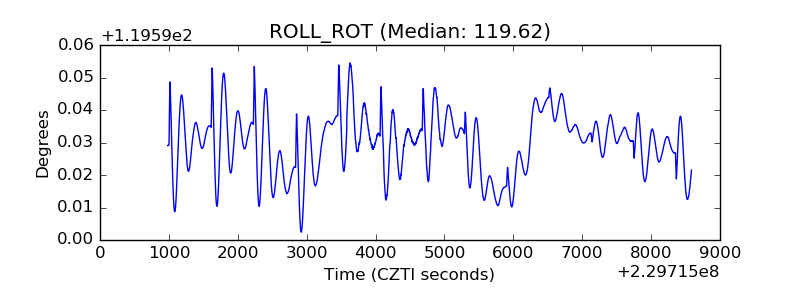 |
| _Roll_DEC |  |
| _Roll_RA | 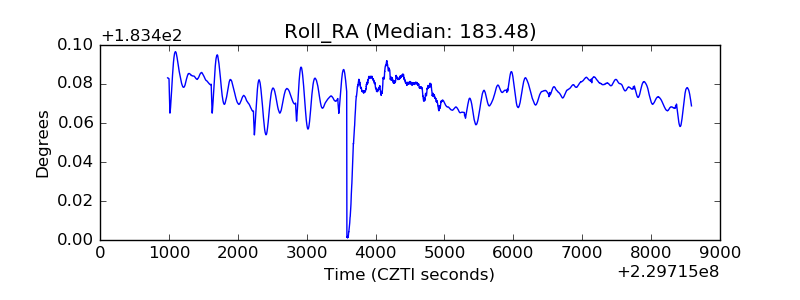 |
| Veto Counter | 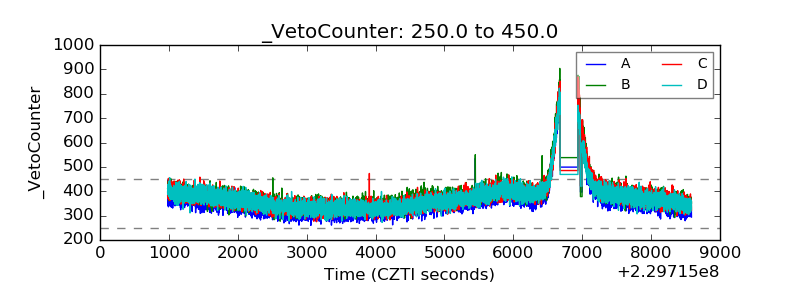 |