| Param | Original file | Final file |
|---|---|---|
| Filename | modeM0/AS1G07_029T01_9000001158_08330cztM0_level2.evt | modeM0/AS1G07_029T01_9000001158_08330cztM0_level2_quad_clean.evt |
| Size (bytes) | 802,474,560 | 159,353,280 |
| Size | 765.3 MB | 152.0 MB |
| Events in quadrant A | 5,779,822 | 989,270 |
| Events in quadrant B | 5,939,254 | 999,785 |
| Events in quadrant C | 5,712,127 | 993,247 |
| Events in quadrant D | 6,008,312 | 963,580 |
| Mode SS | |||
|---|---|---|---|
| Quadrant | BADHDUFLAG | Total packets | Discarded packets |
| A | 0 | 258 | 0 |
| B | 0 | 258 | 0 |
| C | 0 | 258 | 0 |
| D | 0 | 258 | 0 |
| Mode M0 | |||
|---|---|---|---|
| Quadrant | BADHDUFLAG | Total packets | Discarded packets |
| A | 0 | 26184 | 3 |
| B | 0 | 26430 | 2 |
| C | 0 | 26081 | 2 |
| D | 0 | 27017 | 2 |
| Mode M9 | |||
|---|---|---|---|
| Quadrant | BADHDUFLAG | Total packets | Discarded packets |
| A | 0 | 12 | 0 |
| B | 0 | 12 | 0 |
| C | 0 | 12 | 0 |
| D | 0 | 12 | 0 |
| Quadrant | Total seconds | Saturated seconds | Saturation percentage |
|---|---|---|---|
| A | 12741 | 63 | 0.494467% |
| B | 12741 | 76 | 0.596499% |
| C | 12741 | 36 | 0.282552% |
| D | 12741 | 47 | 0.368888% |
Noise dominated data is calculated using 1-second bins in cleaned event files. If a bin has >2000 counts, and if more than 50% of those come from <1% of pixels, then it is considered to be noise-dominated and hence unusable.
| Quadrant | # 1 sec bins | Bins with >0 counts | Bins with >2000 counts | High rate bins dominated by noise | Noise dominated (total time) | Noise dominated (detector-on time) | Marked lightcurve |
|---|---|---|---|---|---|---|---|
| A | 13961 | 12743 | 1 | 1 | 0.01% | 0.01% | 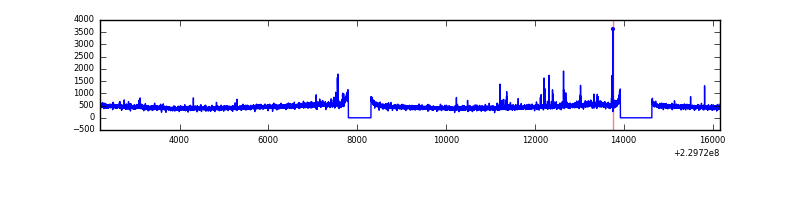 |
| B | 13961 | 12743 | 2 | 2 | 0.01% | 0.02% | 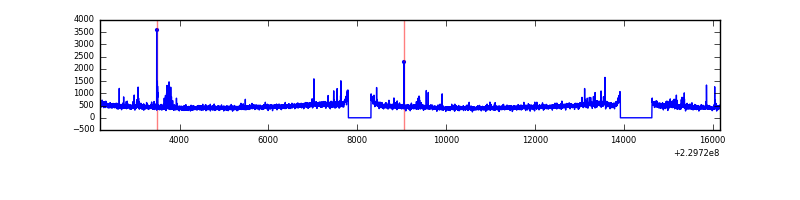 |
| C | 13961 | 12743 | 4 | 4 | 0.03% | 0.03% | 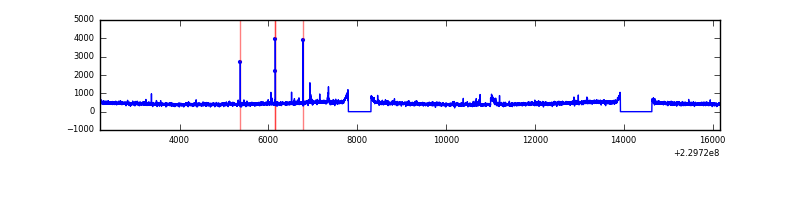 |
| D | 13961 | 12743 | 14 | 14 | 0.10% | 0.11% | 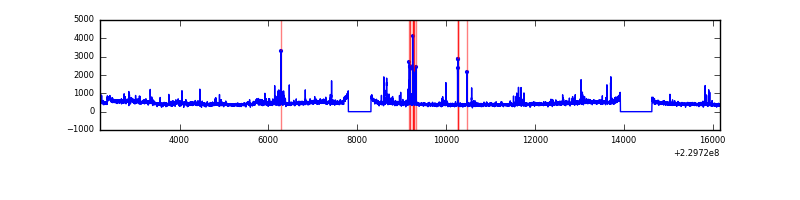 |
Top three noisy pixels from each quadrant. If the there are fewer than three noisy pixels in the level2.evt file, extra rows are filled as -1
| Pixel properties | Quadrant properties | ||||||
|---|---|---|---|---|---|---|---|
| Quadrant | DetID | PixID | Counts | Sigma | Mean | Median | Sigma |
| A | 13 | 248 | 50249 | 164.09 | 1464 | 1431 | 297.5 |
| A | 15 | 234 | 39854 | 129.15 | 1464 | 1431 | 297.5 |
| A | 15 | 223 | 27413 | 87.33 | 1464 | 1431 | 297.5 |
| B | 0 | 214 | 98255 | 342.82 | 1472 | 1434 | 282.4 |
| B | 4 | 81 | 54307 | 187.21 | 1472 | 1434 | 282.4 |
| B | 0 | 219 | 31889 | 107.83 | 1472 | 1434 | 282.4 |
| C | 9 | 54 | 98103 | 289.0 | 1434 | 1435 | 334.5 |
| C | 8 | 128 | 14400 | 38.76 | 1434 | 1435 | 334.5 |
| C | 13 | 61 | 10980 | 28.54 | 1434 | 1435 | 334.5 |
| D | 1 | 52 | 249542 | 704.62 | 1422 | 1383 | 352.2 |
| D | 2 | 152 | 128439 | 360.76 | 1422 | 1383 | 352.2 |
| D | 2 | 14 | 116420 | 326.63 | 1422 | 1383 | 352.2 |
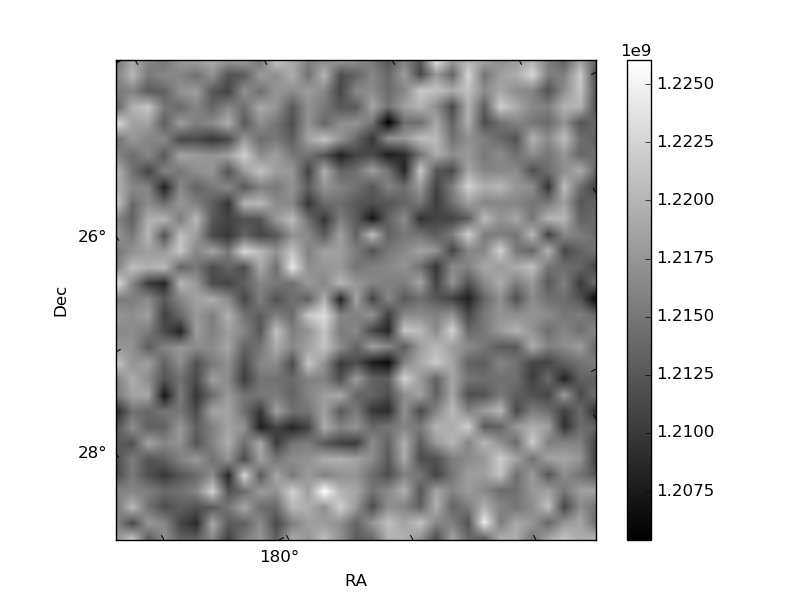
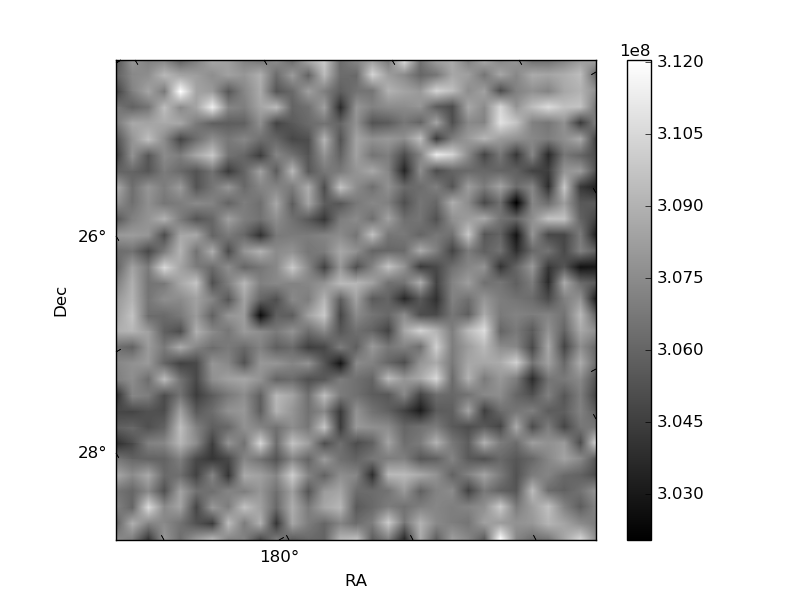
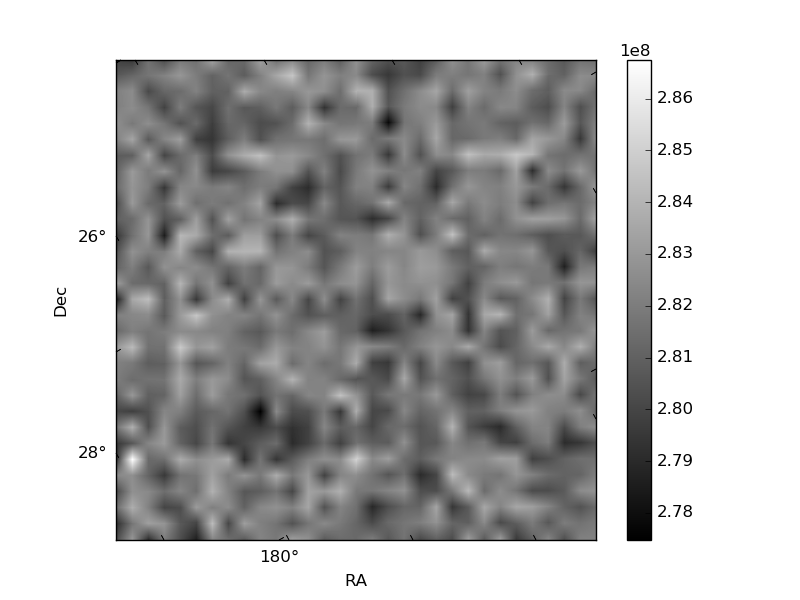
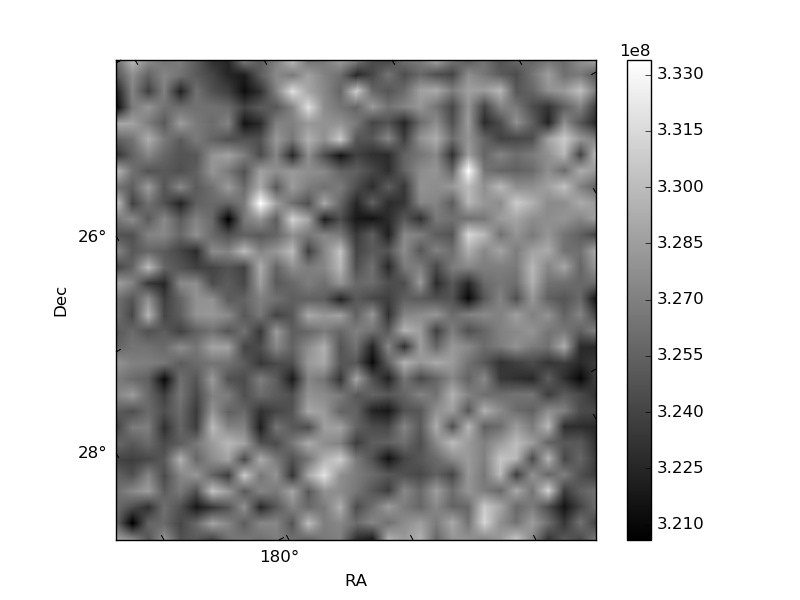
Histogram calculated using DETX and DETY for each event in the final _common_clean file
| Quadrant A | 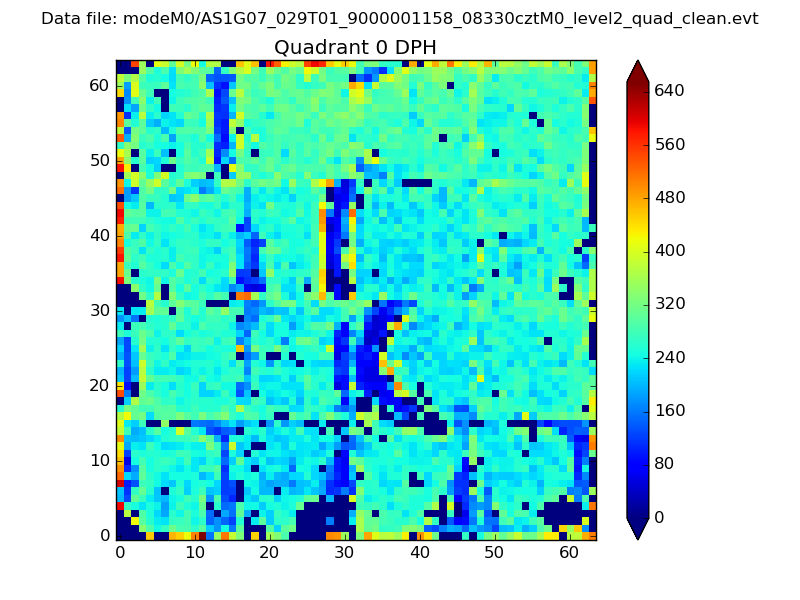 |
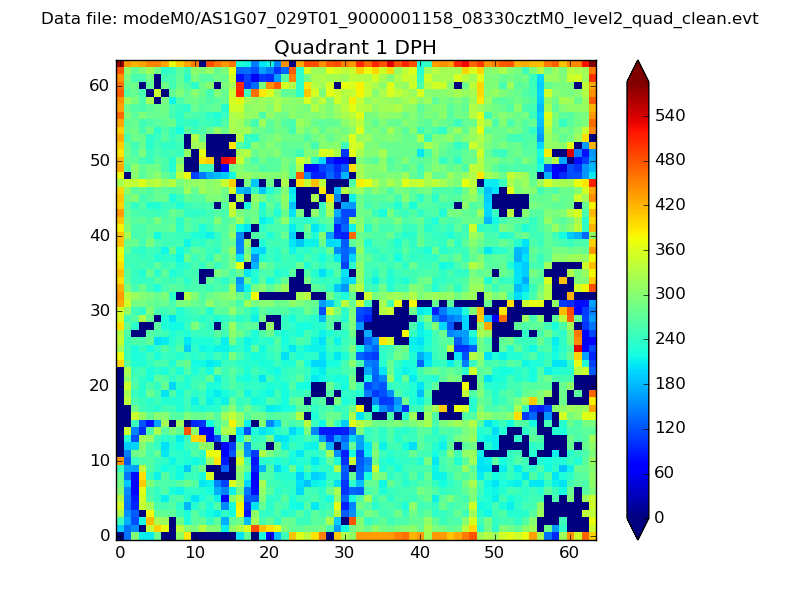 |
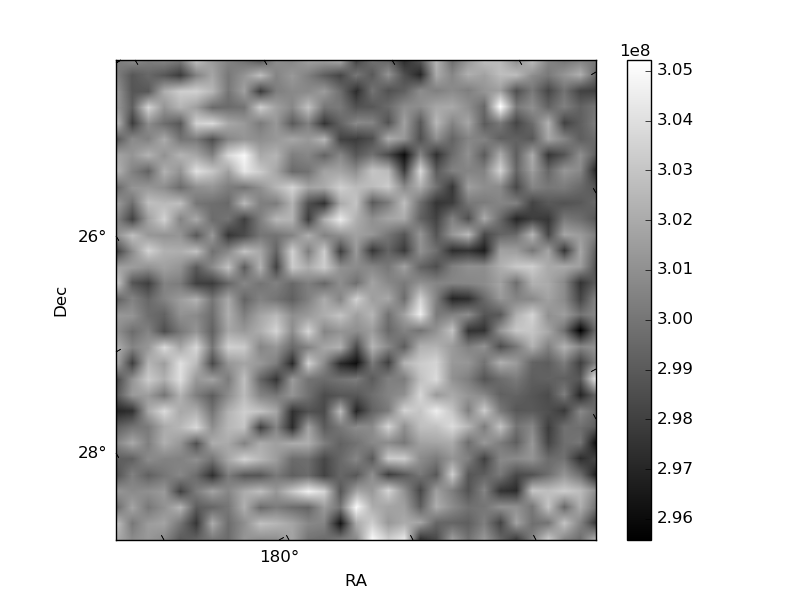
Quadrant B |
|---|---|---|---|
| Quadrant D | 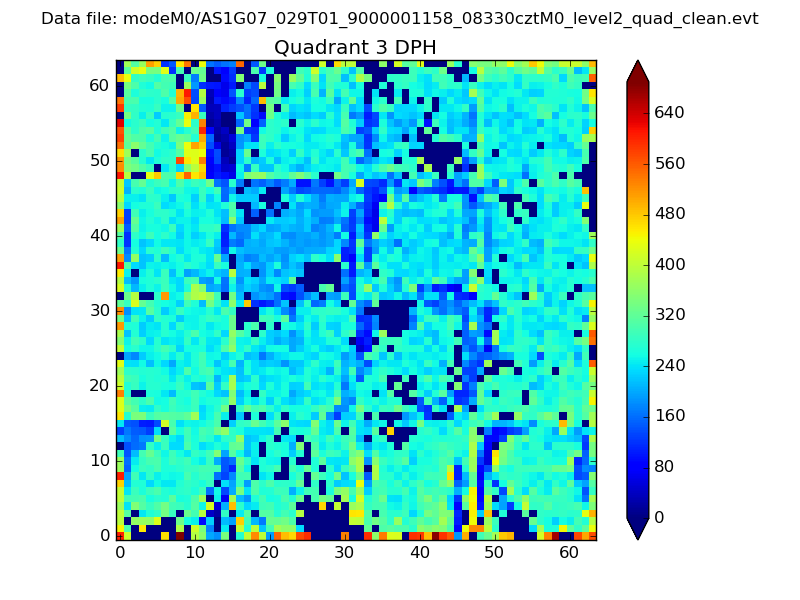 |
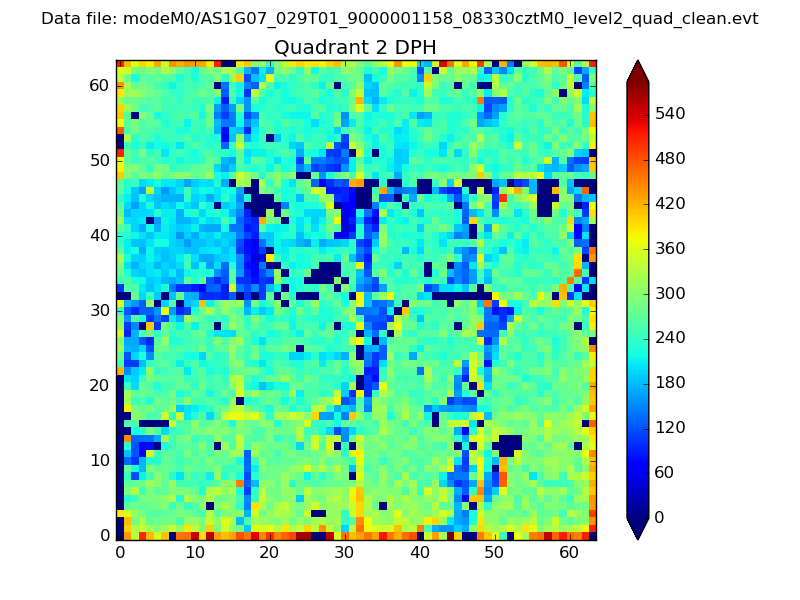 |
Quadrant C |
| Plot type | Count rate plots | Images |
|---|---|---|
| Comparison with Poisson distribution Blue bars denote a histogram of data divided into 1 sec bins. Red curve is a Poisson curve with rate = median count rate of data. |
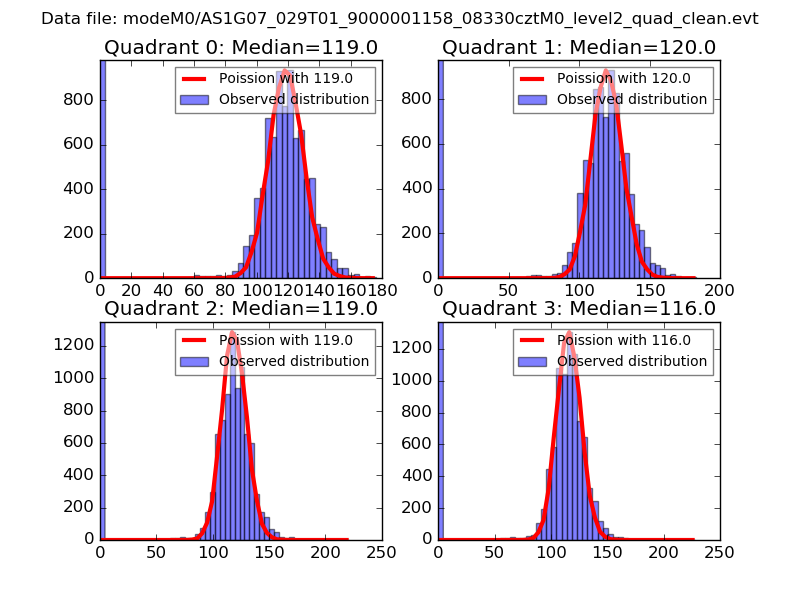 |
 |
| Quadrant-wise count rates Data is divided into 100 sec bins |
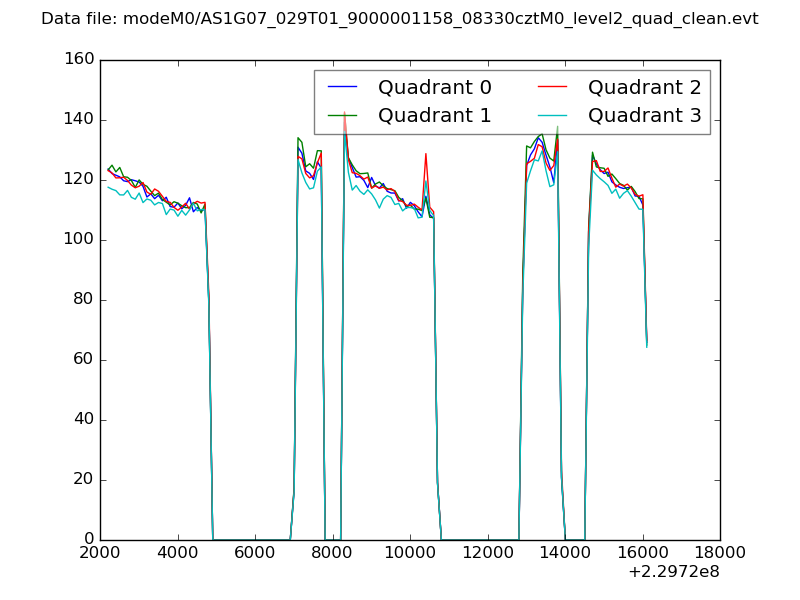 |
|
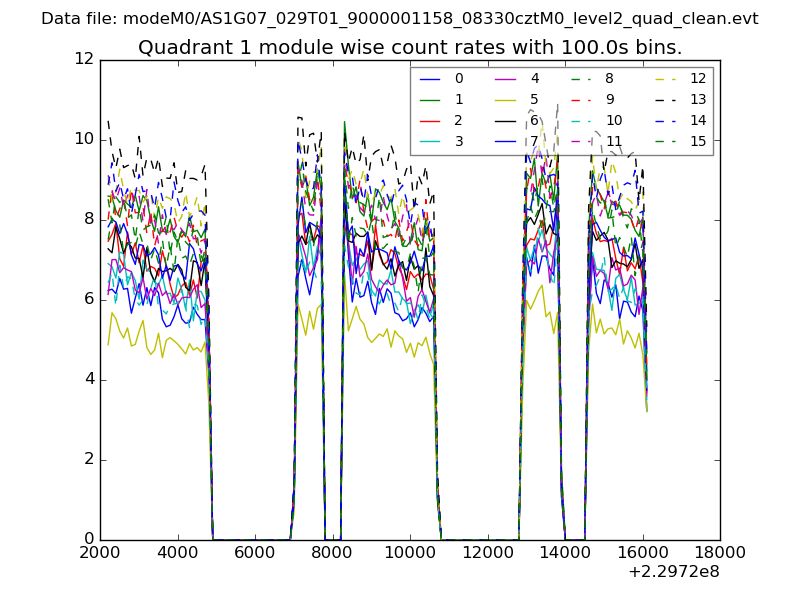
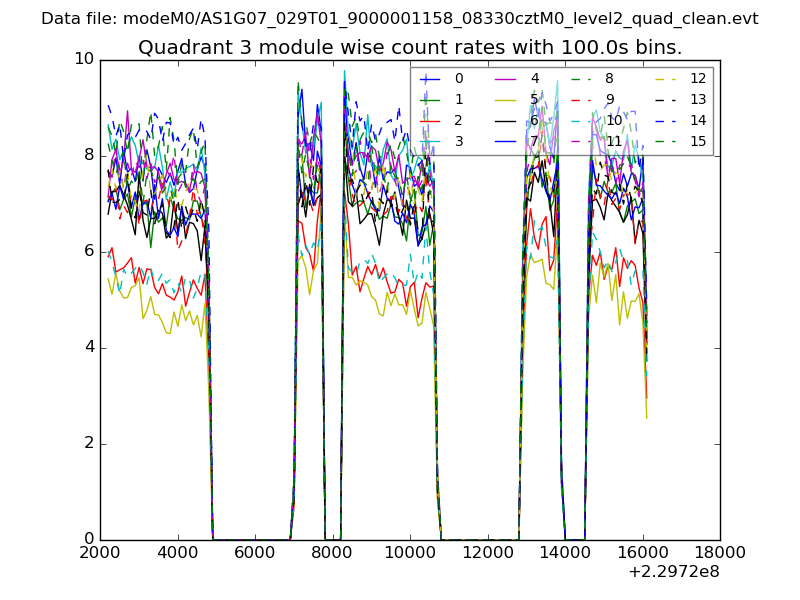
| Module-wise count rates for Quadrant A Data is divided into 100 sec bins |
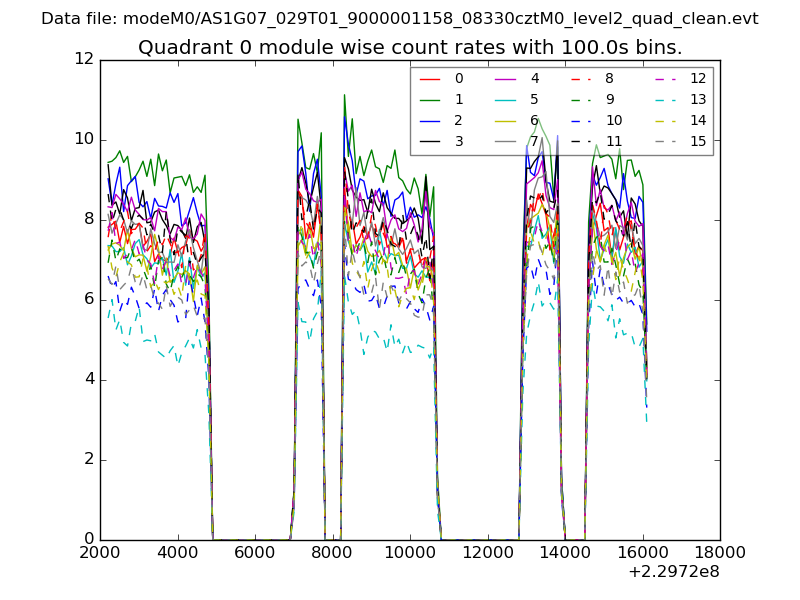 |
 |
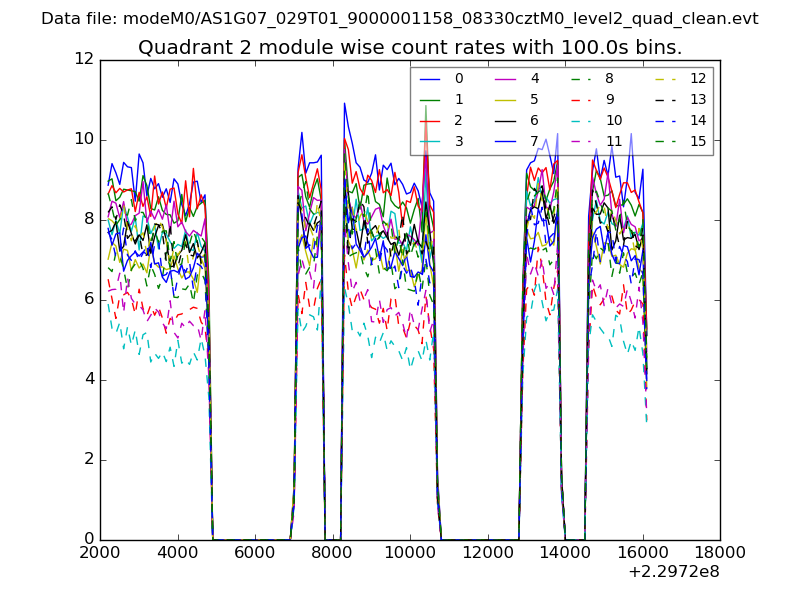
| Module-wise count rates for Quadrant B Data is divided into 100 sec bins |
 |
 |
| Module-wise count rates for Quadrant C Data is divided into 100 sec bins |
 |
 |
| Module-wise count rates for Quadrant D Data is divided into 100 sec bins |
 |
 |
| Parameter | Plot |
|---|---|
| CZT HV Monitor | 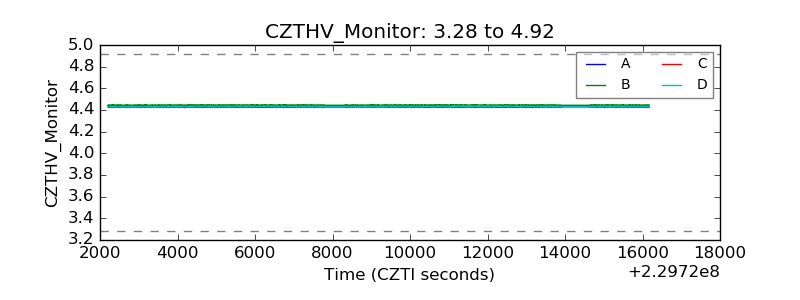 |
| D_VDD | 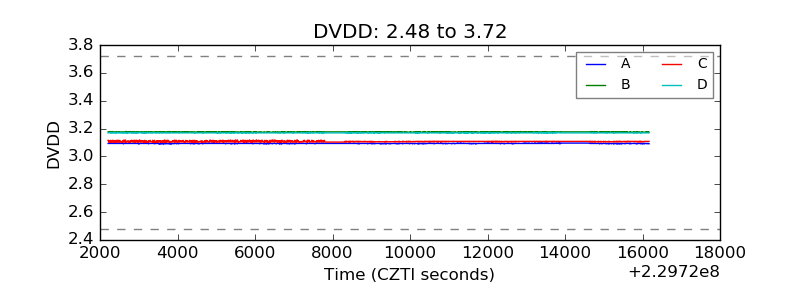 |
| Temperature 1 | 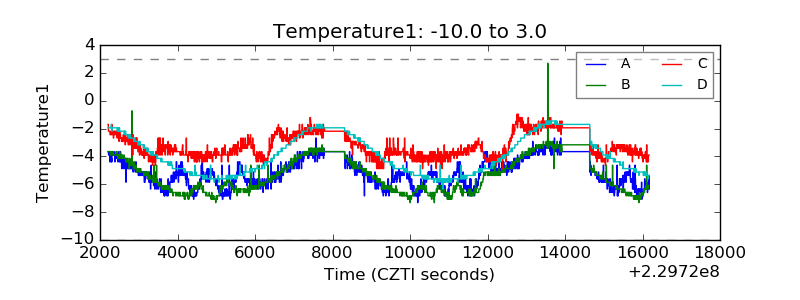 |
| Veto HV Monitor | 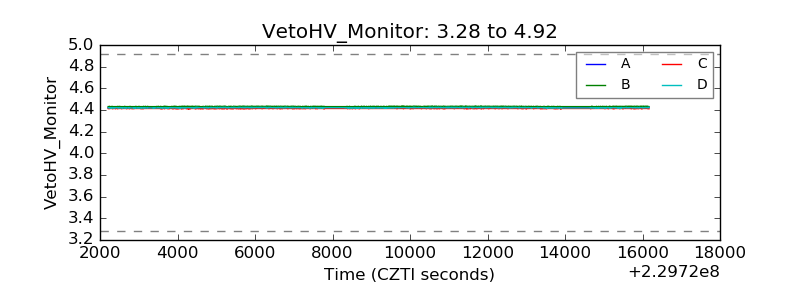 |
| Veto LLD | 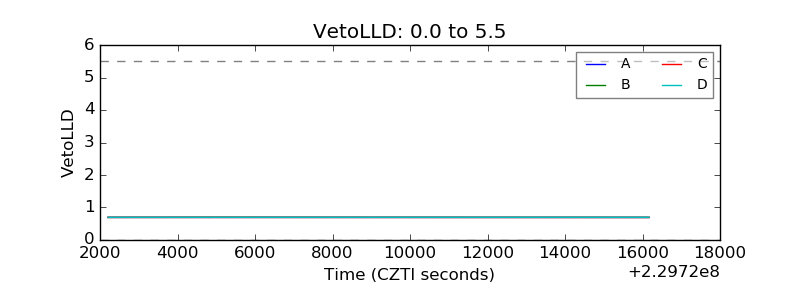 |
| Alpha Counter | 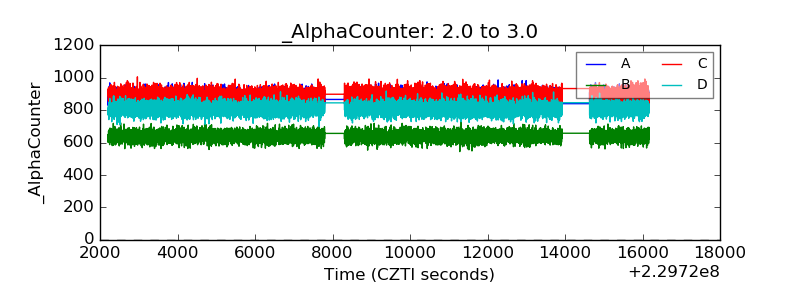 |
| _CPM_Rate | 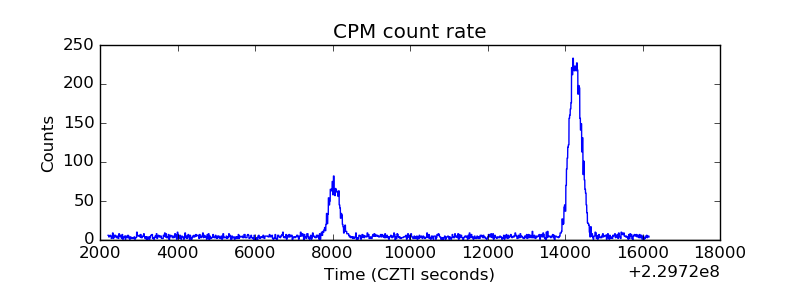 |
| CZT Counter | 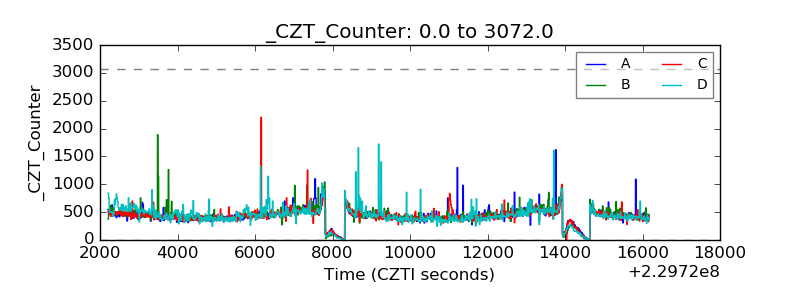 |
| +2.5 Volts monitor |  |
| +5 Volts monitor | 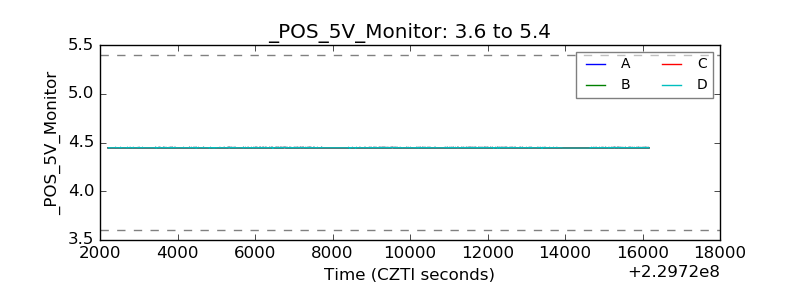 |
| _ROLL_ROT | 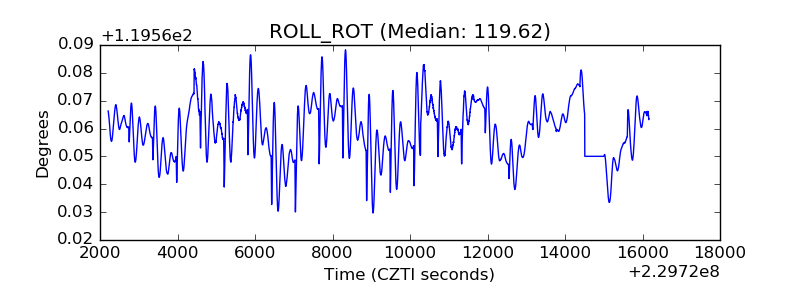 |
| _Roll_DEC |  |
| _Roll_RA | 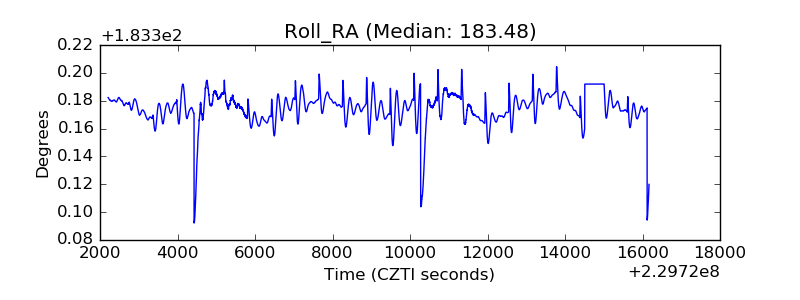 |
| Veto Counter | 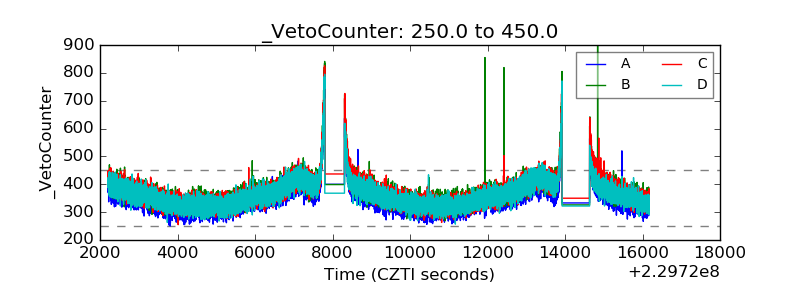 |