| Param | Original file | Final file |
|---|---|---|
| Filename | modeM0/AS1G07_029T01_9000001158_08331cztM0_level2.evt | modeM0/AS1G07_029T01_9000001158_08331cztM0_level2_quad_clean.evt |
| Size (bytes) | 412,067,520 | 82,929,600 |
| Size | 393.0 MB | 79.1 MB |
| Events in quadrant A | 3,009,927 | 517,352 |
| Events in quadrant B | 2,988,308 | 522,823 |
| Events in quadrant C | 3,193,362 | 517,312 |
| Events in quadrant D | 2,847,874 | 502,758 |
| Mode SS | |||
|---|---|---|---|
| Quadrant | BADHDUFLAG | Total packets | Discarded packets |
| A | 0 | 132 | 0 |
| B | 0 | 132 | 0 |
| C | 0 | 132 | 0 |
| D | 0 | 132 | 0 |
| Mode M0 | |||
|---|---|---|---|
| Quadrant | BADHDUFLAG | Total packets | Discarded packets |
| A | 0 | 13179 | 2 |
| B | 0 | 13283 | 1 |
| C | 0 | 14015 | 1 |
| D | 0 | 13302 | 1 |
| Mode M9 | |||
|---|---|---|---|
| Quadrant | BADHDUFLAG | Total packets | Discarded packets |
| A | 0 | 9 | 0 |
| B | 0 | 9 | 0 |
| C | 0 | 9 | 0 |
| D | 0 | 9 | 0 |
| Quadrant | Total seconds | Saturated seconds | Saturation percentage |
|---|---|---|---|
| A | 6464 | 21 | 0.324876% |
| B | 6464 | 22 | 0.340347% |
| C | 6464 | 74 | 1.144802% |
| D | 6464 | 12 | 0.185644% |
Noise dominated data is calculated using 1-second bins in cleaned event files. If a bin has >2000 counts, and if more than 50% of those come from <1% of pixels, then it is considered to be noise-dominated and hence unusable.
| Quadrant | # 1 sec bins | Bins with >0 counts | Bins with >2000 counts | High rate bins dominated by noise | Noise dominated (total time) | Noise dominated (detector-on time) | Marked lightcurve |
|---|---|---|---|---|---|---|---|
| A | 7344 | 6465 | 0 | 0 | 0.00% | 0.00% | 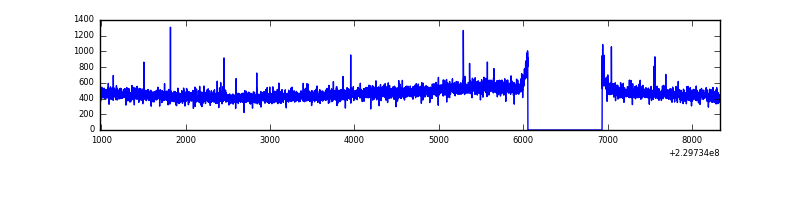 |
| B | 7344 | 6465 | 1 | 1 | 0.01% | 0.02% | 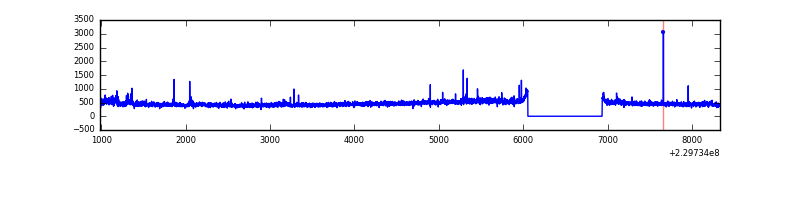 |
| C | 7344 | 6465 | 52 | 52 | 0.71% | 0.80% | 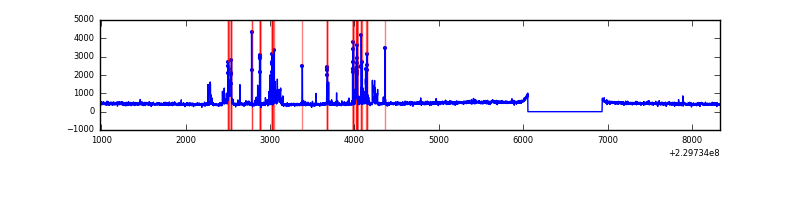 |
| D | 7344 | 6465 | 5 | 5 | 0.07% | 0.08% | 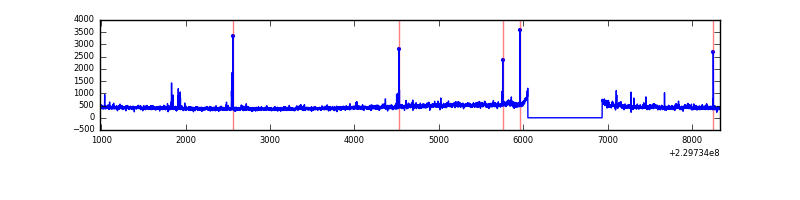 |
Top three noisy pixels from each quadrant. If the there are fewer than three noisy pixels in the level2.evt file, extra rows are filled as -1
| Pixel properties | Quadrant properties | ||||||
|---|---|---|---|---|---|---|---|
| Quadrant | DetID | PixID | Counts | Sigma | Mean | Median | Sigma |
| A | 15 | 234 | 155017 | 1005.72 | 739 | 724 | 153.4 |
| A | 14 | 111 | 7712 | 45.55 | 739 | 724 | 153.4 |
| A | 13 | 248 | 7467 | 43.95 | 739 | 724 | 153.4 |
| B | 4 | 81 | 46349 | 317.22 | 744 | 724 | 143.8 |
| B | 0 | 214 | 36892 | 251.47 | 744 | 724 | 143.8 |
| B | 12 | 111 | 16060 | 106.63 | 744 | 724 | 143.8 |
| C | 9 | 54 | 388233 | 2315.85 | 719 | 722 | 167.3 |
| C | 13 | 61 | 5501 | 28.56 | 719 | 722 | 167.3 |
| C | 3 | 202 | 1818 | 6.55 | 719 | 722 | 167.3 |
| D | 2 | 14 | 46316 | 265.04 | 715 | 697 | 172.1 |
| D | 2 | 152 | 40026 | 228.49 | 715 | 697 | 172.1 |
| D | 5 | 81 | 24323 | 137.26 | 715 | 697 | 172.1 |
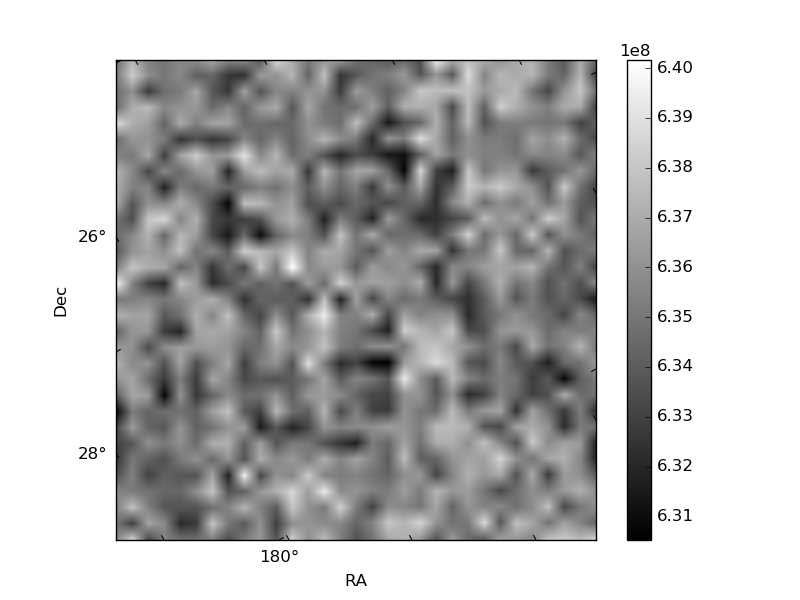
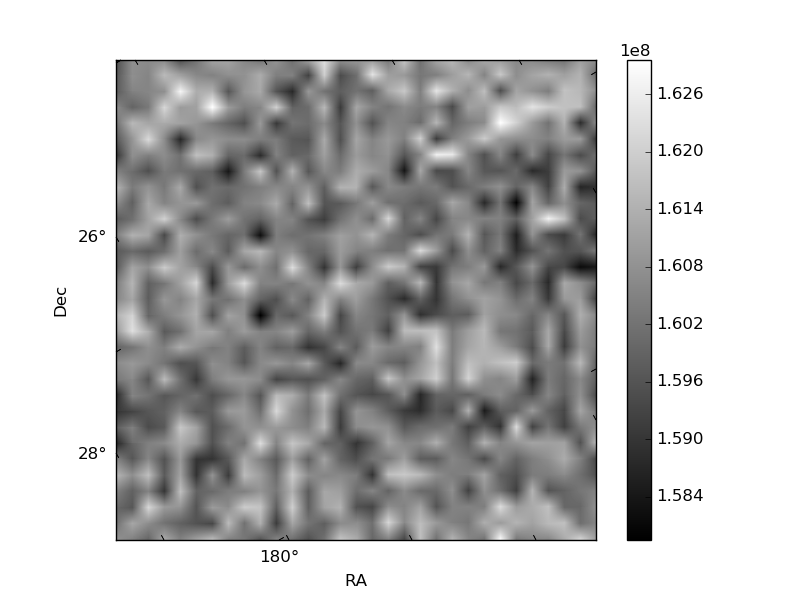
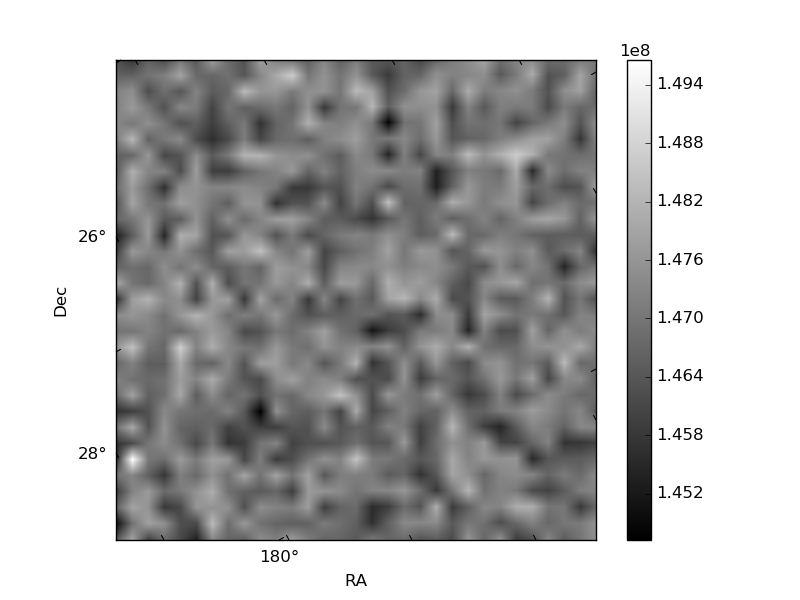
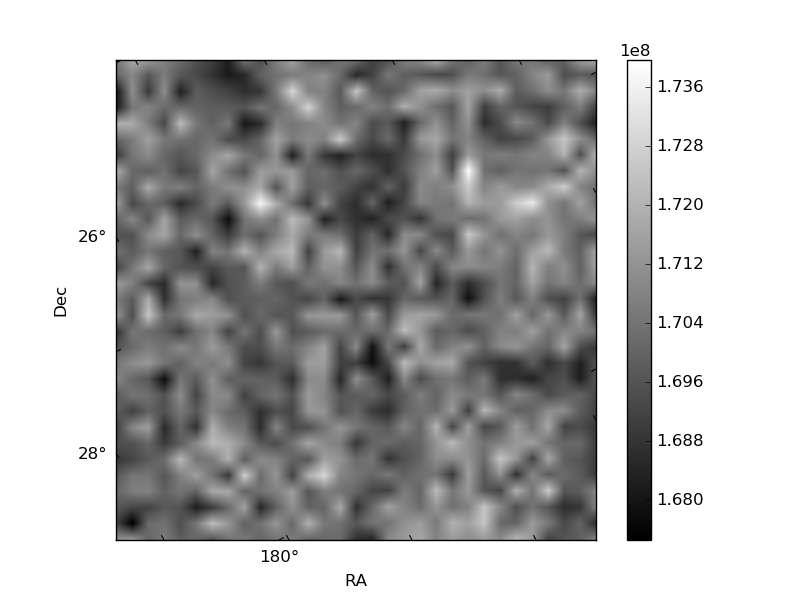
Histogram calculated using DETX and DETY for each event in the final _common_clean file
| Quadrant A | 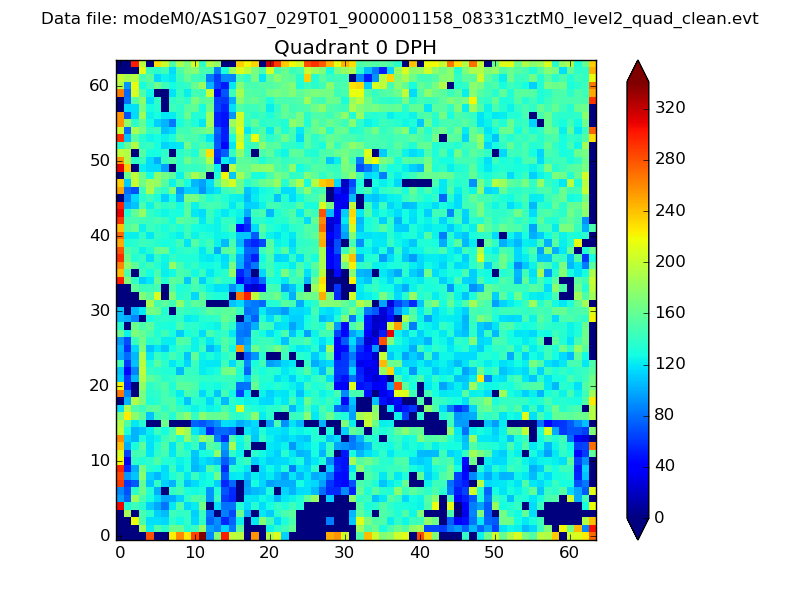 |
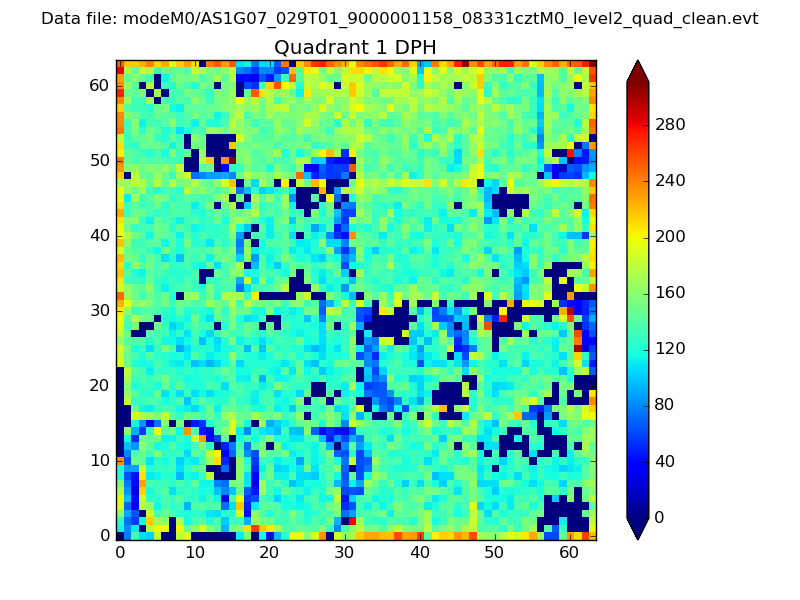 |
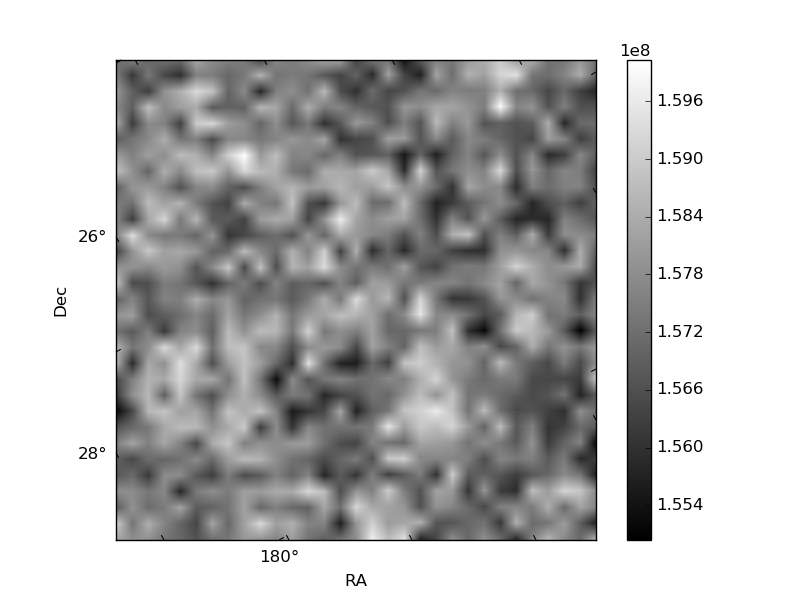
Quadrant B |
|---|---|---|---|
| Quadrant D | 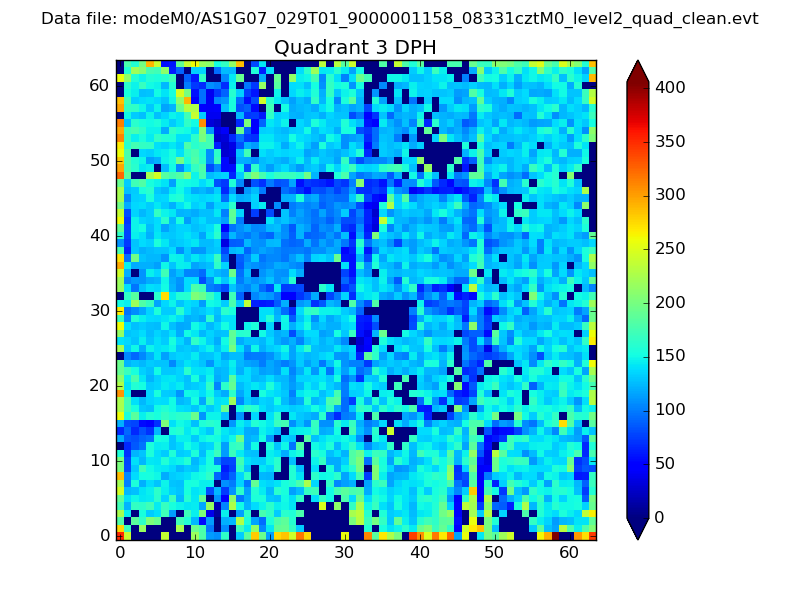 |
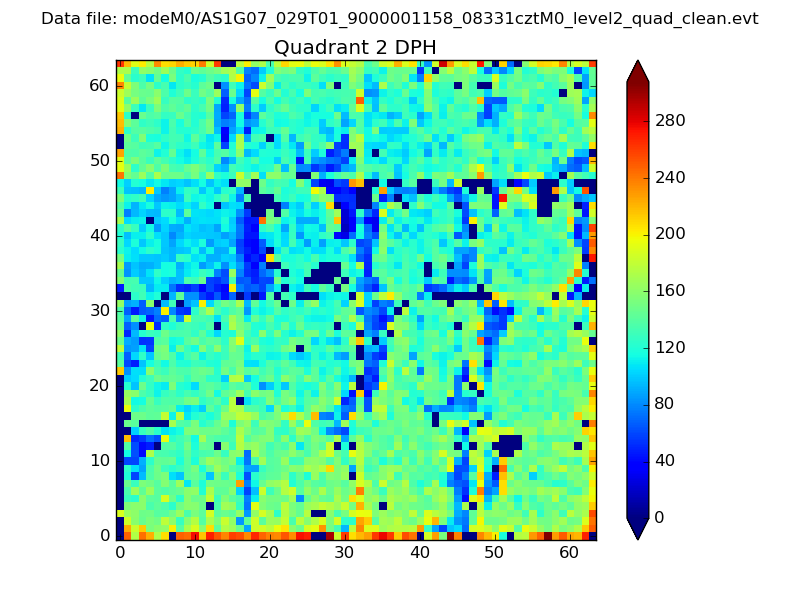 |
Quadrant C |
| Plot type | Count rate plots | Images |
|---|---|---|
| Comparison with Poisson distribution Blue bars denote a histogram of data divided into 1 sec bins. Red curve is a Poisson curve with rate = median count rate of data. |
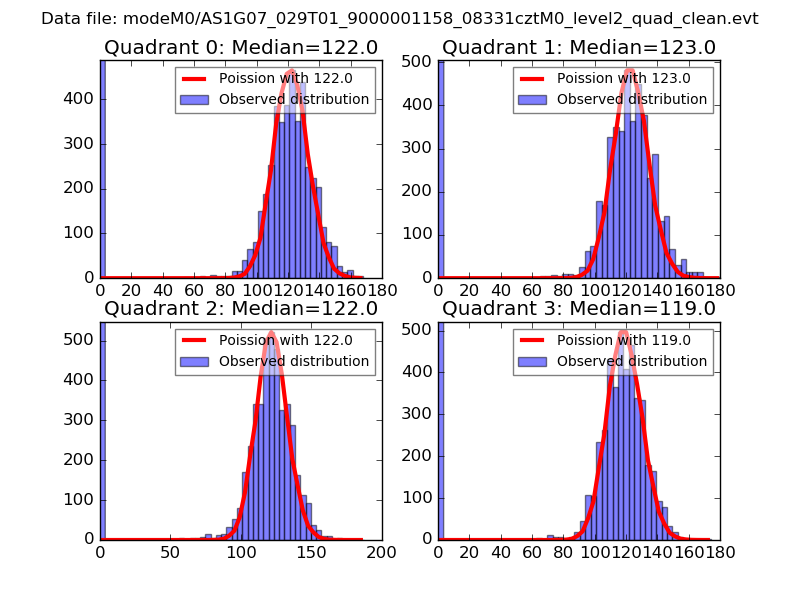 |
 |
| Quadrant-wise count rates Data is divided into 100 sec bins |
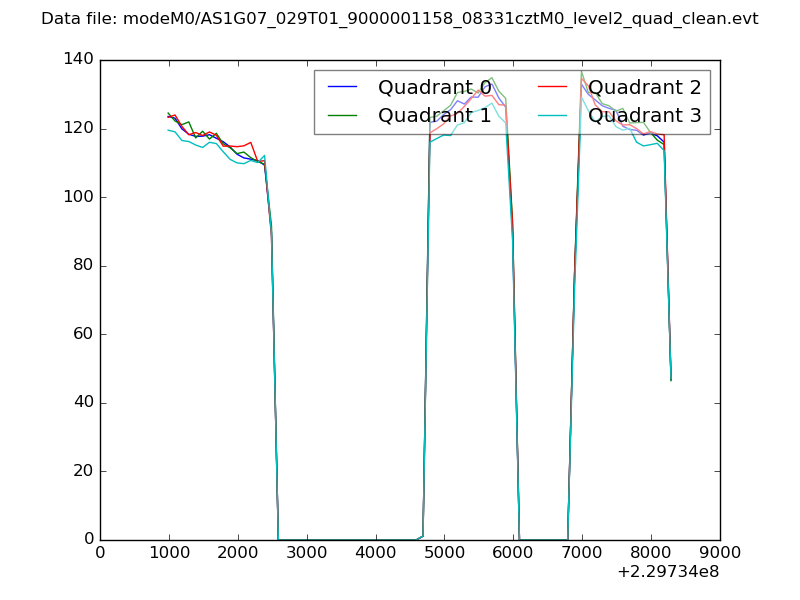 |
|
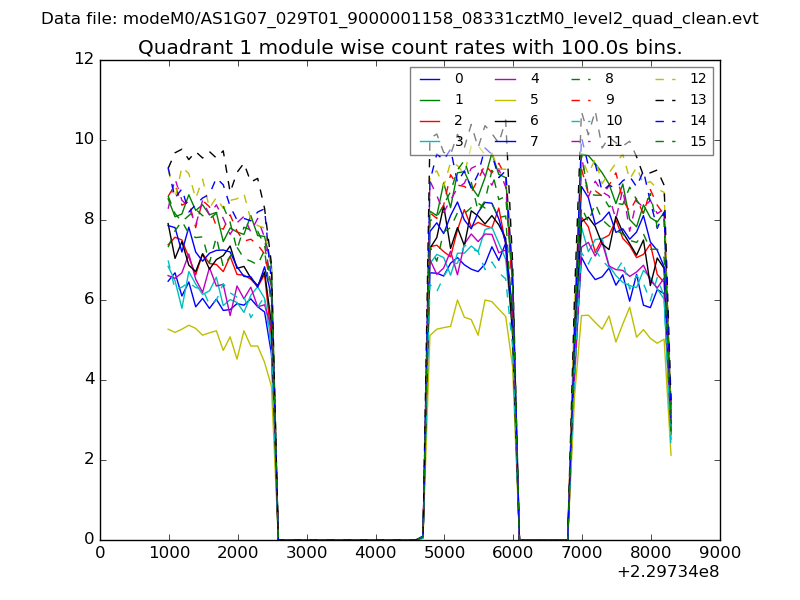
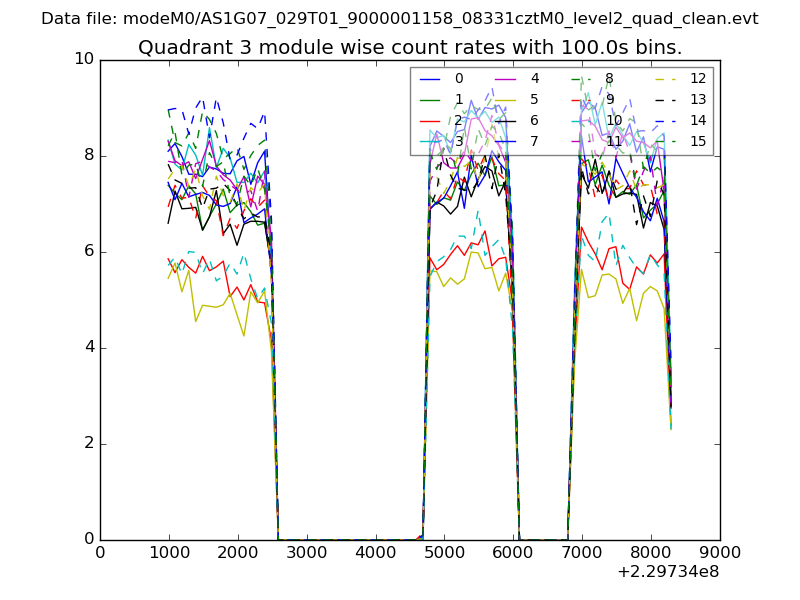
| Module-wise count rates for Quadrant A Data is divided into 100 sec bins |
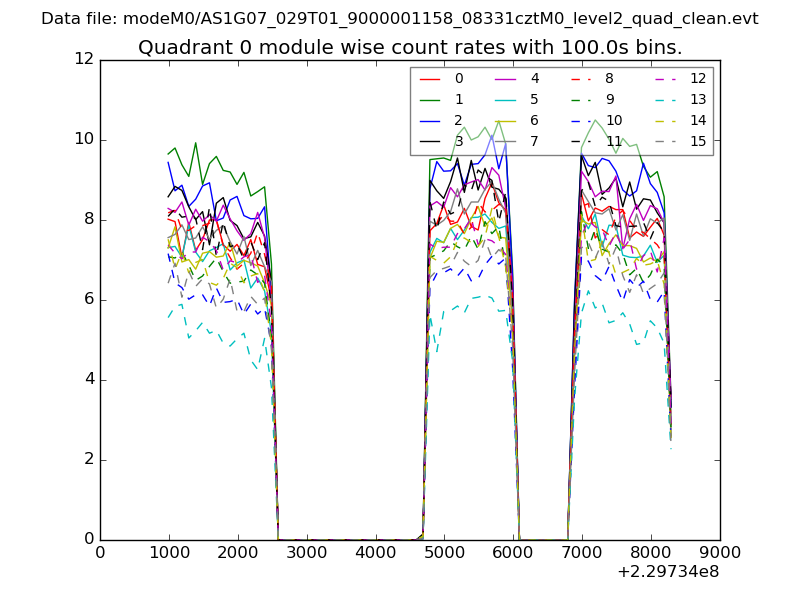 |
 |
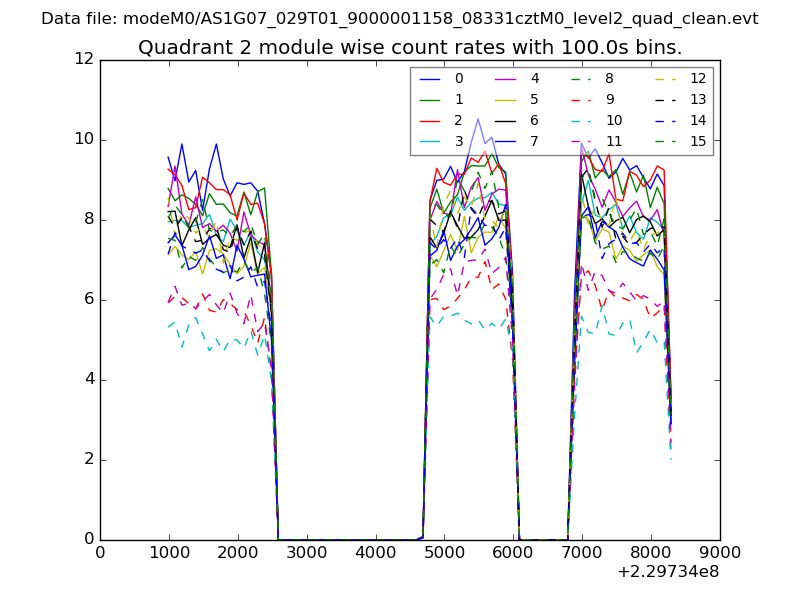
| Module-wise count rates for Quadrant B Data is divided into 100 sec bins |
 |
 |
| Module-wise count rates for Quadrant C Data is divided into 100 sec bins |
 |
 |
| Module-wise count rates for Quadrant D Data is divided into 100 sec bins |
 |
 |
| Parameter | Plot |
|---|---|
| CZT HV Monitor | 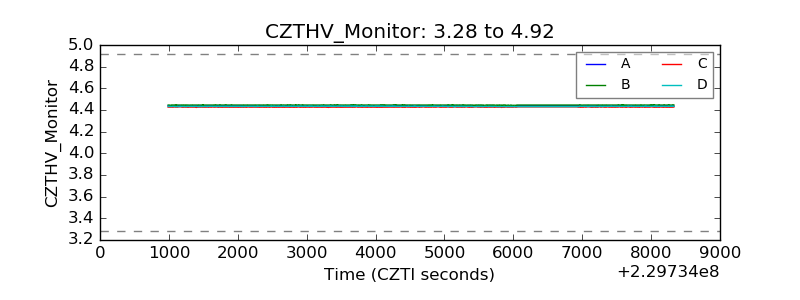 |
| D_VDD | 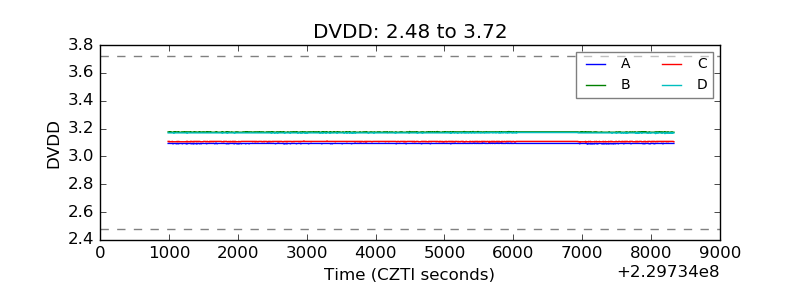 |
| Temperature 1 |  |
| Veto HV Monitor | 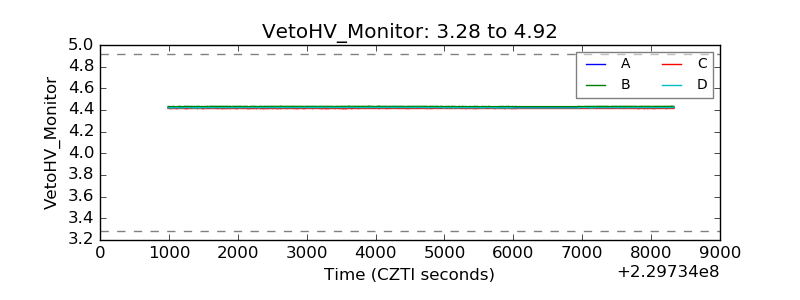 |
| Veto LLD | 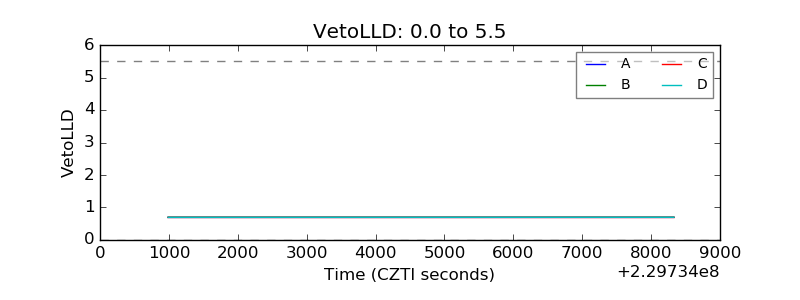 |
| Alpha Counter | 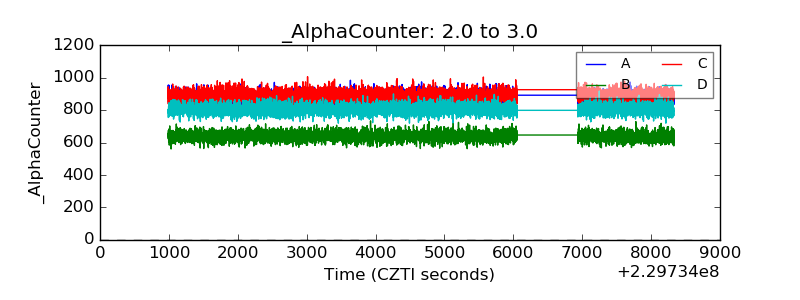 |
| _CPM_Rate |  |
| CZT Counter | 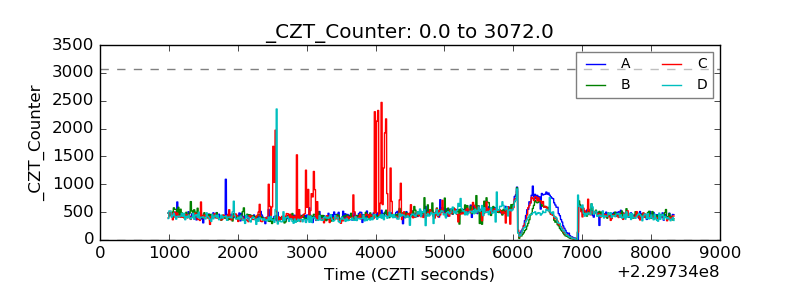 |
| +2.5 Volts monitor |  |
| +5 Volts monitor | 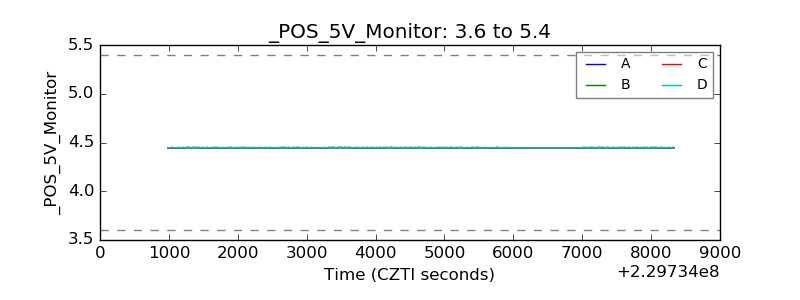 |
| _ROLL_ROT | 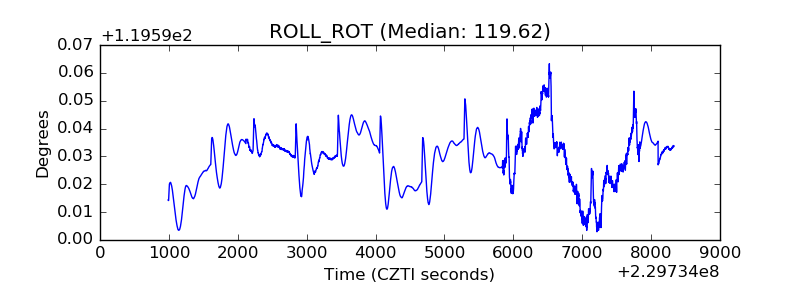 |
| _Roll_DEC | 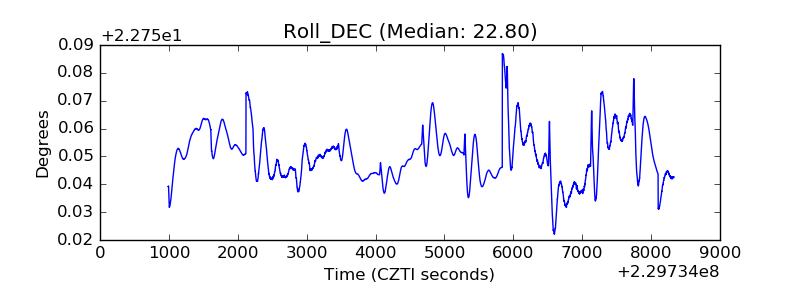 |
| _Roll_RA | 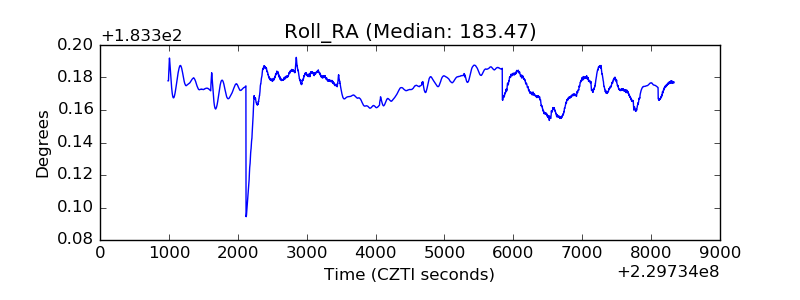 |
| Veto Counter | 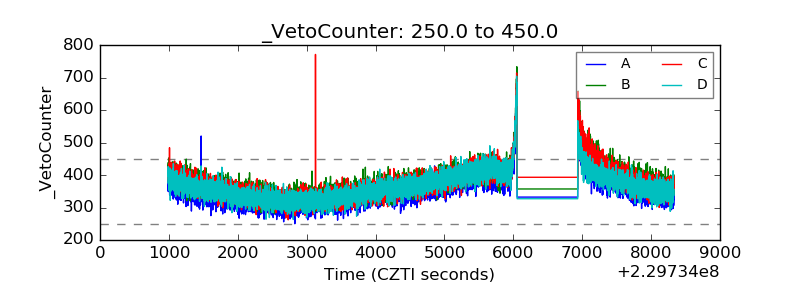 |