| Param | Original file | Final file |
|---|---|---|
| Filename | modeM0/AS1G07_029T01_9000001158_08332cztM0_level2.evt | modeM0/AS1G07_029T01_9000001158_08332cztM0_level2_quad_clean.evt |
| Size (bytes) | 428,601,600 | 82,920,960 |
| Size | 408.7 MB | 79.1 MB |
| Events in quadrant A | 2,975,272 | 519,336 |
| Events in quadrant B | 3,060,056 | 526,099 |
| Events in quadrant C | 3,235,684 | 515,141 |
| Events in quadrant D | 3,269,423 | 499,414 |
| Mode SS | |||
|---|---|---|---|
| Quadrant | BADHDUFLAG | Total packets | Discarded packets |
| A | 0 | 132 | 0 |
| B | 0 | 132 | 0 |
| C | 0 | 132 | 0 |
| D | 0 | 132 | 0 |
| Mode M0 | |||
|---|---|---|---|
| Quadrant | BADHDUFLAG | Total packets | Discarded packets |
| A | 0 | 13166 | 3 |
| B | 0 | 13315 | 2 |
| C | 0 | 14053 | 2 |
| D | 0 | 14369 | 2 |
| Mode M9 | |||
|---|---|---|---|
| Quadrant | BADHDUFLAG | Total packets | Discarded packets |
| A | 0 | 14 | 0 |
| B | 0 | 14 | 0 |
| C | 0 | 14 | 0 |
| D | 0 | 15 | 0 |
| Quadrant | Total seconds | Saturated seconds | Saturation percentage |
|---|---|---|---|
| A | 6463 | 28 | 0.433235% |
| B | 6463 | 37 | 0.572490% |
| C | 6463 | 98 | 1.516324% |
| D | 6463 | 12 | 0.185672% |
Noise dominated data is calculated using 1-second bins in cleaned event files. If a bin has >2000 counts, and if more than 50% of those come from <1% of pixels, then it is considered to be noise-dominated and hence unusable.
| Quadrant | # 1 sec bins | Bins with >0 counts | Bins with >2000 counts | High rate bins dominated by noise | Noise dominated (total time) | Noise dominated (detector-on time) | Marked lightcurve |
|---|---|---|---|---|---|---|---|
| A | 7503 | 6464 | 0 | 0 | 0.00% | 0.00% | 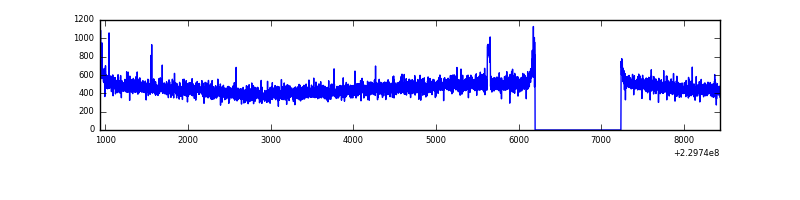 |
| B | 7503 | 6464 | 2 | 2 | 0.03% | 0.03% | 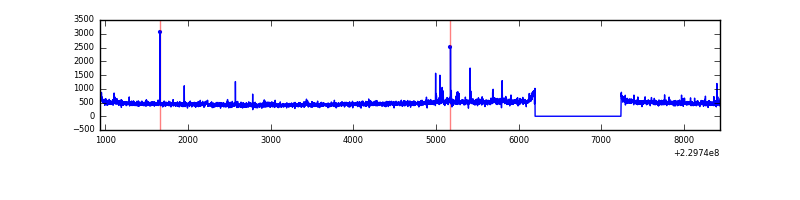 |
| C | 7503 | 6464 | 62 | 62 | 0.83% | 0.96% | 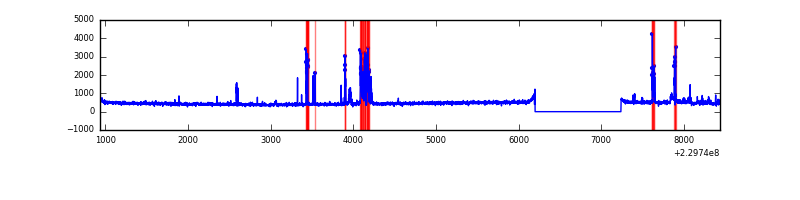 |
| D | 7503 | 6464 | 1 | 1 | 0.01% | 0.02% | 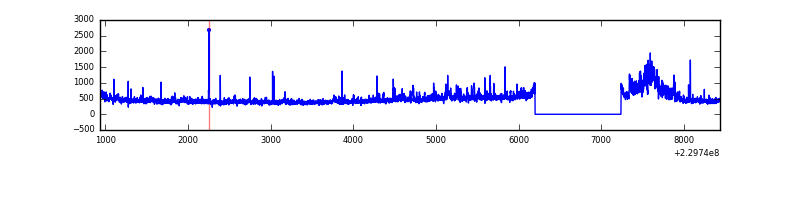 |
Top three noisy pixels from each quadrant. If the there are fewer than three noisy pixels in the level2.evt file, extra rows are filled as -1
| Pixel properties | Quadrant properties | ||||||
|---|---|---|---|---|---|---|---|
| Quadrant | DetID | PixID | Counts | Sigma | Mean | Median | Sigma |
| A | 15 | 234 | 39054 | 244.63 | 757 | 738 | 156.6 |
| A | 14 | 111 | 23985 | 148.42 | 757 | 738 | 156.6 |
| A | 0 | 226 | 7300 | 41.89 | 757 | 738 | 156.6 |
| B | 0 | 214 | 45548 | 305.96 | 761 | 743 | 146.4 |
| B | 0 | 219 | 31656 | 211.1 | 761 | 743 | 146.4 |
| B | 12 | 111 | 16478 | 107.45 | 761 | 743 | 146.4 |
| C | 9 | 54 | 378692 | 2216.2 | 732 | 737 | 170.5 |
| C | 13 | 61 | 5446 | 27.61 | 732 | 737 | 170.5 |
| C | 3 | 202 | 1800 | 6.23 | 732 | 737 | 170.5 |
| D | 12 | 221 | 383455 | 2169.78 | 728 | 709 | 176.4 |
| D | 2 | 152 | 54445 | 304.63 | 728 | 709 | 176.4 |
| D | 1 | 52 | 27492 | 151.83 | 728 | 709 | 176.4 |
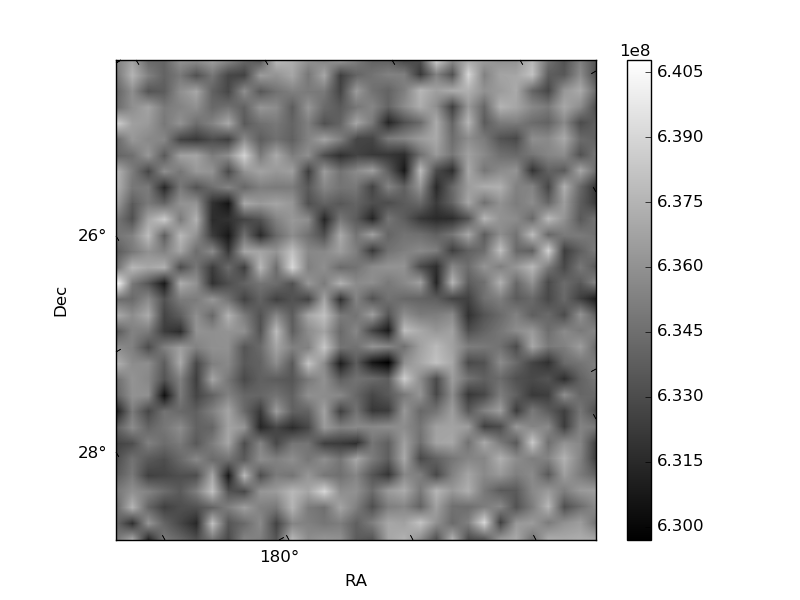
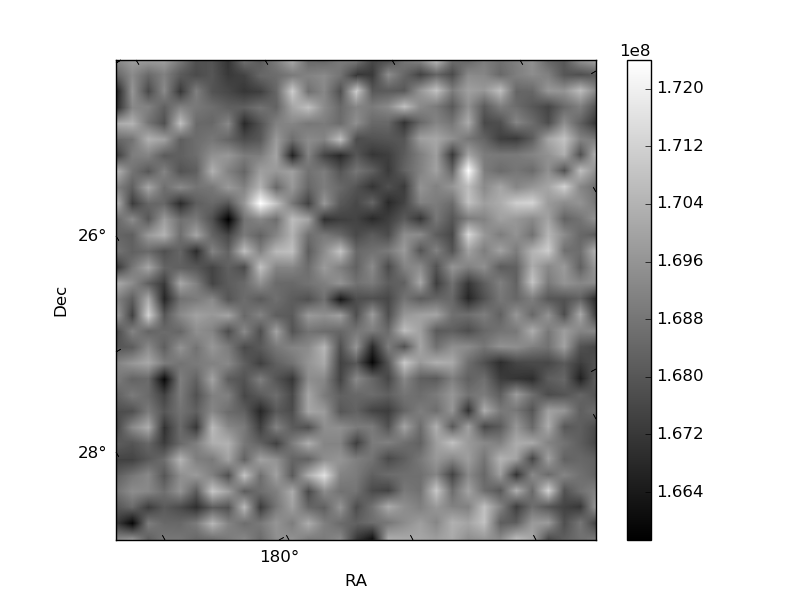
Histogram calculated using DETX and DETY for each event in the final _common_clean file
| Quadrant A | 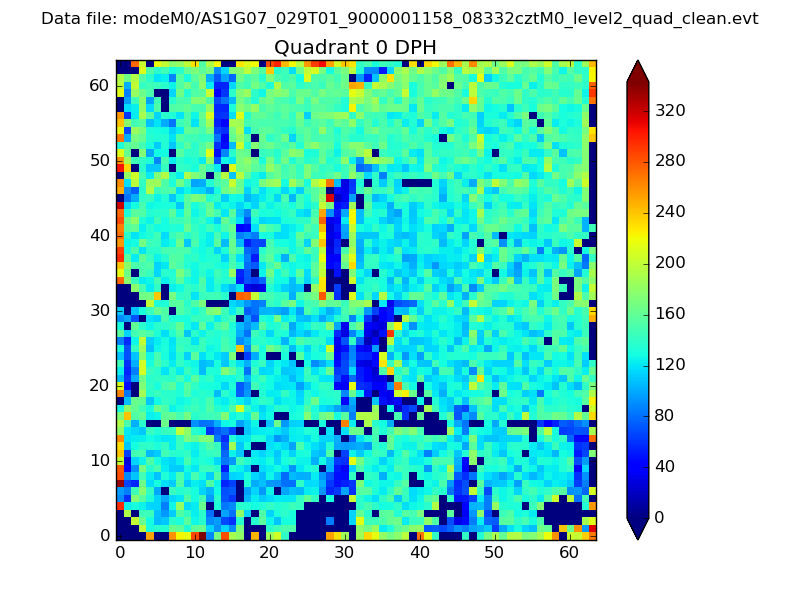 |
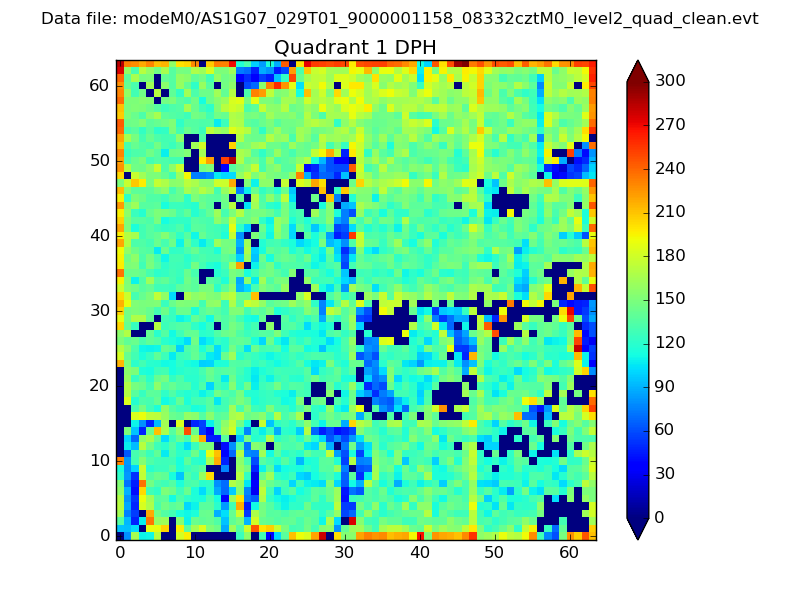 |
Quadrant B |
|---|---|---|---|
| Quadrant D | 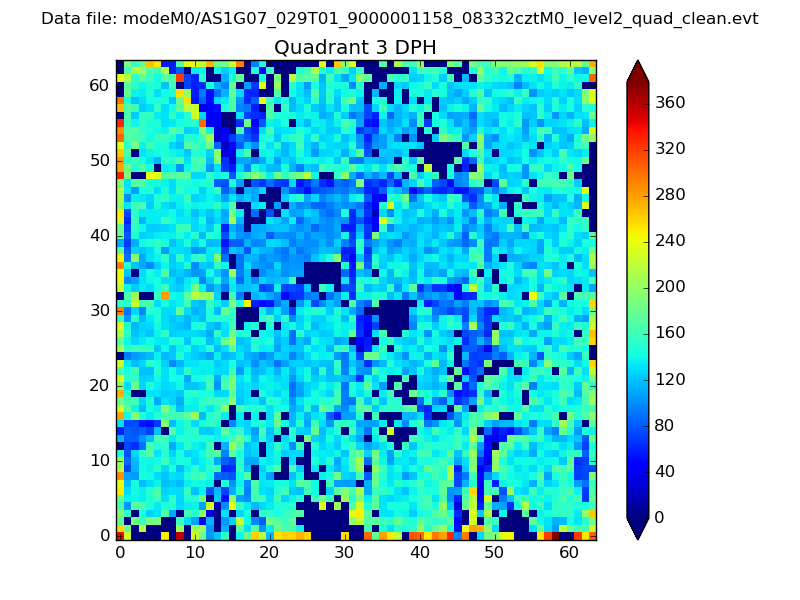 |
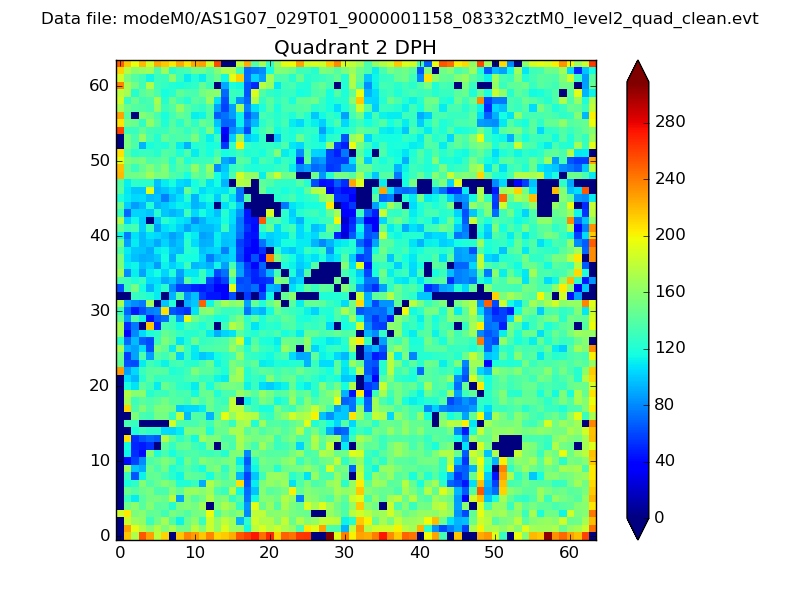 |
Quadrant C |
| Plot type | Count rate plots | Images |
|---|---|---|
| Comparison with Poisson distribution Blue bars denote a histogram of data divided into 1 sec bins. Red curve is a Poisson curve with rate = median count rate of data. |
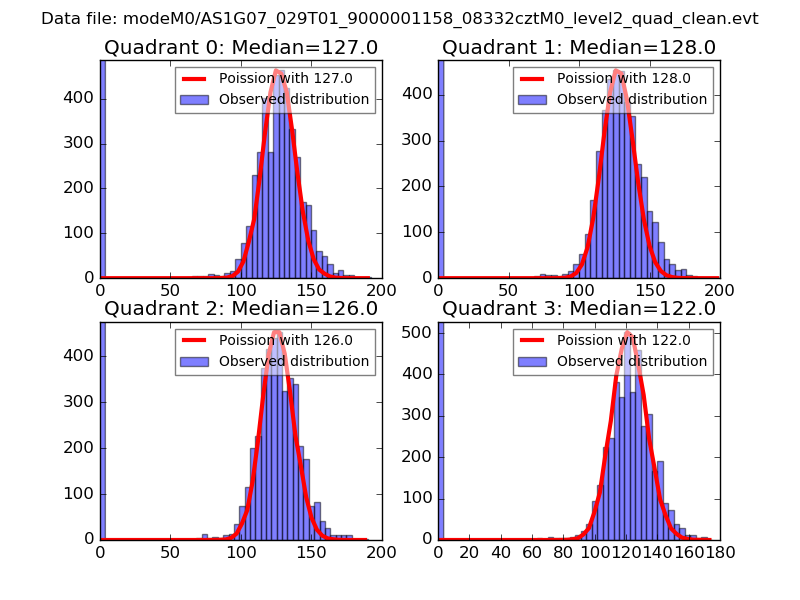 |
 |
| Quadrant-wise count rates Data is divided into 100 sec bins |
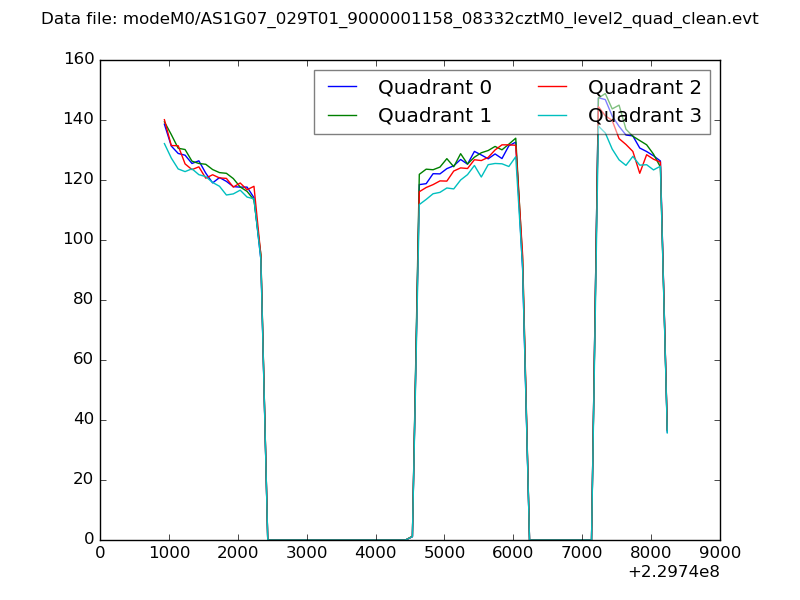 |
|
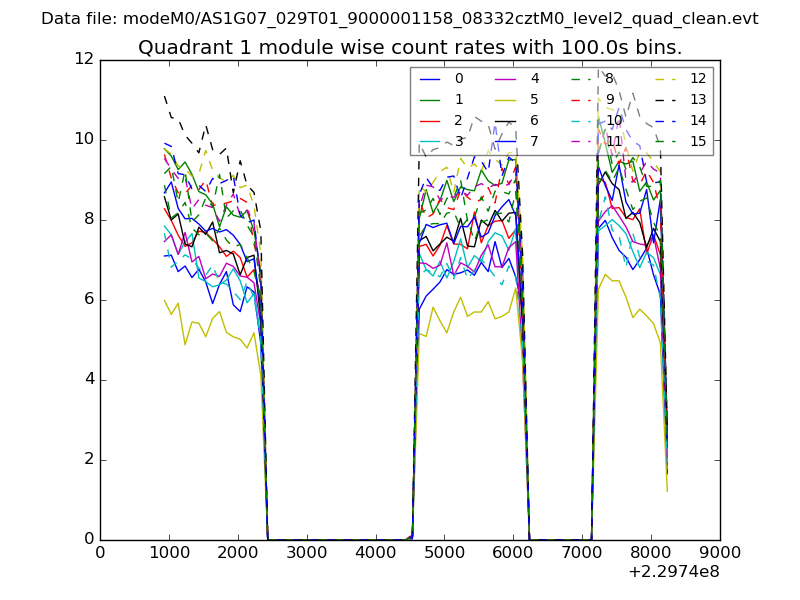
| Module-wise count rates for Quadrant A Data is divided into 100 sec bins |
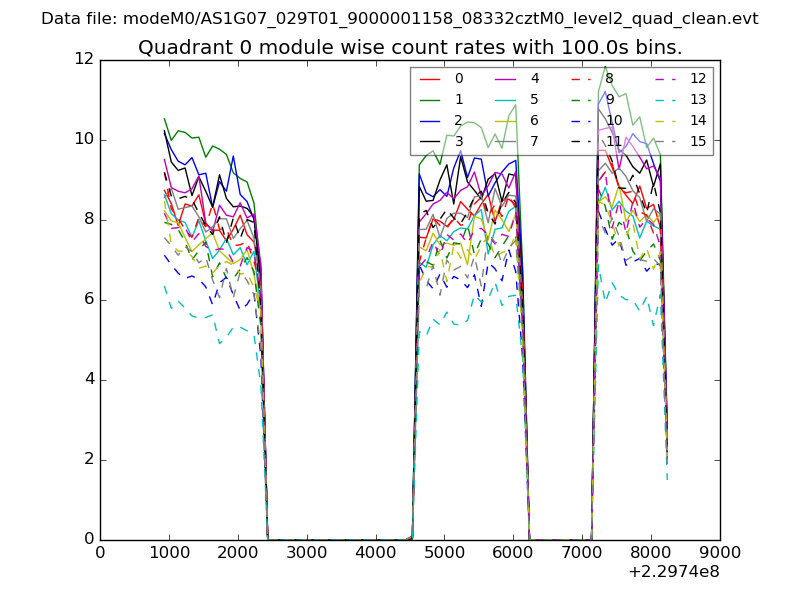 |
 |
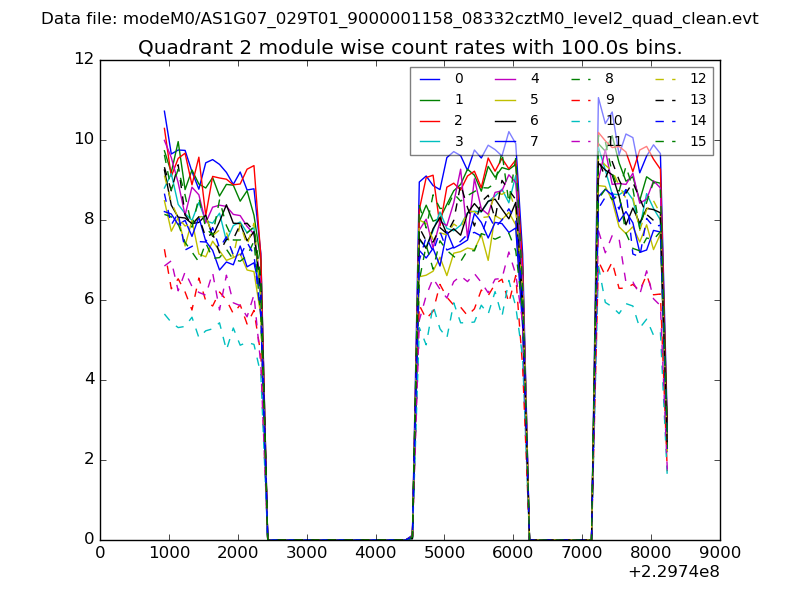
| Module-wise count rates for Quadrant B Data is divided into 100 sec bins |
 |
 |
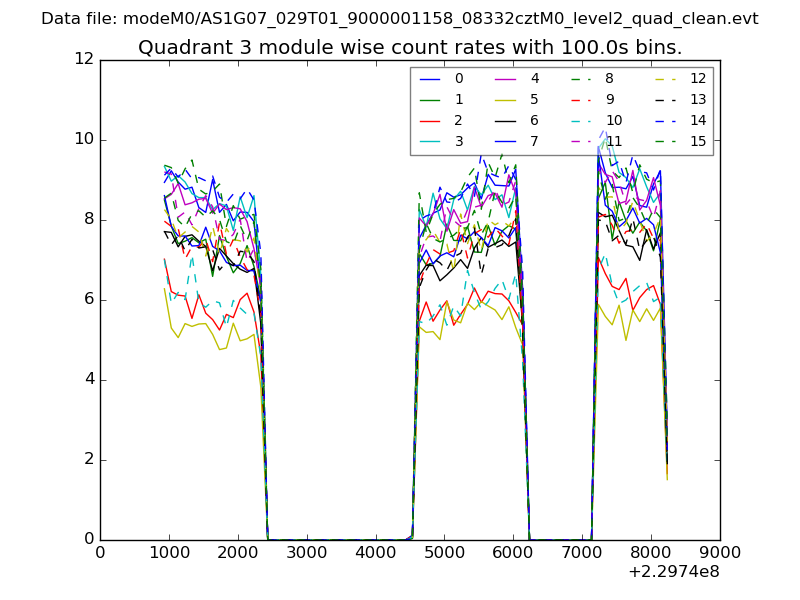
| Module-wise count rates for Quadrant C Data is divided into 100 sec bins |
 |
 |
| Module-wise count rates for Quadrant D Data is divided into 100 sec bins |
 |
 |
| Parameter | Plot |
|---|---|
| CZT HV Monitor | 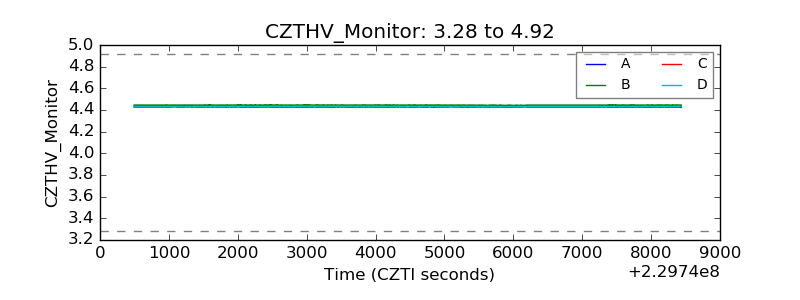 |
| D_VDD |  |
| Temperature 1 |  |
| Veto HV Monitor | 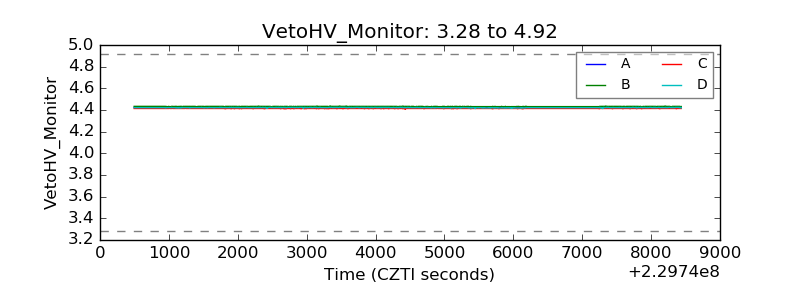 |
| Veto LLD | 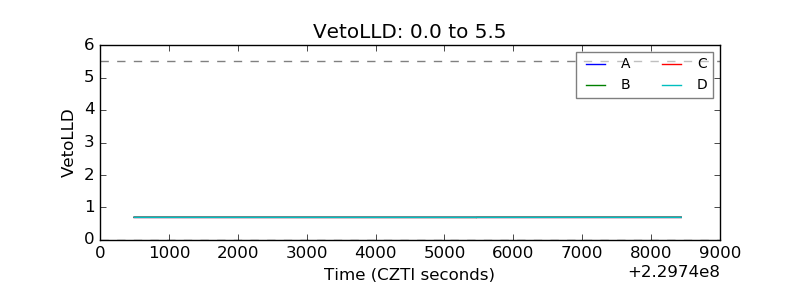 |
| Alpha Counter | 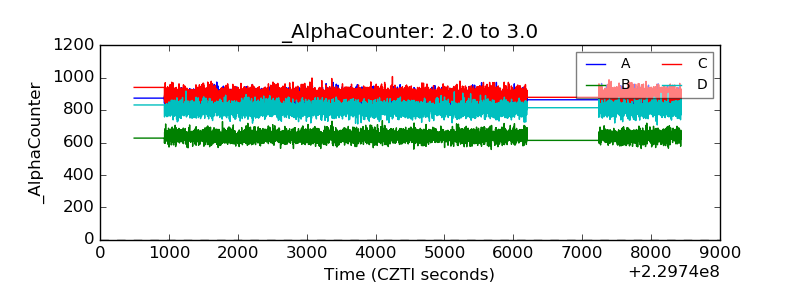 |
| _CPM_Rate | 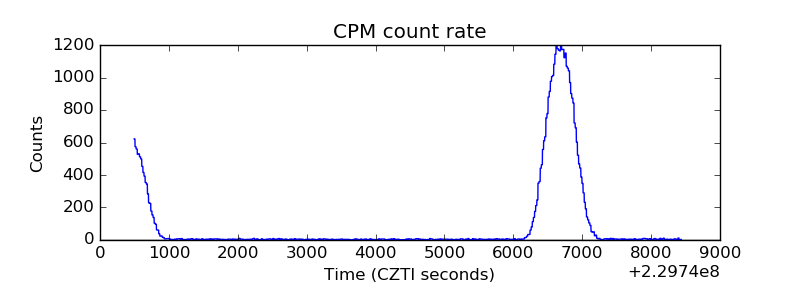 |
| CZT Counter | 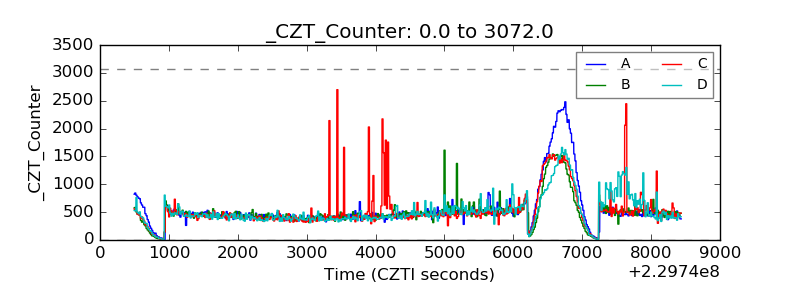 |
| +2.5 Volts monitor |  |
| +5 Volts monitor |  |
| _ROLL_ROT | 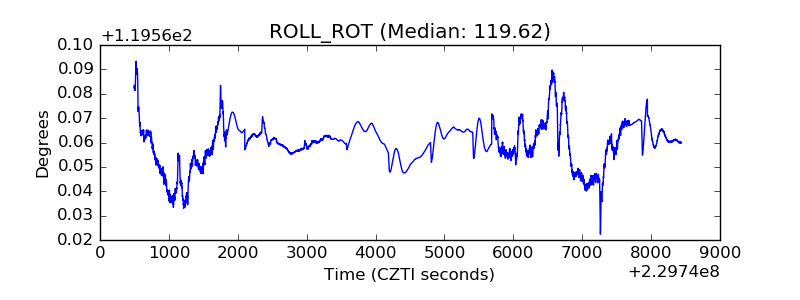 |
| _Roll_DEC | 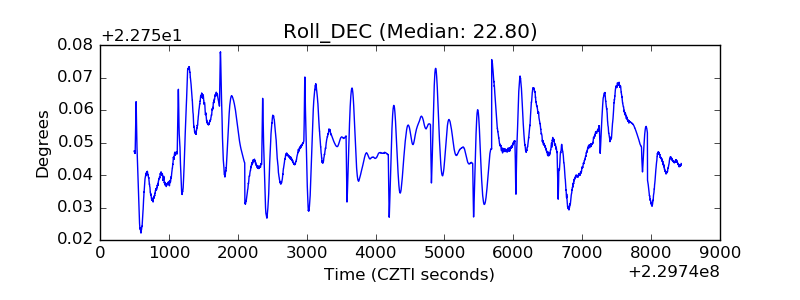 |
| _Roll_RA | 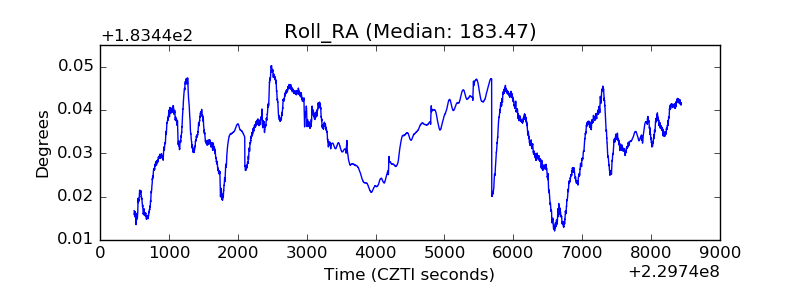 |
| Veto Counter | 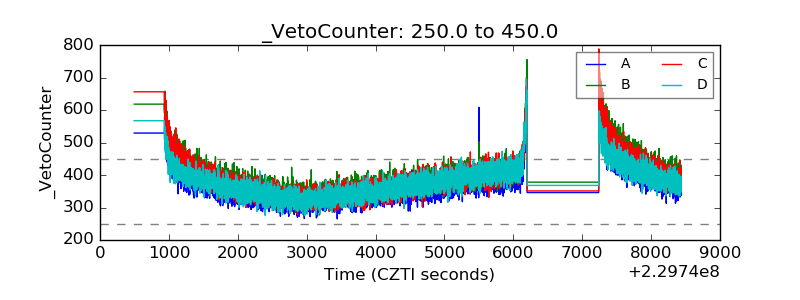 |