| Param | Original file | Final file |
|---|---|---|
| Filename | modeM0/AS1G07_029T01_9000001158_08334cztM0_level2.evt | modeM0/AS1G07_029T01_9000001158_08334cztM0_level2_quad_clean.evt |
| Size (bytes) | 426,602,880 | 76,026,240 |
| Size | 406.8 MB | 72.5 MB |
| Events in quadrant A | 2,996,943 | 471,238 |
| Events in quadrant B | 3,137,911 | 478,276 |
| Events in quadrant C | 3,192,024 | 463,013 |
| Events in quadrant D | 3,161,938 | 447,316 |
| Mode SS | |||
|---|---|---|---|
| Quadrant | BADHDUFLAG | Total packets | Discarded packets |
| A | 0 | 128 | 0 |
| B | 0 | 128 | 0 |
| C | 0 | 128 | 0 |
| D | 0 | 128 | 0 |
| Mode M0 | |||
|---|---|---|---|
| Quadrant | BADHDUFLAG | Total packets | Discarded packets |
| A | 0 | 13010 | 12 |
| B | 0 | 13207 | 12 |
| C | 0 | 13672 | 14 |
| D | 0 | 13887 | 10 |
| Mode M9 | |||
|---|---|---|---|
| Quadrant | BADHDUFLAG | Total packets | Discarded packets |
| A | 0 | 17 | 0 |
| B | 0 | 17 | 0 |
| C | 0 | 17 | 0 |
| D | 0 | 18 | 0 |
| Quadrant | Total seconds | Saturated seconds | Saturation percentage |
|---|---|---|---|
| A | 6338 | 30 | 0.473335% |
| B | 6338 | 23 | 0.362891% |
| C | 6340 | 49 | 0.772871% |
| D | 6339 | 6 | 0.094652% |
Noise dominated data is calculated using 1-second bins in cleaned event files. If a bin has >2000 counts, and if more than 50% of those come from <1% of pixels, then it is considered to be noise-dominated and hence unusable.
| Quadrant | # 1 sec bins | Bins with >0 counts | Bins with >2000 counts | High rate bins dominated by noise | Noise dominated (total time) | Noise dominated (detector-on time) | Marked lightcurve |
|---|---|---|---|---|---|---|---|
| A | 7518 | 6343 | 8 | 8 | 0.11% | 0.13% | 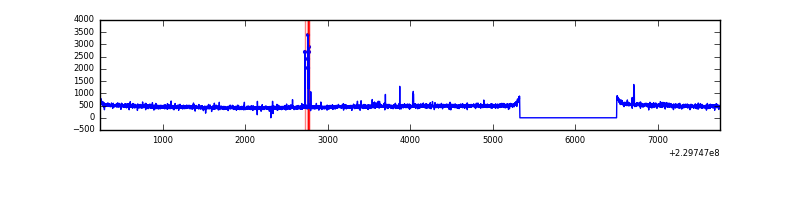 |
| B | 7518 | 6344 | 1 | 1 | 0.01% | 0.02% | 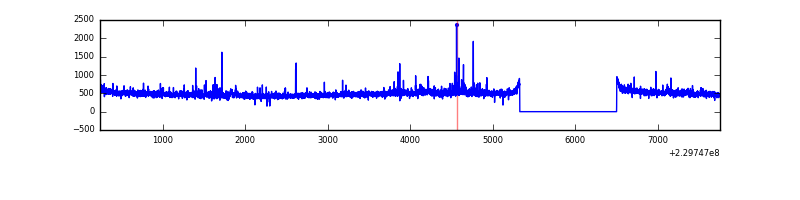 |
| C | 7518 | 6344 | 40 | 40 | 0.53% | 0.63% | 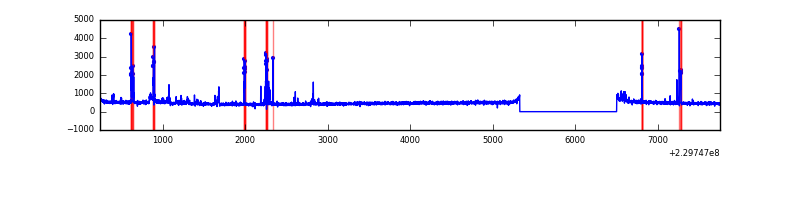 |
| D | 7518 | 6344 | 0 | 0 | 0.00% | 0.00% | 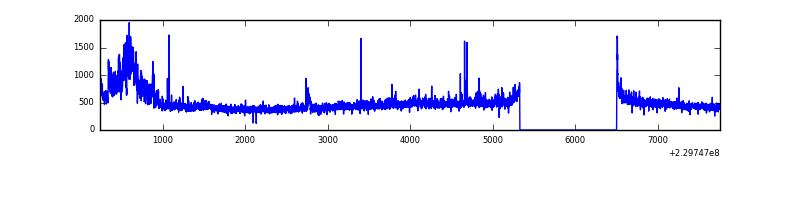 |
Top three noisy pixels from each quadrant. If the there are fewer than three noisy pixels in the level2.evt file, extra rows are filled as -1
| Pixel properties | Quadrant properties | ||||||
|---|---|---|---|---|---|---|---|
| Quadrant | DetID | PixID | Counts | Sigma | Mean | Median | Sigma |
| A | 14 | 111 | 35716 | 224.64 | 768 | 751 | 155.7 |
| A | 0 | 226 | 7617 | 44.11 | 768 | 751 | 155.7 |
| A | 12 | 194 | 6916 | 39.61 | 768 | 751 | 155.7 |
| B | 0 | 214 | 55762 | 370.78 | 774 | 755 | 148.4 |
| B | 0 | 219 | 19993 | 129.68 | 774 | 755 | 148.4 |
| B | 0 | 198 | 18814 | 121.73 | 774 | 755 | 148.4 |
| C | 9 | 54 | 303949 | 1758.01 | 741 | 746 | 172.5 |
| C | 13 | 61 | 5493 | 27.52 | 741 | 746 | 172.5 |
| C | 3 | 202 | 1854 | 6.42 | 741 | 746 | 172.5 |
| D | 12 | 221 | 301400 | 1690.06 | 734 | 716 | 177.9 |
| D | 2 | 152 | 54236 | 300.82 | 734 | 716 | 177.9 |
| D | 2 | 234 | 19535 | 105.78 | 734 | 716 | 177.9 |
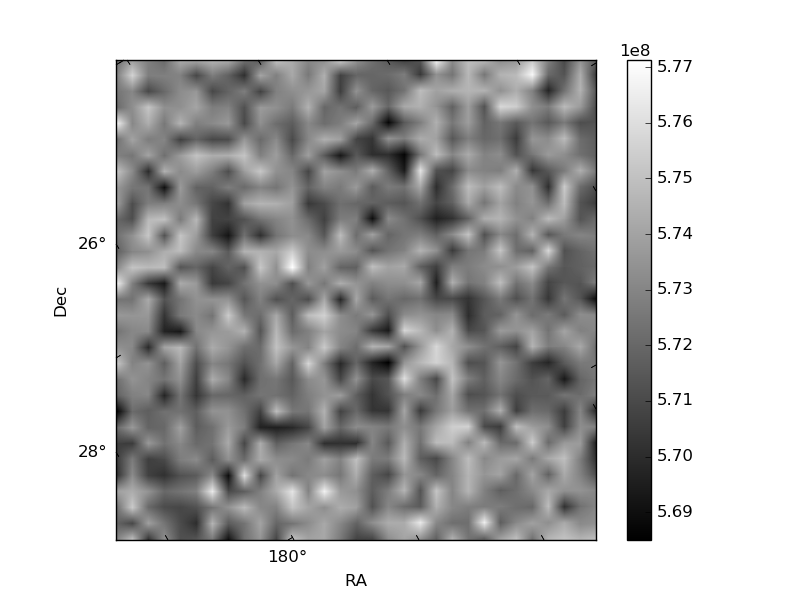
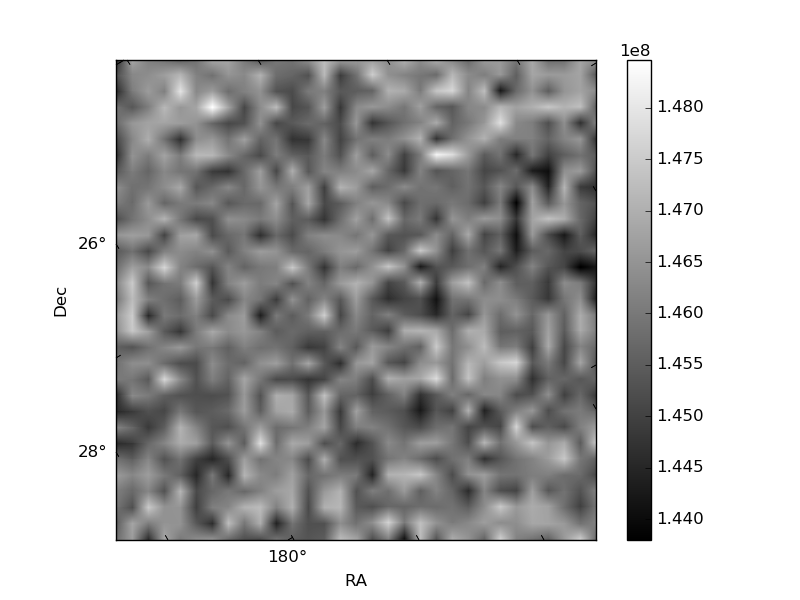
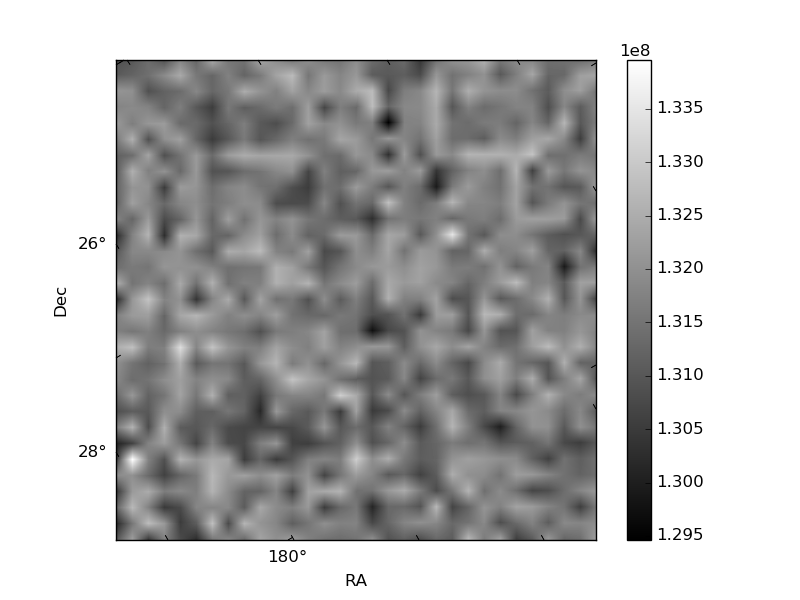
Histogram calculated using DETX and DETY for each event in the final _common_clean file
| Quadrant A | 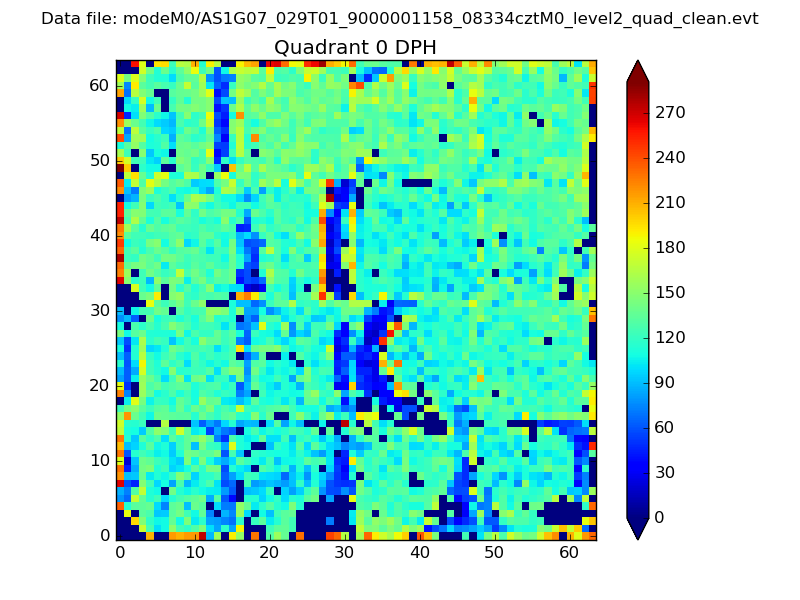 |
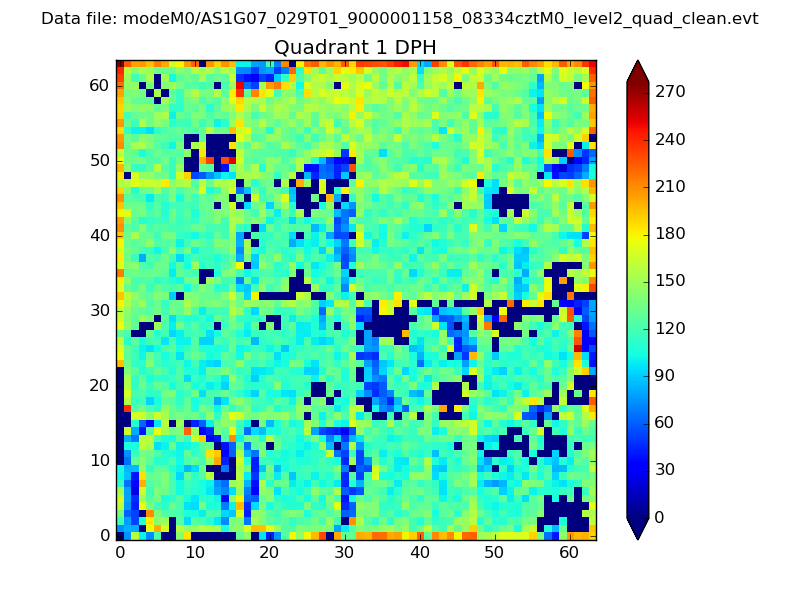 |
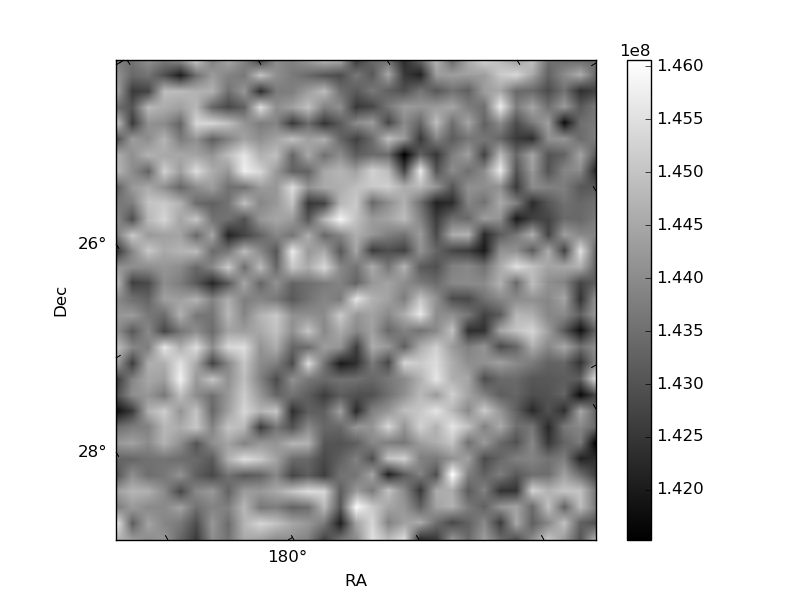
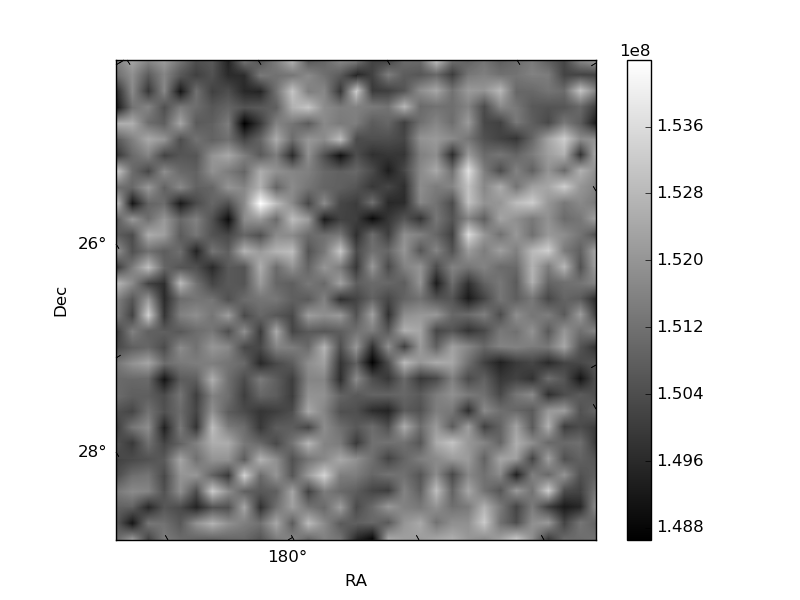
Quadrant B |
|---|---|---|---|
| Quadrant D | 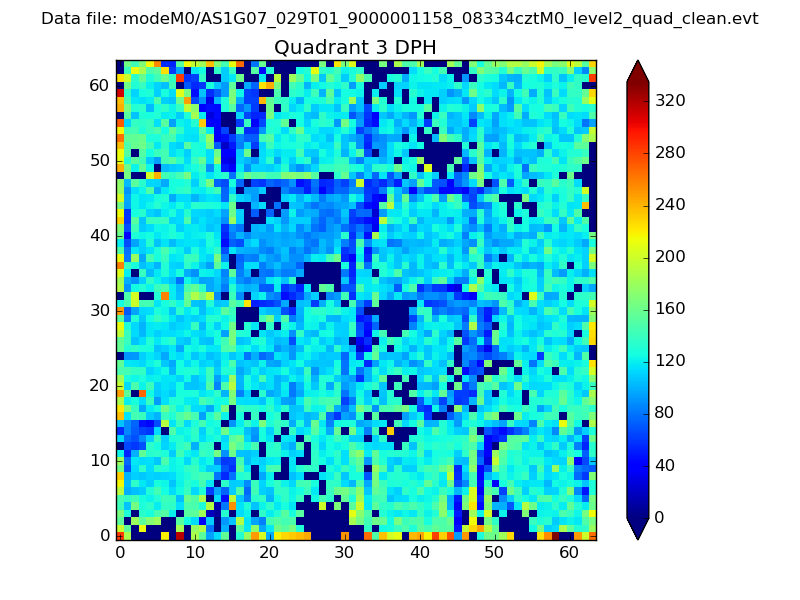 |
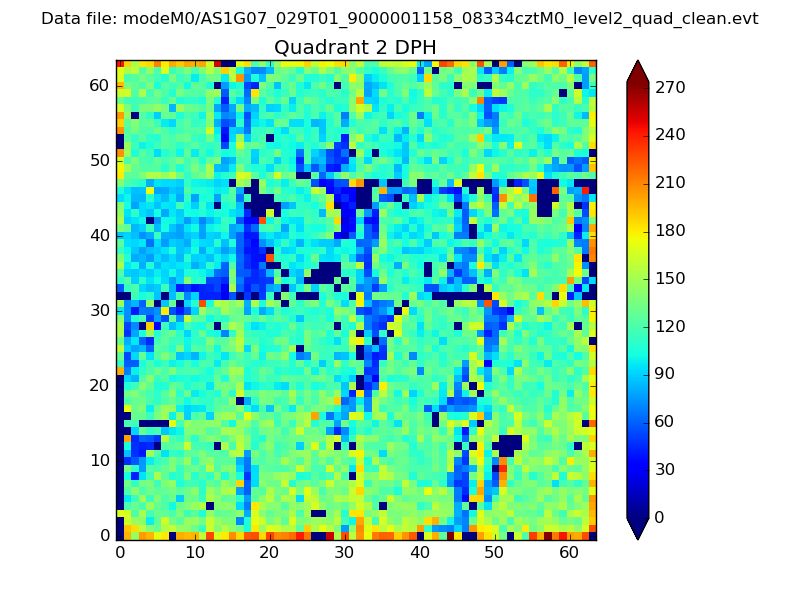 |
Quadrant C |
| Plot type | Count rate plots | Images |
|---|---|---|
| Comparison with Poisson distribution Blue bars denote a histogram of data divided into 1 sec bins. Red curve is a Poisson curve with rate = median count rate of data. |
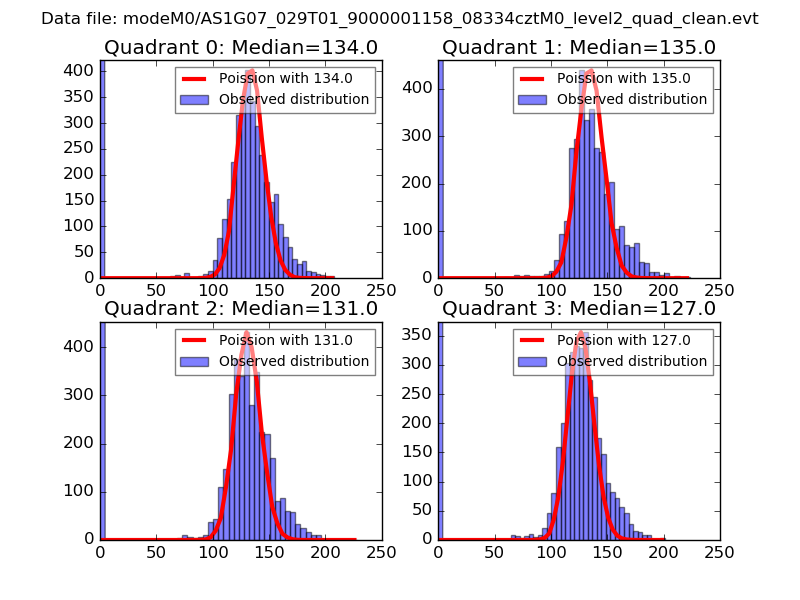 |
 |
| Quadrant-wise count rates Data is divided into 100 sec bins |
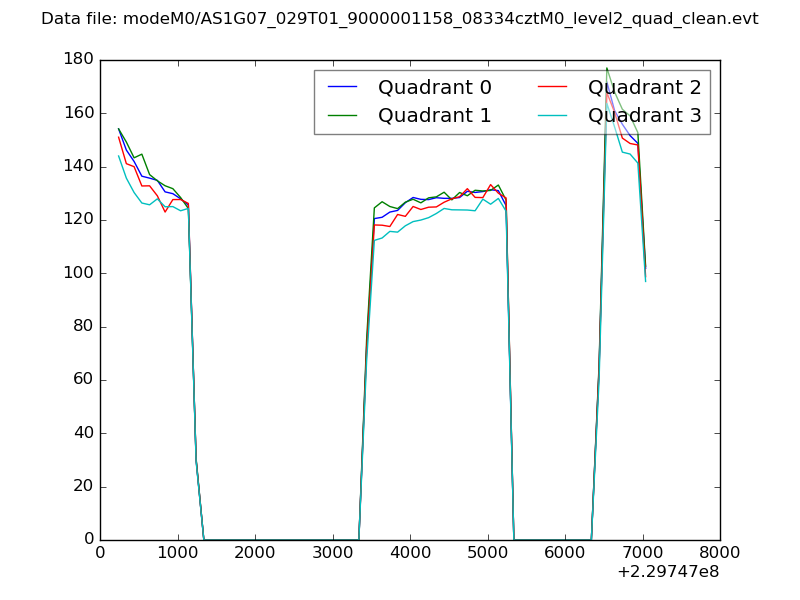 |
|
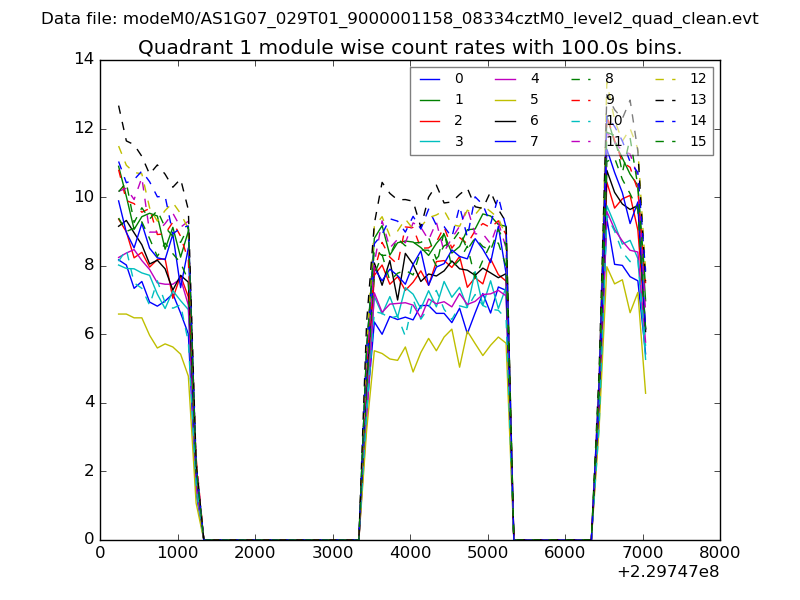
| Module-wise count rates for Quadrant A Data is divided into 100 sec bins |
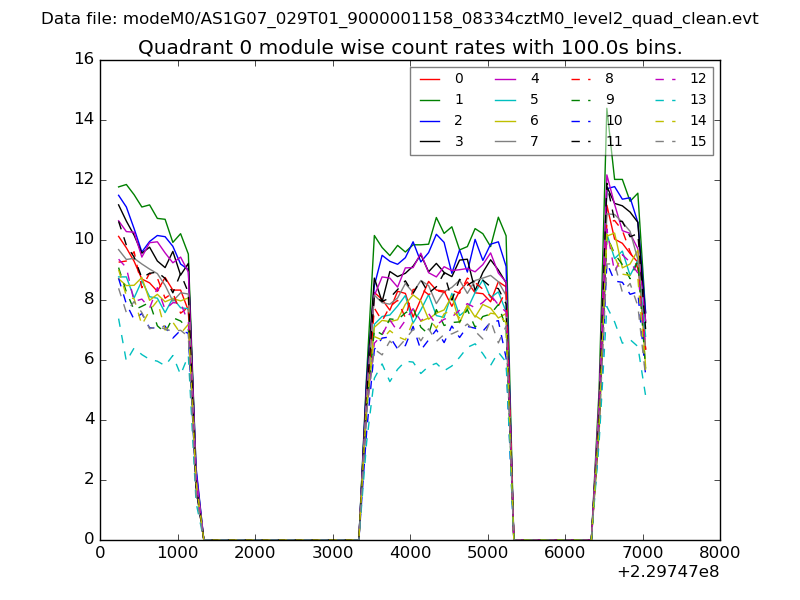 |
 |
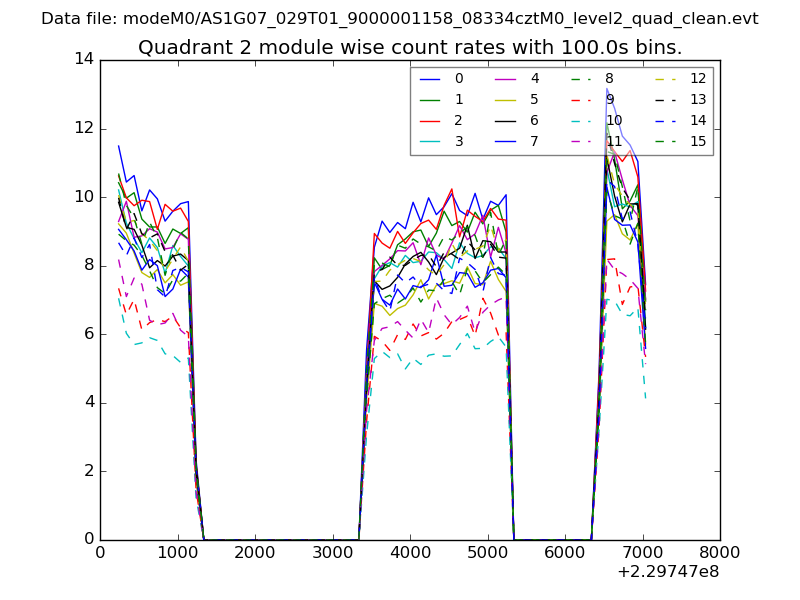
| Module-wise count rates for Quadrant B Data is divided into 100 sec bins |
 |
 |
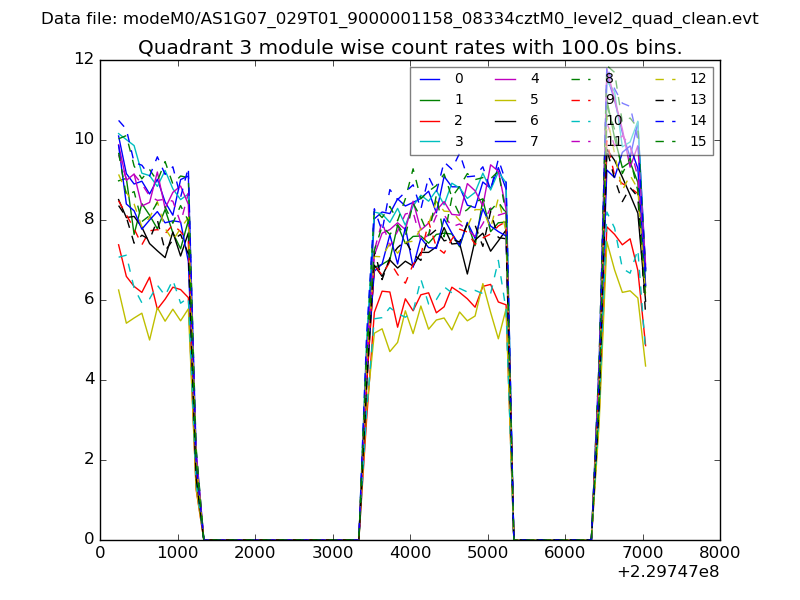
| Module-wise count rates for Quadrant C Data is divided into 100 sec bins |
 |
 |
| Module-wise count rates for Quadrant D Data is divided into 100 sec bins |
 |
 |
| Parameter | Plot |
|---|---|
| CZT HV Monitor | 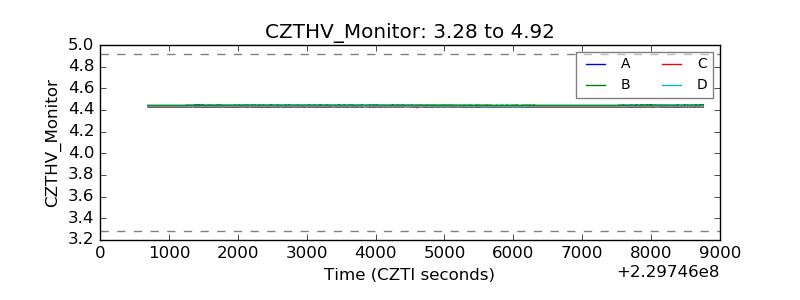 |
| D_VDD | 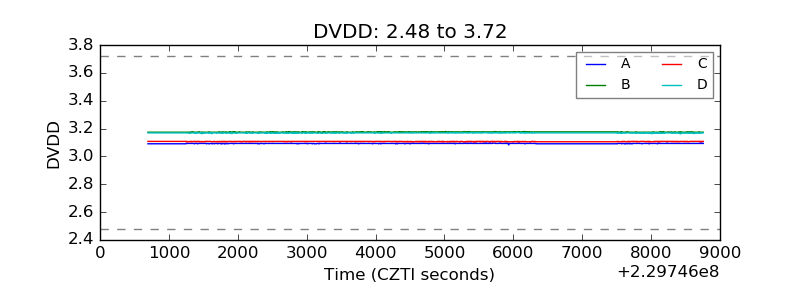 |
| Temperature 1 | 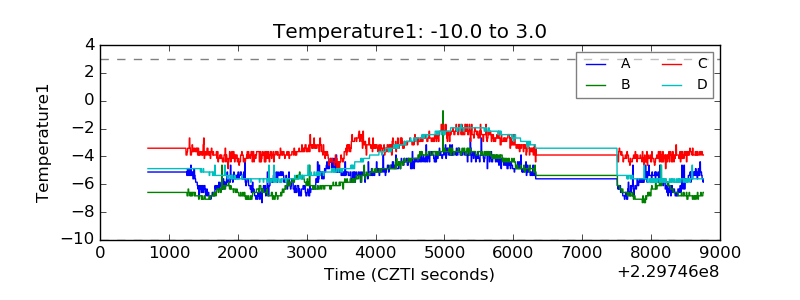 |
| Veto HV Monitor | 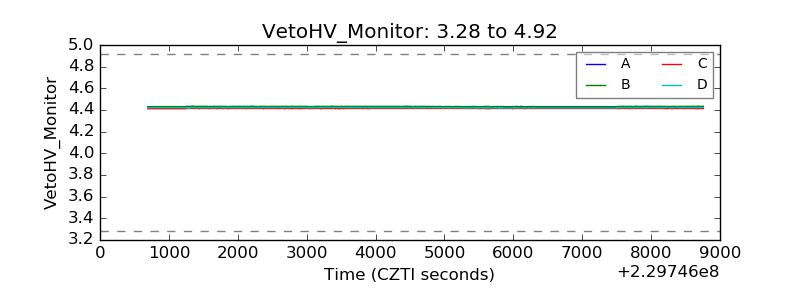 |
| Veto LLD | 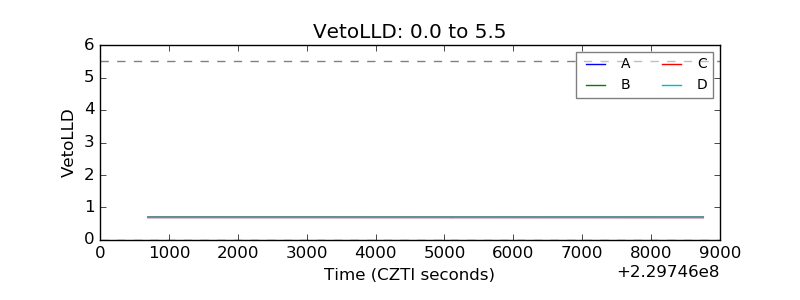 |
| Alpha Counter | 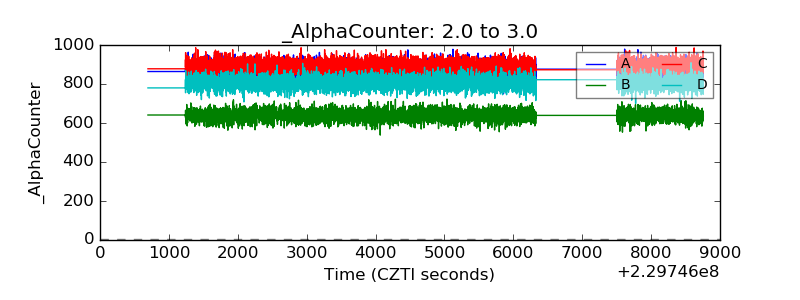 |
| _CPM_Rate |  |
| CZT Counter | 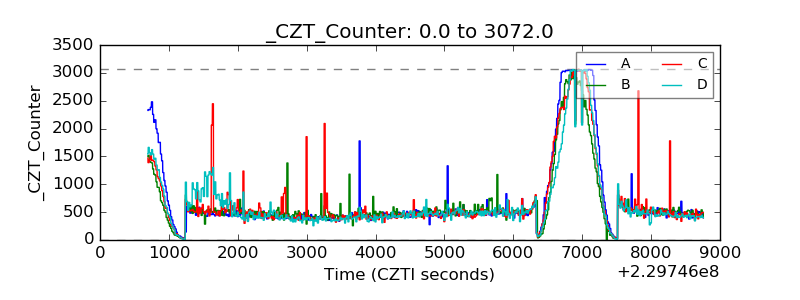 |
| +2.5 Volts monitor |  |
| +5 Volts monitor |  |
| _ROLL_ROT | 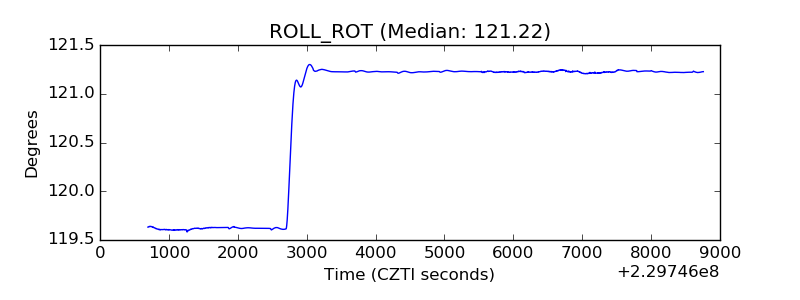 |
| _Roll_DEC | 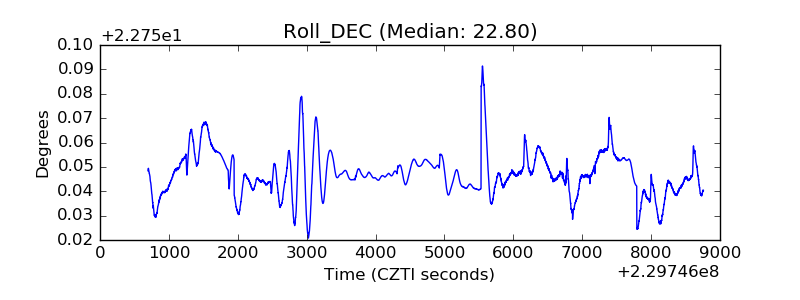 |
| _Roll_RA | 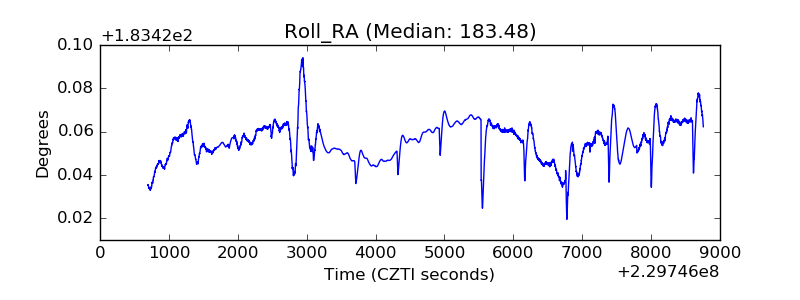 |
| Veto Counter | 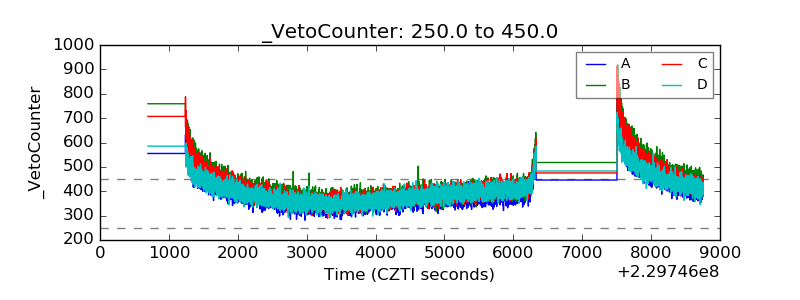 |