| Param | Original file | Final file |
|---|---|---|
| Filename | modeM0/AS1G07_029T01_9000001158_08335cztM0_level2.evt | modeM0/AS1G07_029T01_9000001158_08335cztM0_level2_quad_clean.evt |
| Size (bytes) | 438,517,440 | 73,031,040 |
| Size | 418.2 MB | 69.6 MB |
| Events in quadrant A | 3,158,524 | 446,927 |
| Events in quadrant B | 3,253,342 | 455,957 |
| Events in quadrant C | 3,213,771 | 439,669 |
| Events in quadrant D | 3,223,437 | 425,756 |
| Mode SS | |||
|---|---|---|---|
| Quadrant | BADHDUFLAG | Total packets | Discarded packets |
| A | 0 | 130 | 0 |
| B | 0 | 130 | 0 |
| C | 0 | 130 | 0 |
| D | 0 | 130 | 2 |
| Mode M0 | |||
|---|---|---|---|
| Quadrant | BADHDUFLAG | Total packets | Discarded packets |
| A | 0 | 13237 | 5 |
| B | 0 | 13480 | 2 |
| C | 0 | 13582 | 2 |
| D | 0 | 13805 | 2 |
| Mode M9 | |||
|---|---|---|---|
| Quadrant | BADHDUFLAG | Total packets | Discarded packets |
| A | 0 | 24 | 0 |
| B | 0 | 24 | 0 |
| C | 0 | 24 | 0 |
| D | 0 | 24 | 0 |
| Quadrant | Total seconds | Saturated seconds | Saturation percentage |
|---|---|---|---|
| A | 6354 | 43 | 0.676739% |
| B | 6355 | 48 | 0.755311% |
| C | 6355 | 50 | 0.786782% |
| D | 6355 | 33 | 0.519276% |
Noise dominated data is calculated using 1-second bins in cleaned event files. If a bin has >2000 counts, and if more than 50% of those come from <1% of pixels, then it is considered to be noise-dominated and hence unusable.
| Quadrant | # 1 sec bins | Bins with >0 counts | Bins with >2000 counts | High rate bins dominated by noise | Noise dominated (total time) | Noise dominated (detector-on time) | Marked lightcurve |
|---|---|---|---|---|---|---|---|
| A | 8780 | 6357 | 0 | 0 | 0.00% | 0.00% | 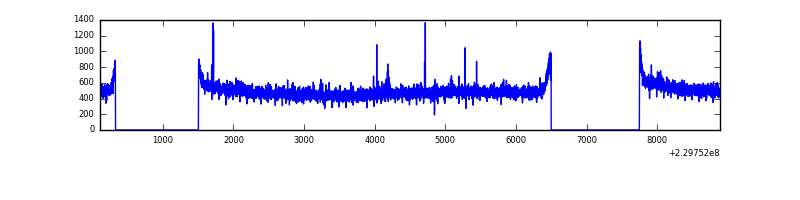 |
| B | 8780 | 6357 | 1 | 1 | 0.01% | 0.02% | 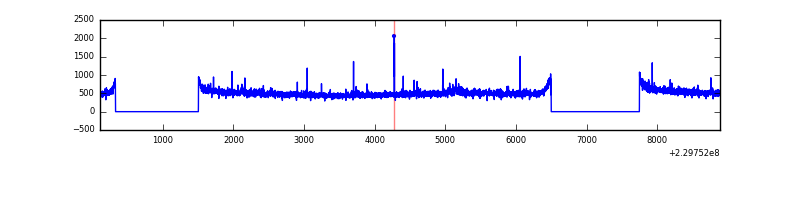 |
| C | 8780 | 6357 | 23 | 23 | 0.26% | 0.36% | 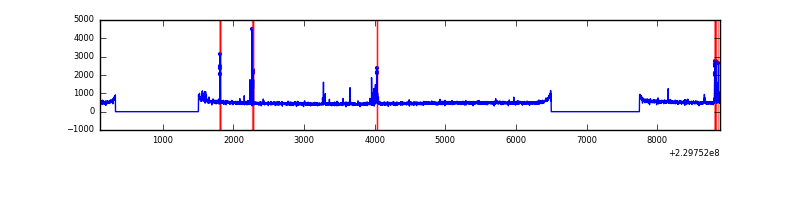 |
| D | 8780 | 6357 | 13 | 13 | 0.15% | 0.20% | 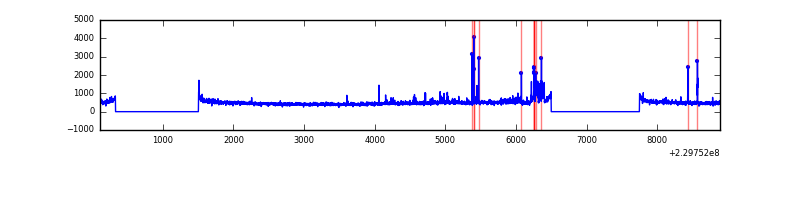 |
Top three noisy pixels from each quadrant. If the there are fewer than three noisy pixels in the level2.evt file, extra rows are filled as -1
| Pixel properties | Quadrant properties | ||||||
|---|---|---|---|---|---|---|---|
| Quadrant | DetID | PixID | Counts | Sigma | Mean | Median | Sigma |
| A | 15 | 239 | 19607 | 113.86 | 813 | 796 | 165.2 |
| A | 0 | 226 | 8046 | 43.88 | 813 | 796 | 165.2 |
| A | 12 | 194 | 7256 | 39.1 | 813 | 796 | 165.2 |
| B | 0 | 219 | 45325 | 290.95 | 815 | 798 | 153.0 |
| B | 12 | 111 | 17018 | 105.99 | 815 | 798 | 153.0 |
| B | 11 | 111 | 13663 | 84.06 | 815 | 798 | 153.0 |
| C | 9 | 54 | 170000 | 939.56 | 780 | 785 | 180.1 |
| C | 13 | 61 | 5940 | 28.62 | 780 | 785 | 180.1 |
| C | 3 | 202 | 1935 | 6.39 | 780 | 785 | 180.1 |
| D | 1 | 7 | 119002 | 635.29 | 774 | 756 | 186.1 |
| D | 2 | 152 | 61999 | 329.03 | 774 | 756 | 186.1 |
| D | 12 | 221 | 52409 | 277.51 | 774 | 756 | 186.1 |
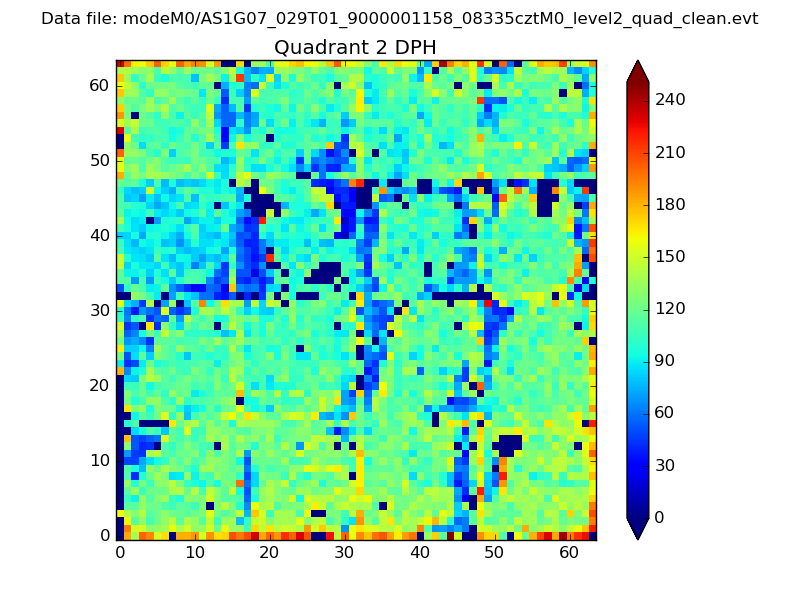
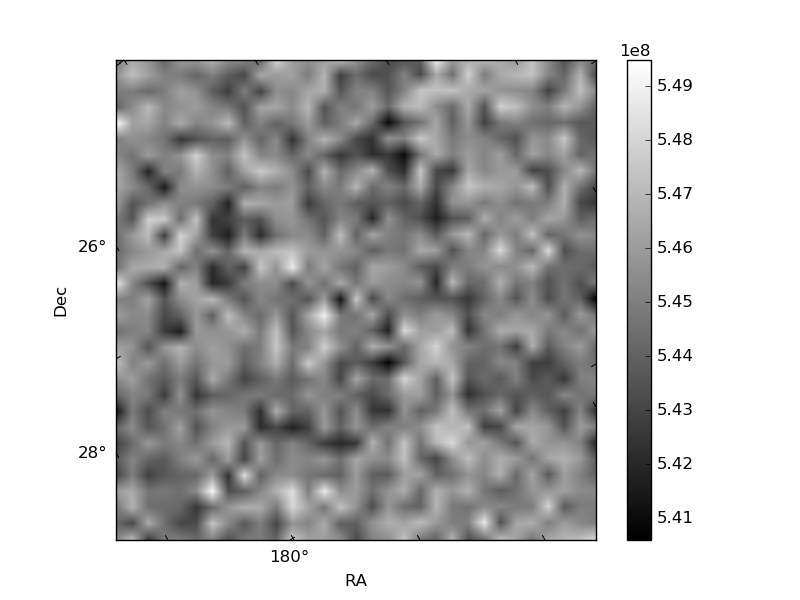
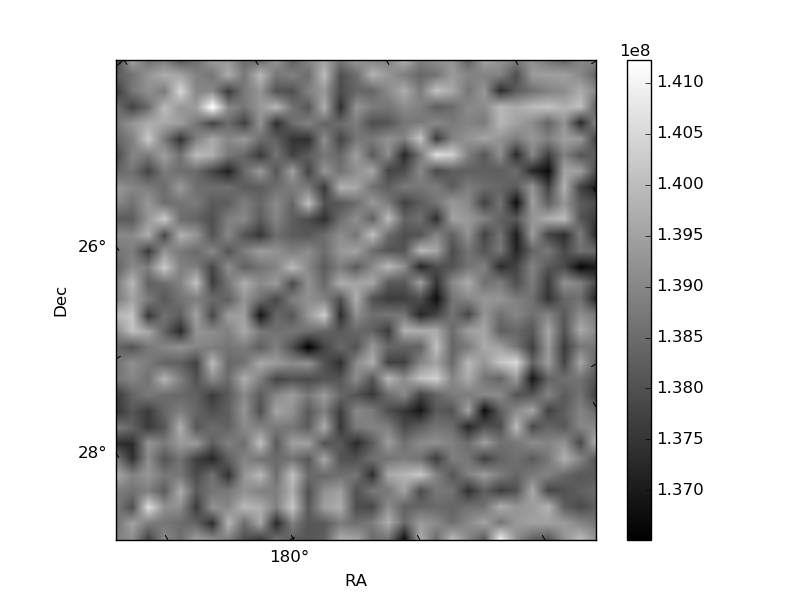
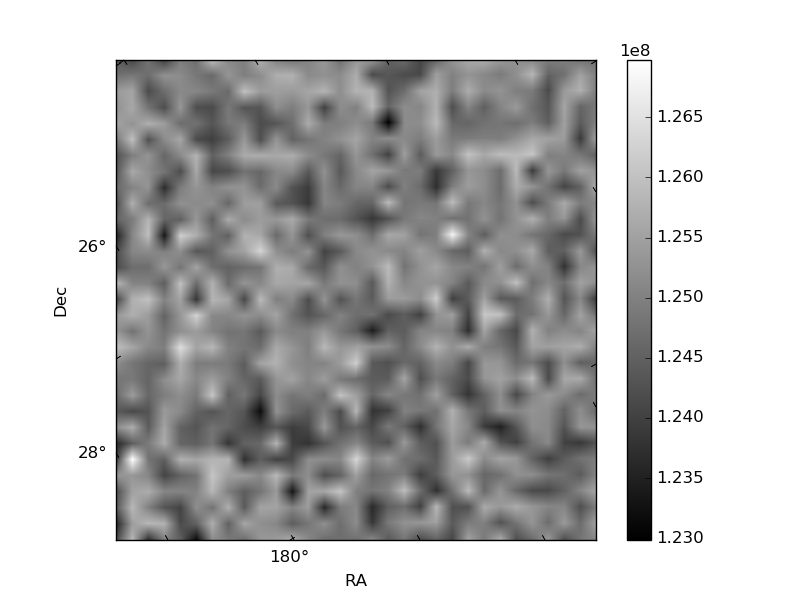
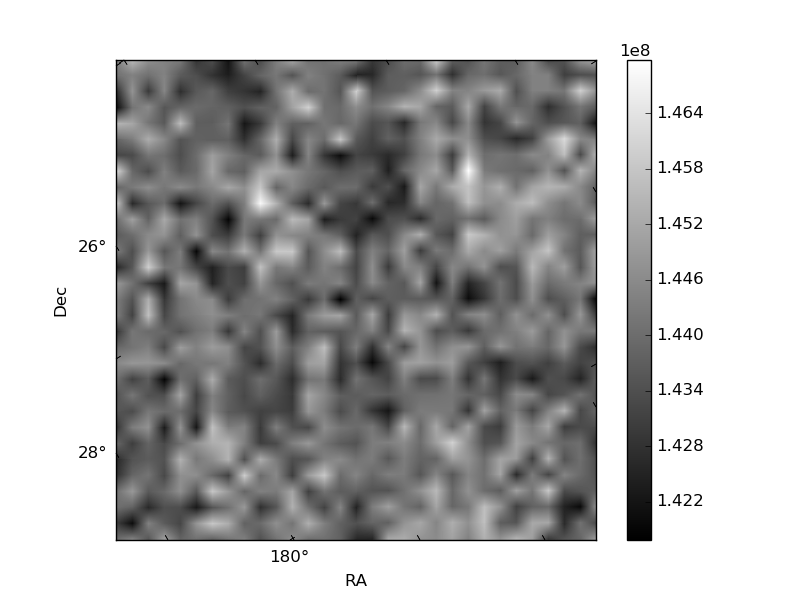
Histogram calculated using DETX and DETY for each event in the final _common_clean file
| Quadrant A | 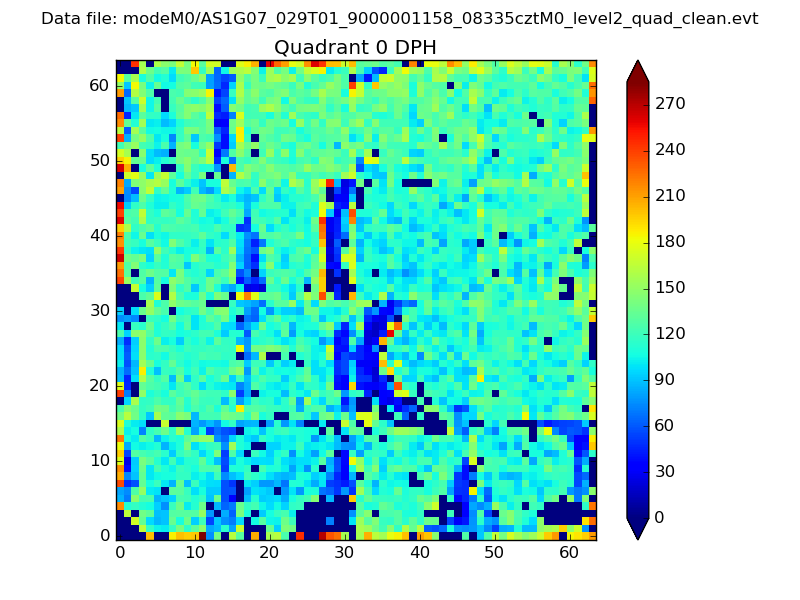 |
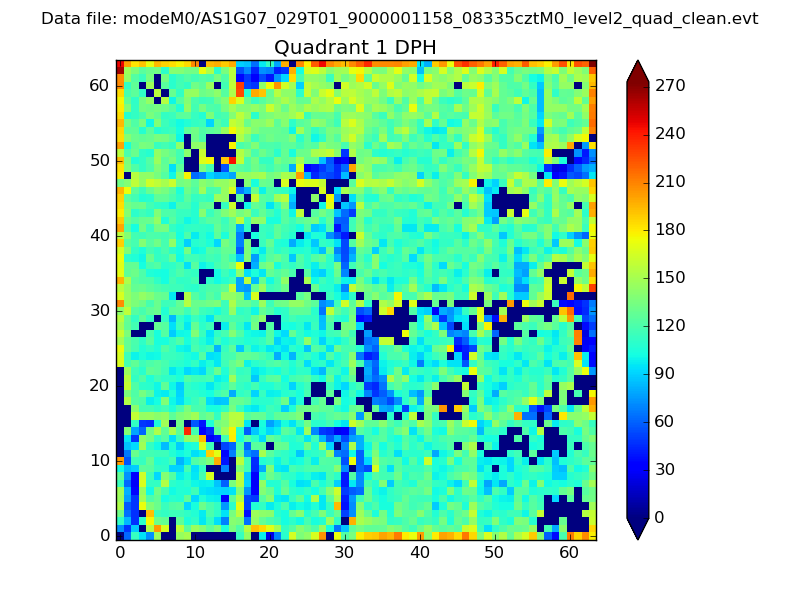 |
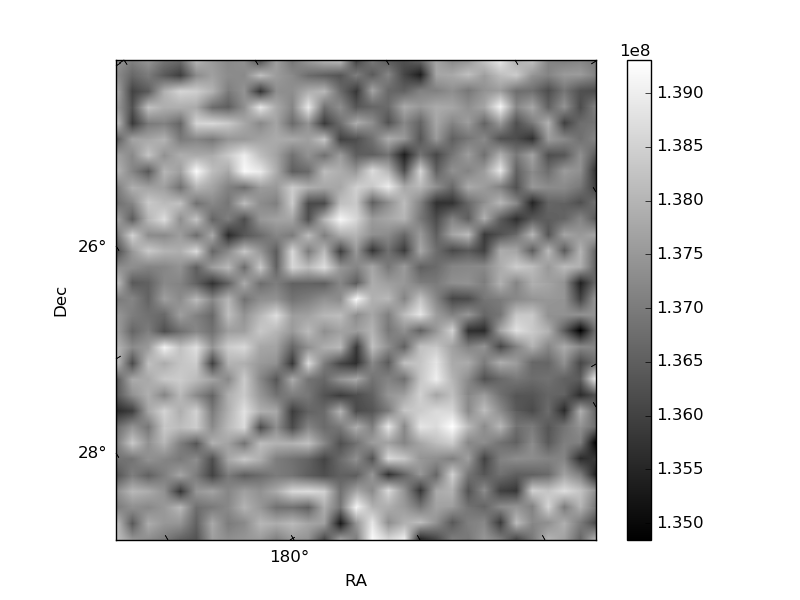
Quadrant B |
|---|---|---|---|
| Quadrant D | 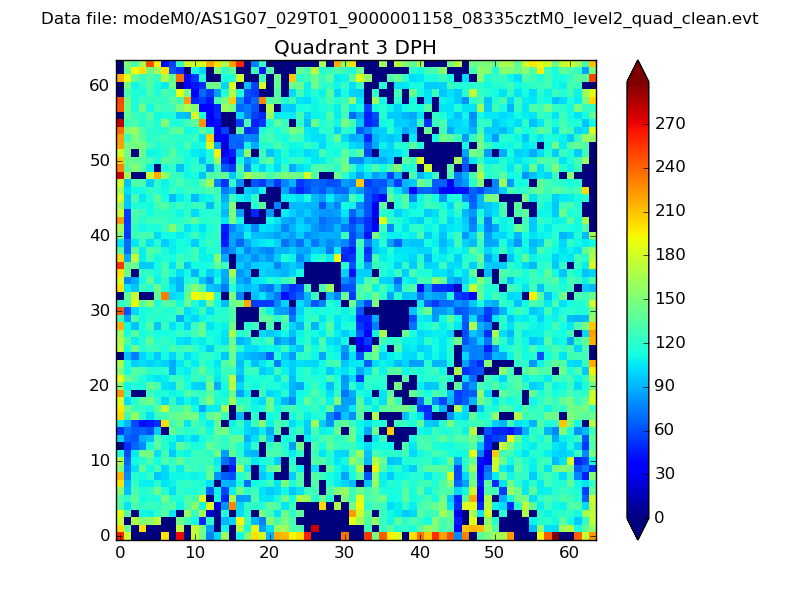 |
 |
Quadrant C |
| Plot type | Count rate plots | Images |
|---|---|---|
| Comparison with Poisson distribution Blue bars denote a histogram of data divided into 1 sec bins. Red curve is a Poisson curve with rate = median count rate of data. |
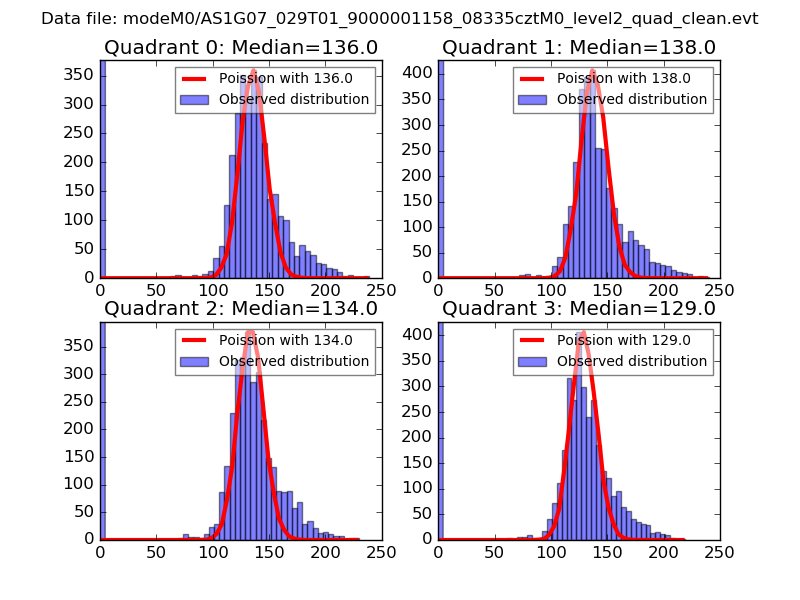 |
 |
| Quadrant-wise count rates Data is divided into 100 sec bins |
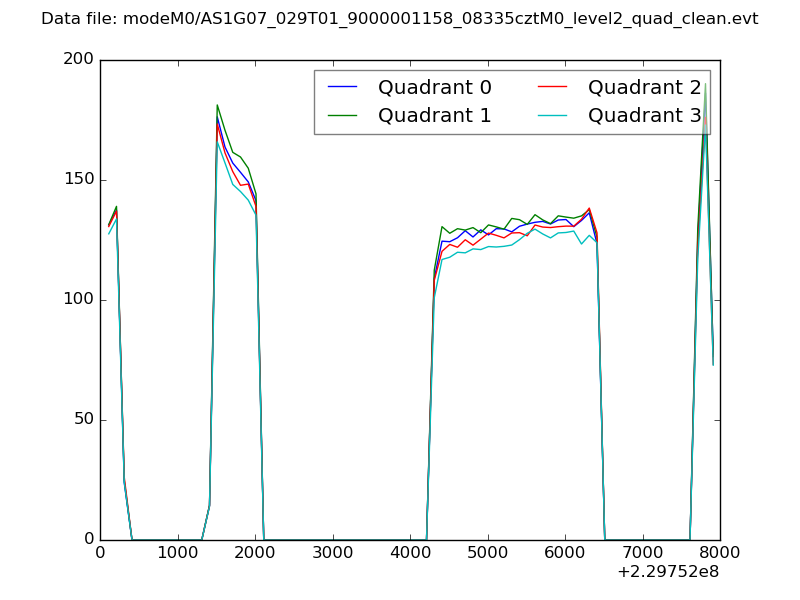 |
|
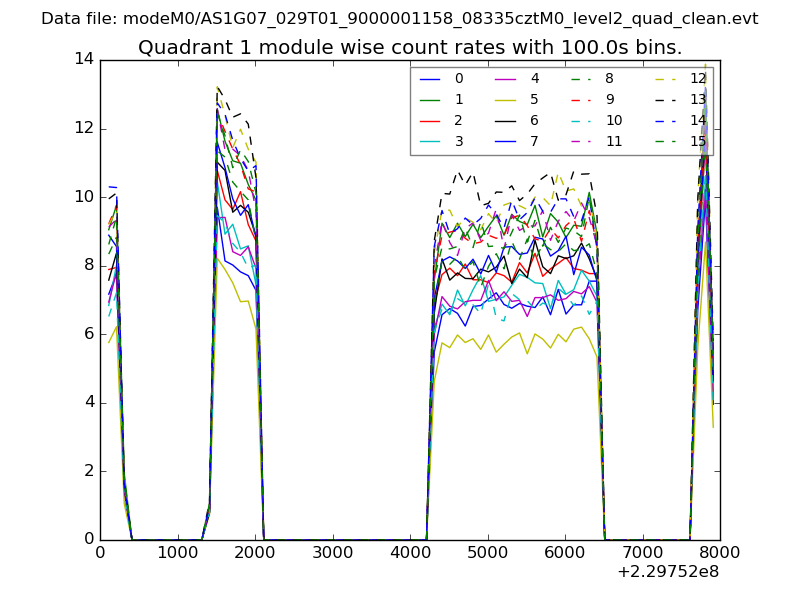
| Module-wise count rates for Quadrant A Data is divided into 100 sec bins |
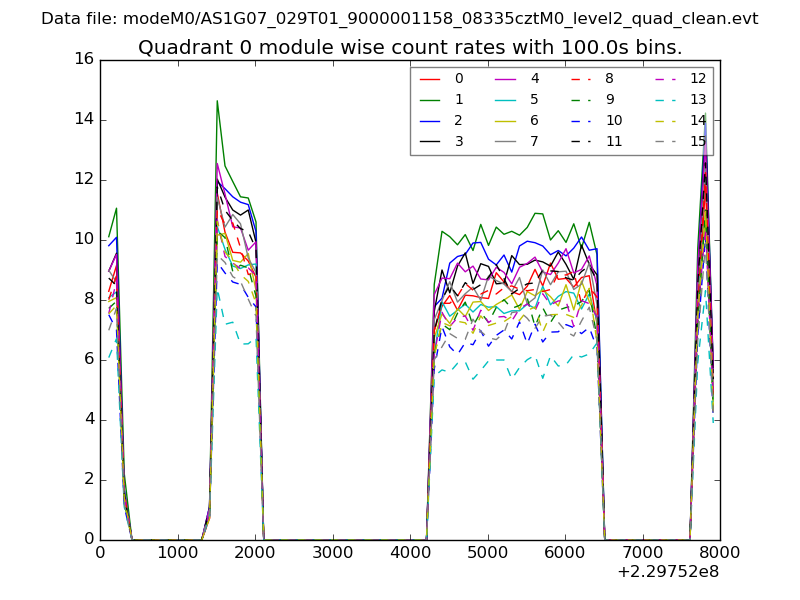 |
 |
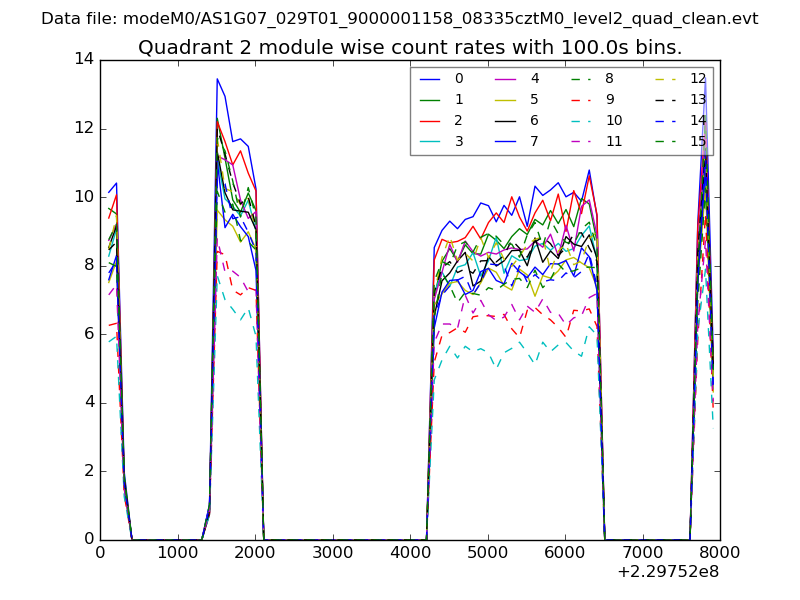
| Module-wise count rates for Quadrant B Data is divided into 100 sec bins |
 |
 |
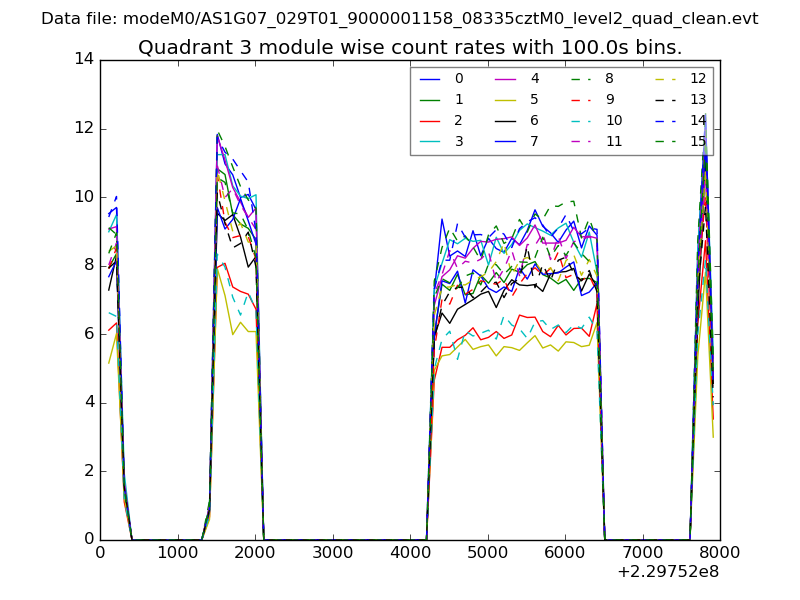
| Module-wise count rates for Quadrant C Data is divided into 100 sec bins |
 |
 |
| Module-wise count rates for Quadrant D Data is divided into 100 sec bins |
 |
 |
| Parameter | Plot |
|---|---|
| CZT HV Monitor | 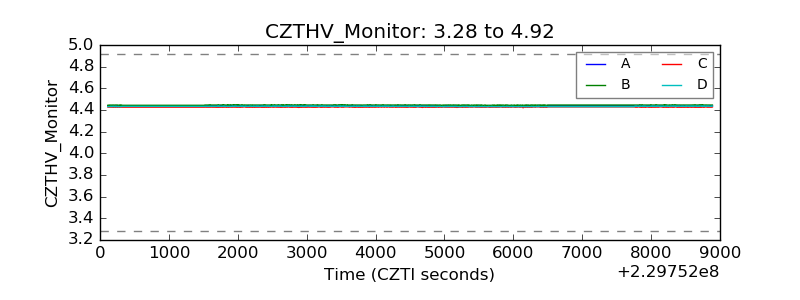 |
| D_VDD | 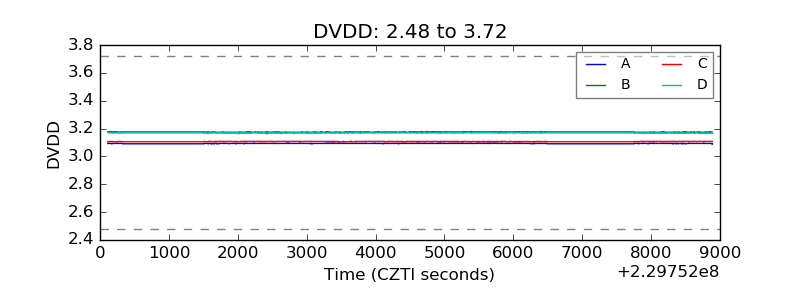 |
| Temperature 1 | 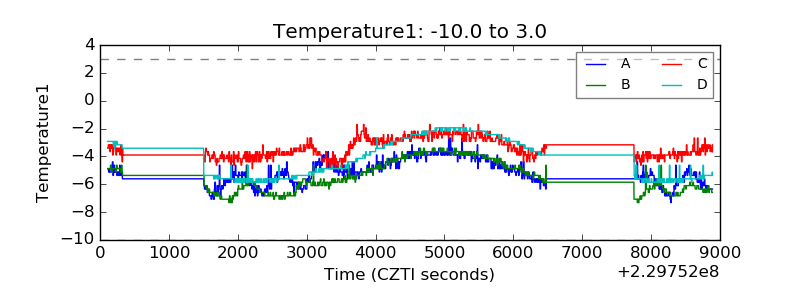 |
| Veto HV Monitor | 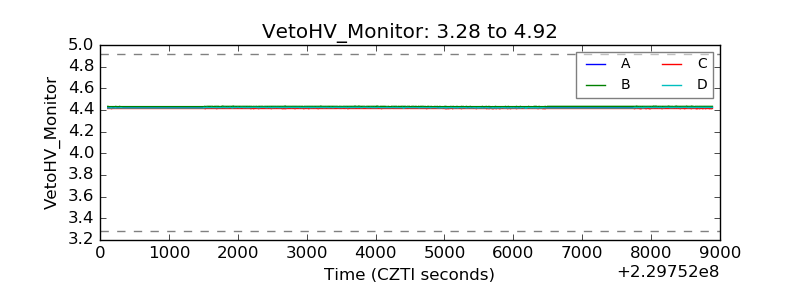 |
| Veto LLD |  |
| Alpha Counter | 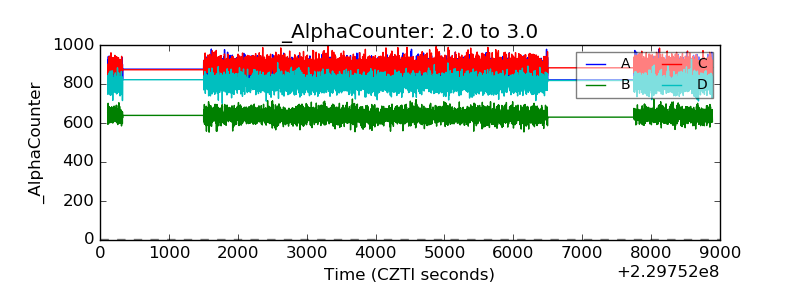 |
| _CPM_Rate | 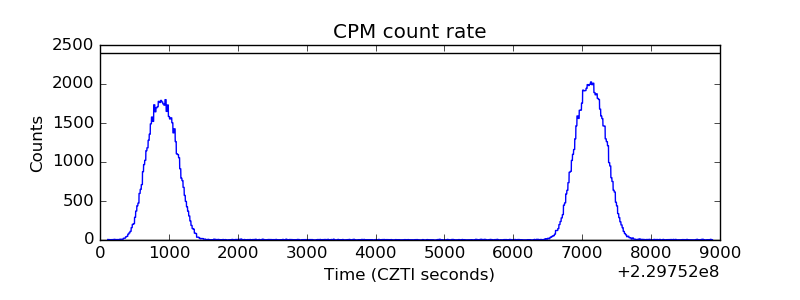 |
| CZT Counter | 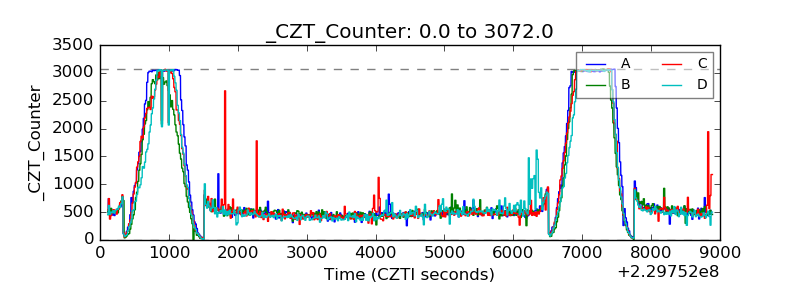 |
| +2.5 Volts monitor |  |
| +5 Volts monitor |  |
| _ROLL_ROT | 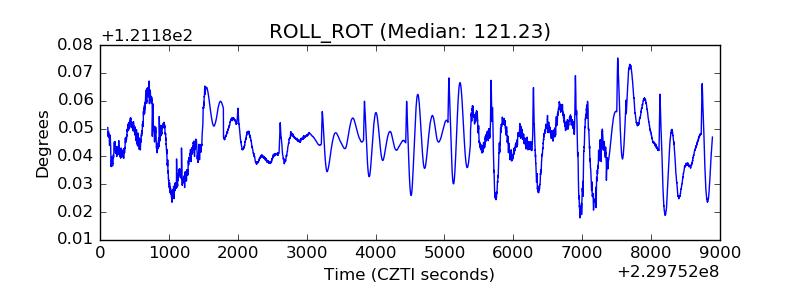 |
| _Roll_DEC | 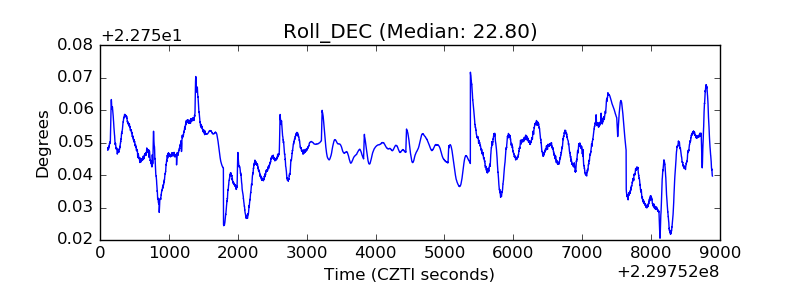 |
| _Roll_RA | 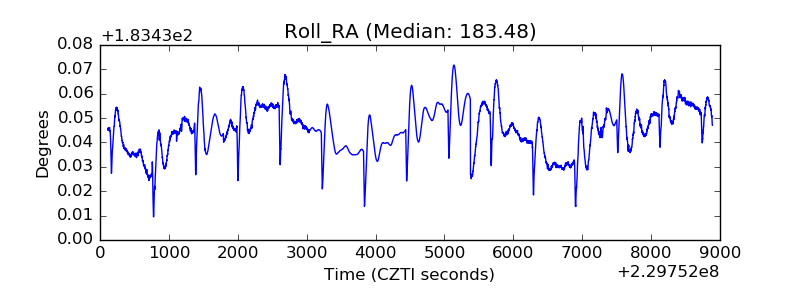 |
| Veto Counter | 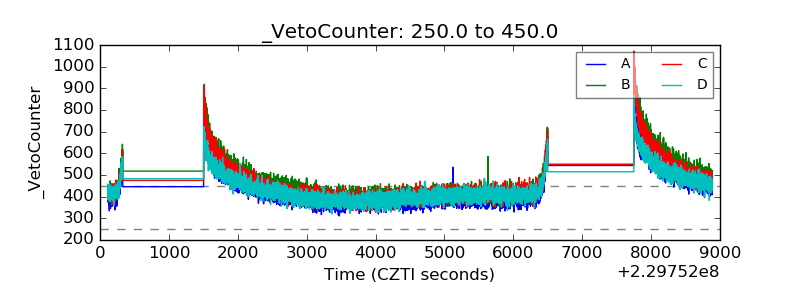 |