| Param | Original file | Final file |
|---|---|---|
| Filename | modeM0/AS1G07_029T01_9000001158_08337cztM0_level2.evt | modeM0/AS1G07_029T01_9000001158_08337cztM0_level2_quad_clean.evt |
| Size (bytes) | 486,760,320 | 65,111,040 |
| Size | 464.2 MB | 62.1 MB |
| Events in quadrant A | 3,163,755 | 391,869 |
| Events in quadrant B | 4,468,535 | 396,041 |
| Events in quadrant C | 3,059,686 | 384,452 |
| Events in quadrant D | 3,633,268 | 370,887 |
| Mode SS | |||
|---|---|---|---|
| Quadrant | BADHDUFLAG | Total packets | Discarded packets |
| A | 0 | 124 | 0 |
| B | 0 | 124 | 0 |
| C | 0 | 124 | 0 |
| D | 0 | 124 | 0 |
| Mode M0 | |||
|---|---|---|---|
| Quadrant | BADHDUFLAG | Total packets | Discarded packets |
| A | 0 | 13052 | 34 |
| B | 0 | 16889 | 27 |
| C | 0 | 12813 | 17 |
| D | 0 | 14744 | 61 |
| Mode M9 | |||
|---|---|---|---|
| Quadrant | BADHDUFLAG | Total packets | Discarded packets |
| A | 0 | 16 | 0 |
| B | 0 | 16 | 0 |
| C | 0 | 16 | 0 |
| D | 0 | 17 | 0 |
| Quadrant | Total seconds | Saturated seconds | Saturation percentage |
|---|---|---|---|
| A | 6134 | 82 | 1.336811% |
| B | 6139 | 664 | 10.816094% |
| C | 6138 | 24 | 0.391007% |
| D | 6126 | 49 | 0.799869% |
Noise dominated data is calculated using 1-second bins in cleaned event files. If a bin has >2000 counts, and if more than 50% of those come from <1% of pixels, then it is considered to be noise-dominated and hence unusable.
| Quadrant | # 1 sec bins | Bins with >0 counts | Bins with >2000 counts | High rate bins dominated by noise | Noise dominated (total time) | Noise dominated (detector-on time) | Marked lightcurve |
|---|---|---|---|---|---|---|---|
| A | 7489 | 6142 | 0 | 0 | 0.00% | 0.00% | 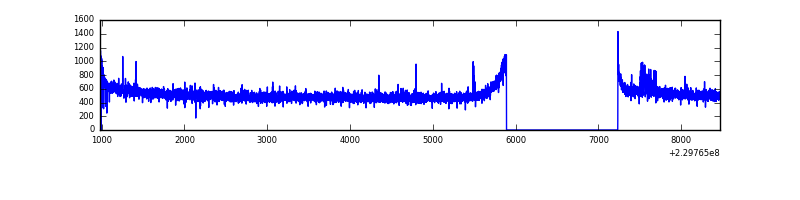 |
| B | 7489 | 6144 | 580 | 580 | 7.74% | 9.44% | 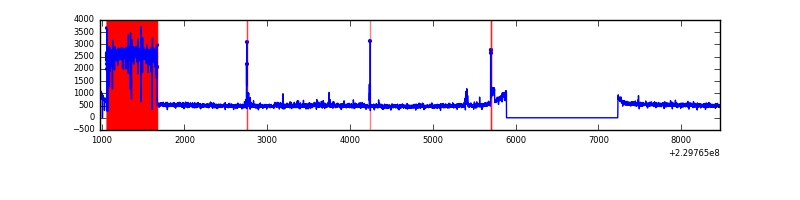 |
| C | 7489 | 6145 | 0 | 0 | 0.00% | 0.00% | 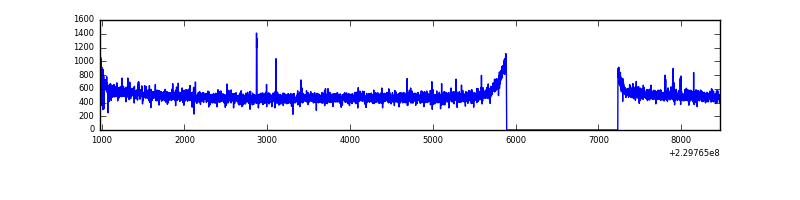 |
| D | 7489 | 6142 | 18 | 18 | 0.24% | 0.29% | 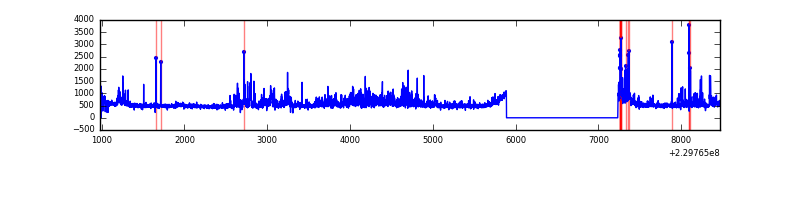 |
Top three noisy pixels from each quadrant. If the there are fewer than three noisy pixels in the level2.evt file, extra rows are filled as -1
| Pixel properties | Quadrant properties | ||||||
|---|---|---|---|---|---|---|---|
| Quadrant | DetID | PixID | Counts | Sigma | Mean | Median | Sigma |
| A | 14 | 111 | 27345 | 161.7 | 814 | 799 | 164.2 |
| A | 0 | 226 | 7698 | 42.02 | 814 | 799 | 164.2 |
| A | 12 | 194 | 7062 | 38.15 | 814 | 799 | 164.2 |
| B | 4 | 81 | 1449545 | 10149.14 | 760 | 744 | 142.8 |
| B | 0 | 214 | 48662 | 335.68 | 760 | 744 | 142.8 |
| B | 12 | 111 | 15786 | 105.37 | 760 | 744 | 142.8 |
| C | 9 | 54 | 20378 | 109.06 | 779 | 786 | 179.6 |
| C | 13 | 61 | 5966 | 28.84 | 779 | 786 | 179.6 |
| C | 3 | 202 | 1936 | 6.4 | 779 | 786 | 179.6 |
| D | 2 | 152 | 293780 | 1581.67 | 772 | 753 | 185.3 |
| D | 12 | 221 | 226874 | 1220.53 | 772 | 753 | 185.3 |
| D | 2 | 136 | 85035 | 454.93 | 772 | 753 | 185.3 |
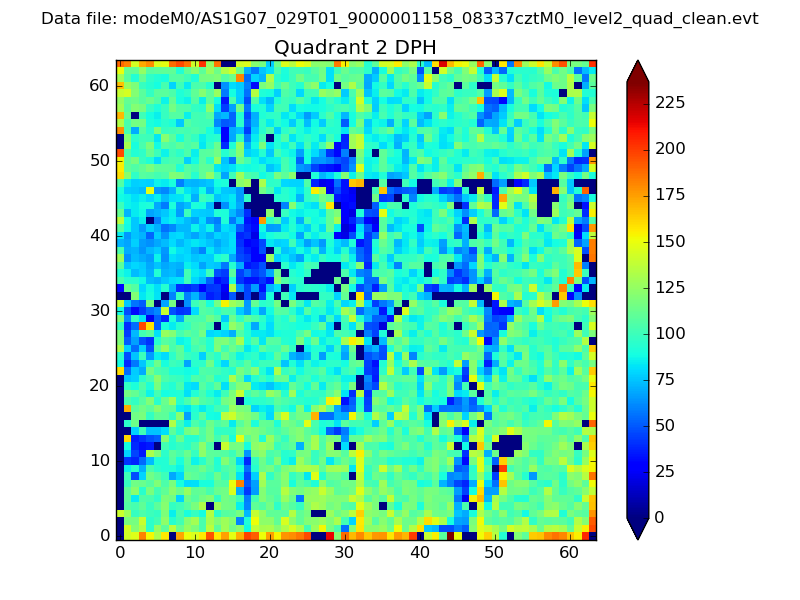
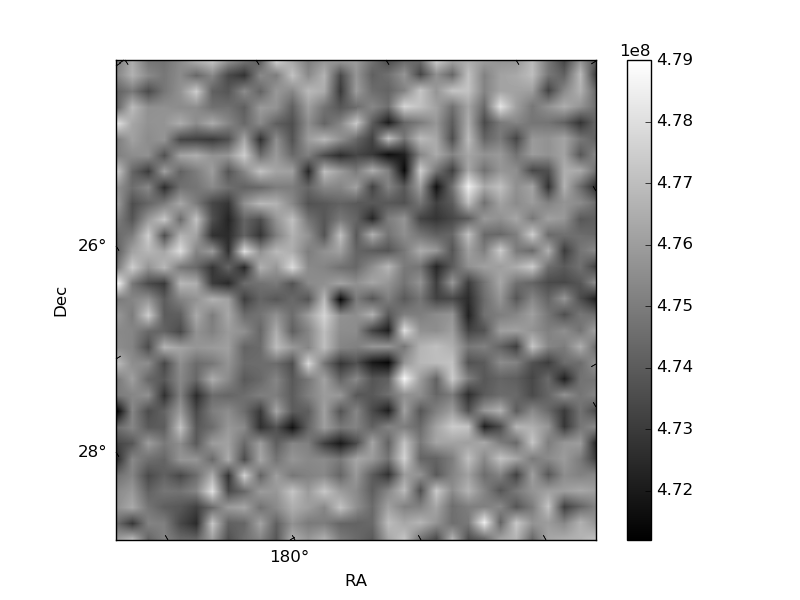
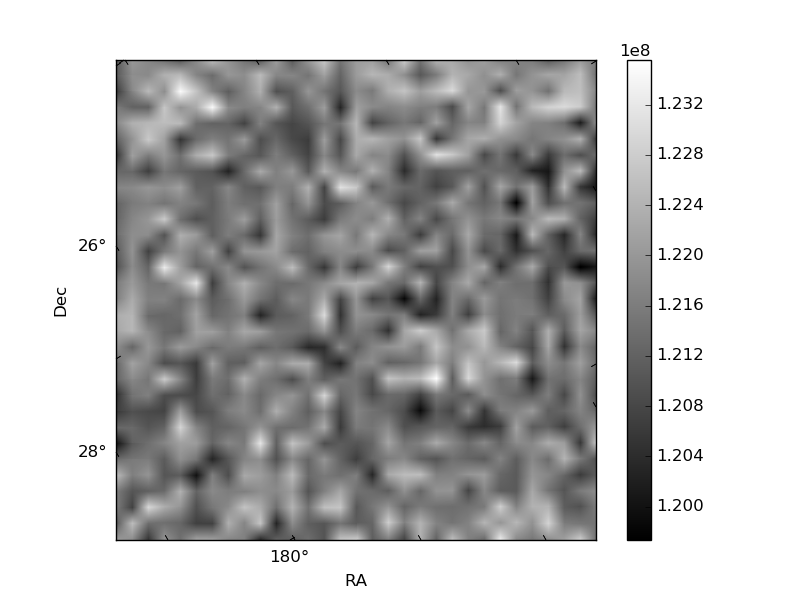
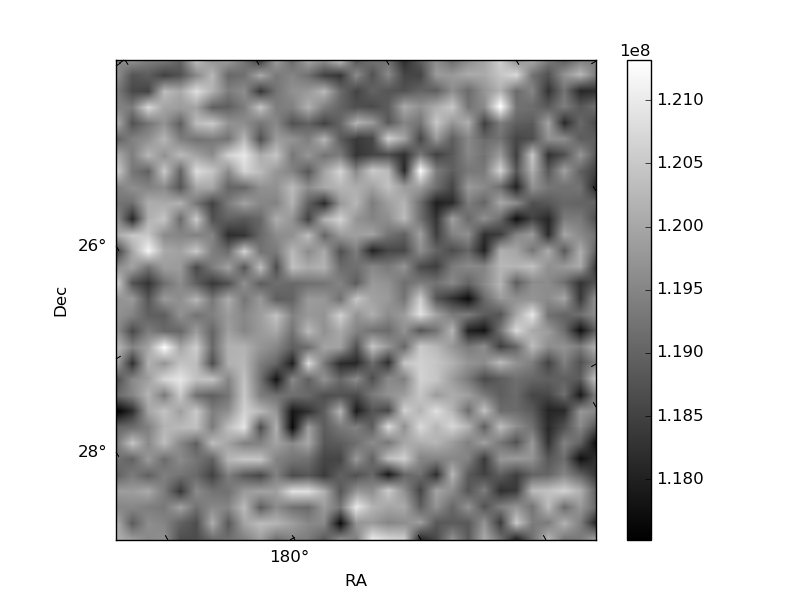
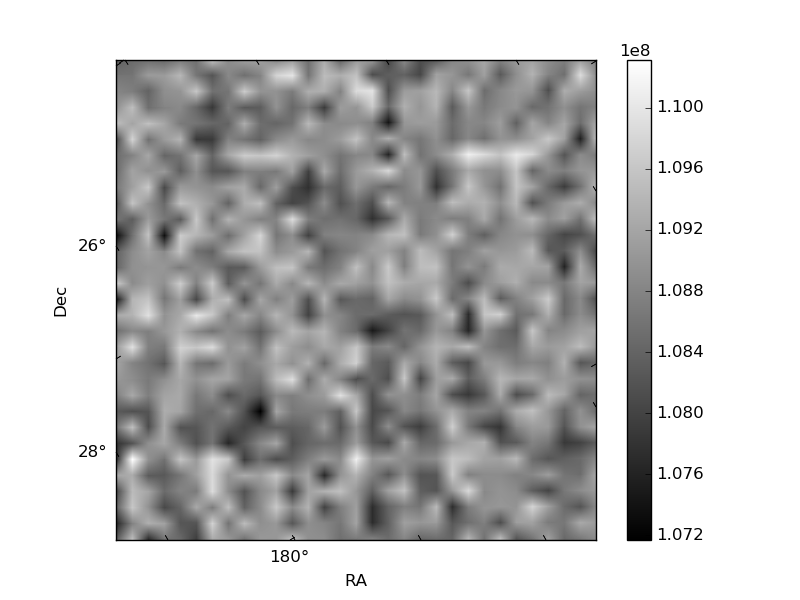
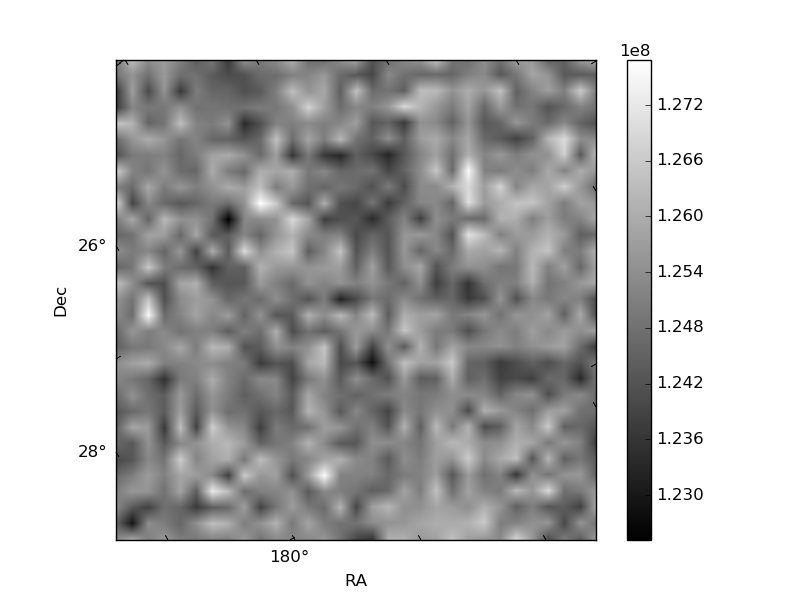
Histogram calculated using DETX and DETY for each event in the final _common_clean file
| Quadrant A | 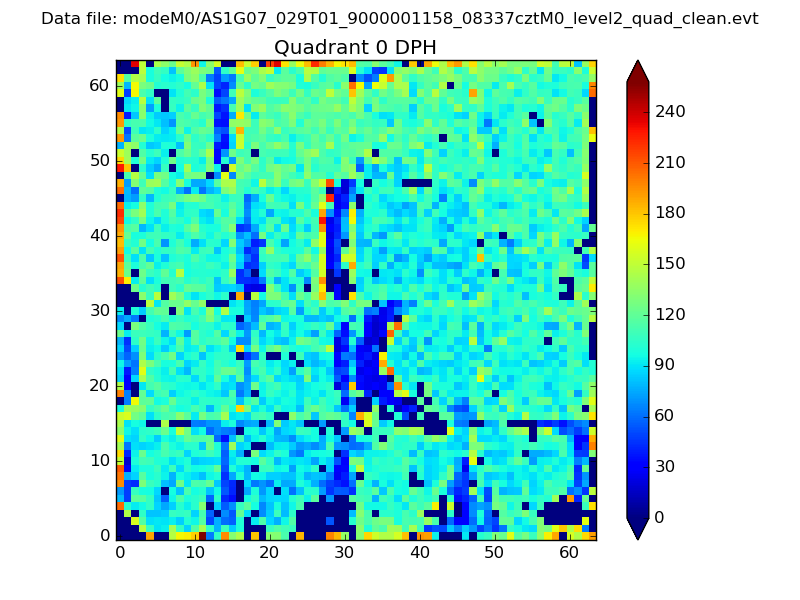 |
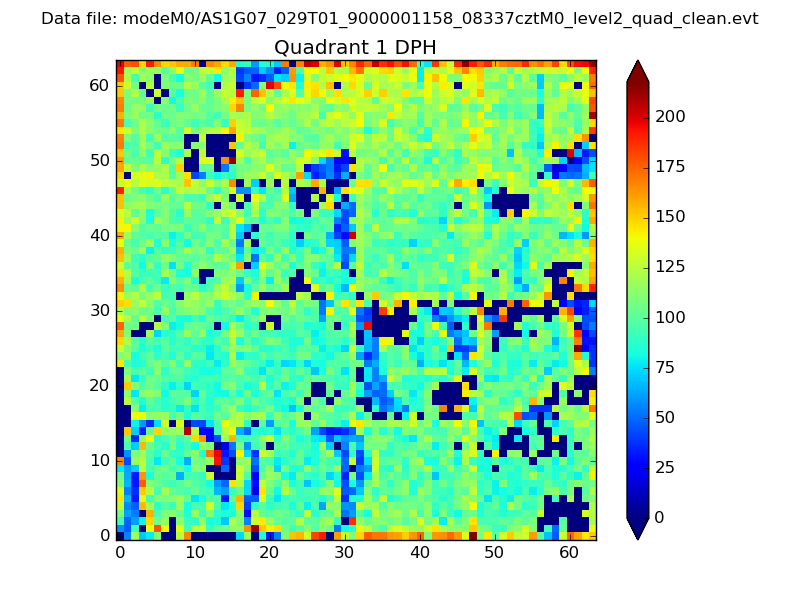 |
Quadrant B |
|---|---|---|---|
| Quadrant D | 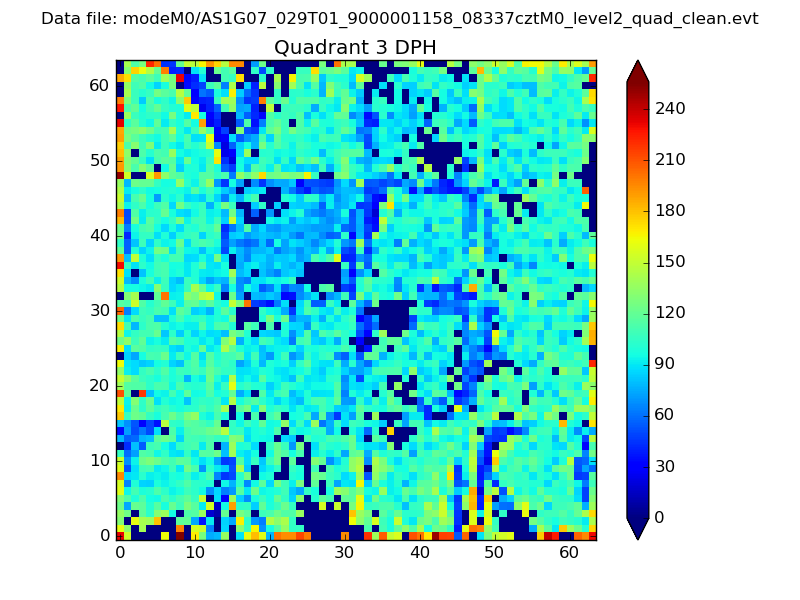 |
 |
Quadrant C |
| Plot type | Count rate plots | Images |
|---|---|---|
| Comparison with Poisson distribution Blue bars denote a histogram of data divided into 1 sec bins. Red curve is a Poisson curve with rate = median count rate of data. |
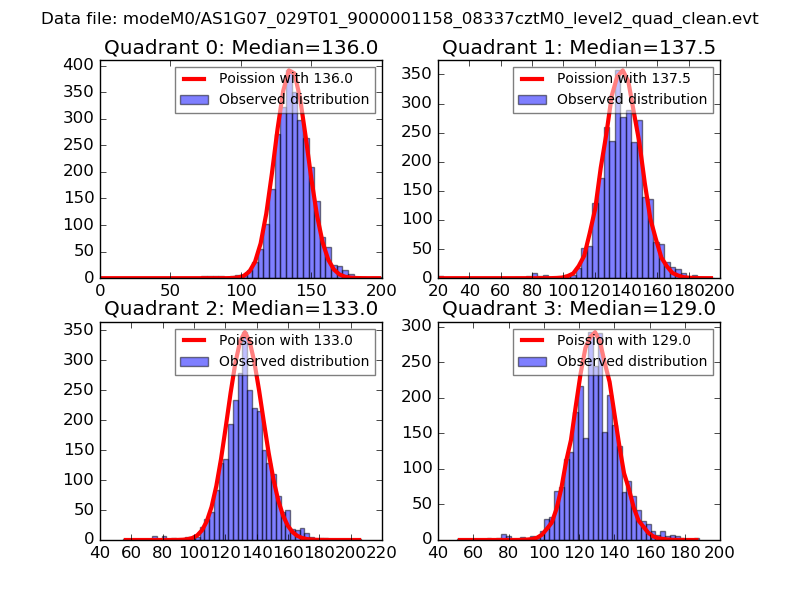 |
 |
| Quadrant-wise count rates Data is divided into 100 sec bins |
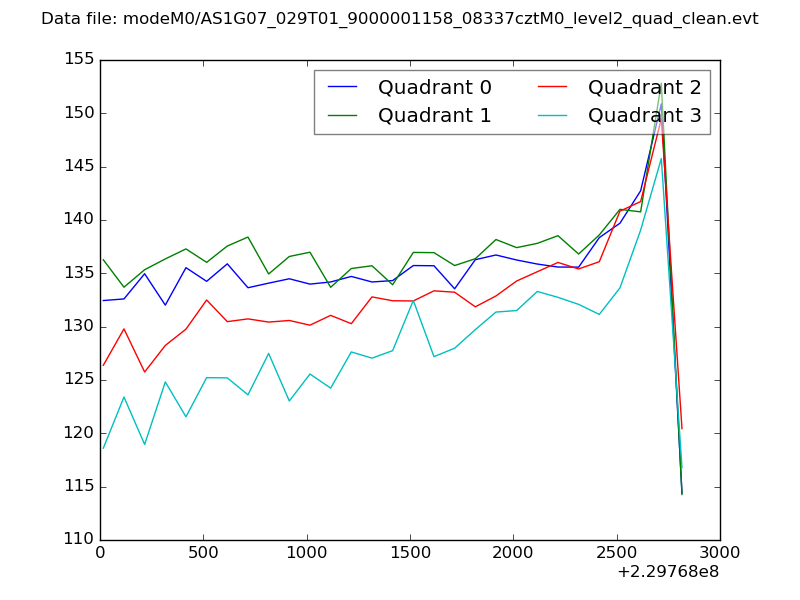 |
|
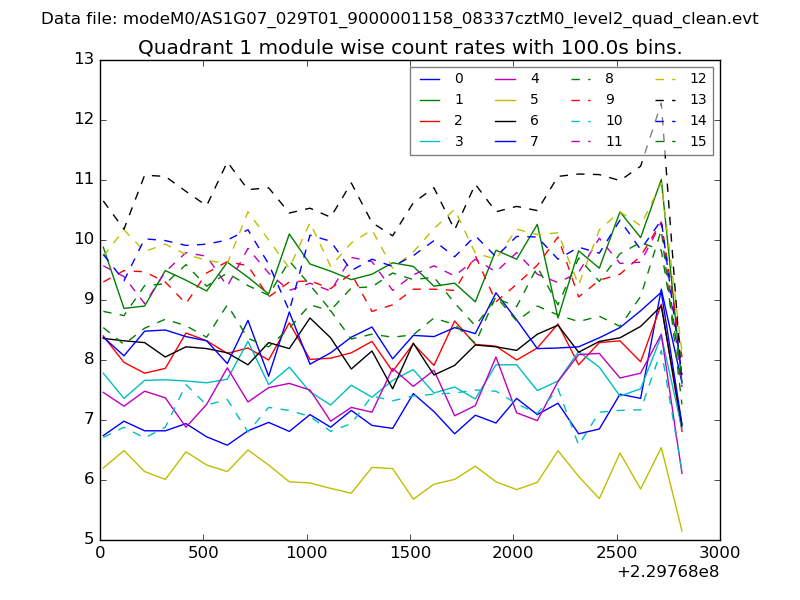
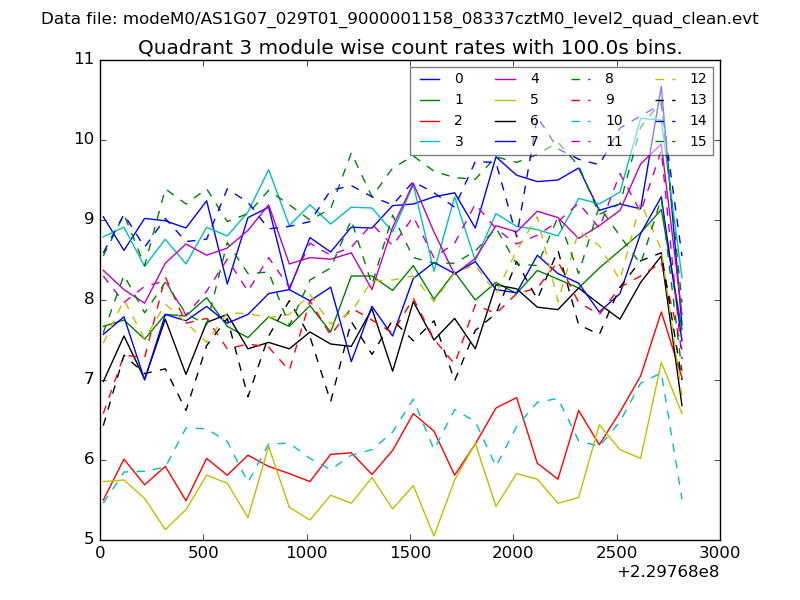
| Module-wise count rates for Quadrant A Data is divided into 100 sec bins |
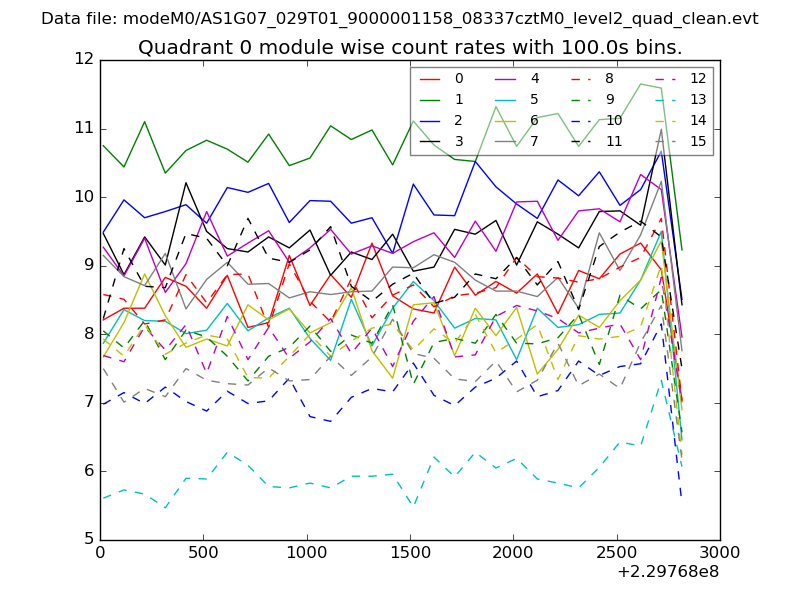 |
 |
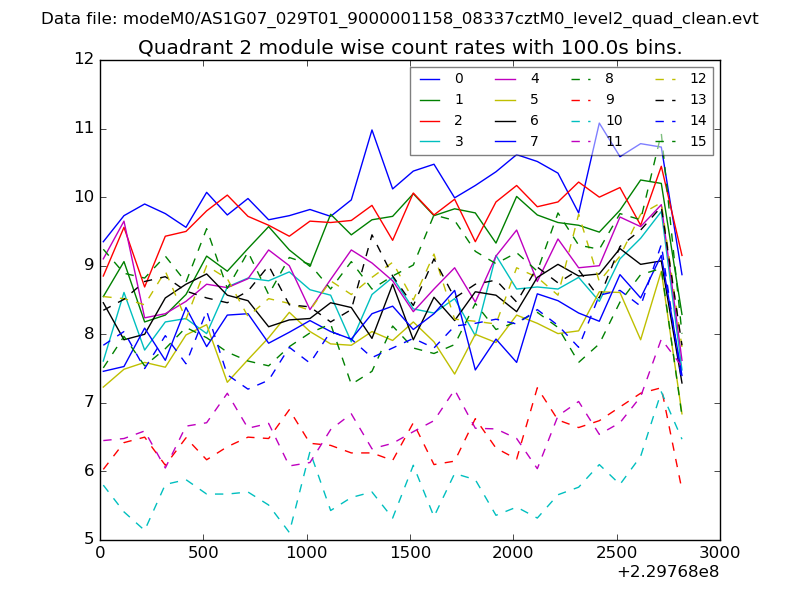
| Module-wise count rates for Quadrant B Data is divided into 100 sec bins |
 |
 |
| Module-wise count rates for Quadrant C Data is divided into 100 sec bins |
 |
 |
| Module-wise count rates for Quadrant D Data is divided into 100 sec bins |
 |
 |
| Parameter | Plot |
|---|---|
| CZT HV Monitor | 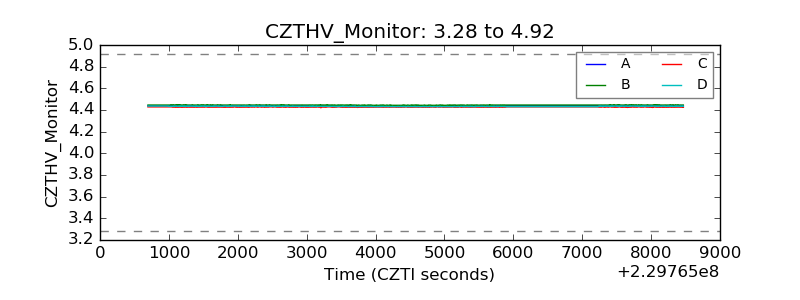 |
| D_VDD | 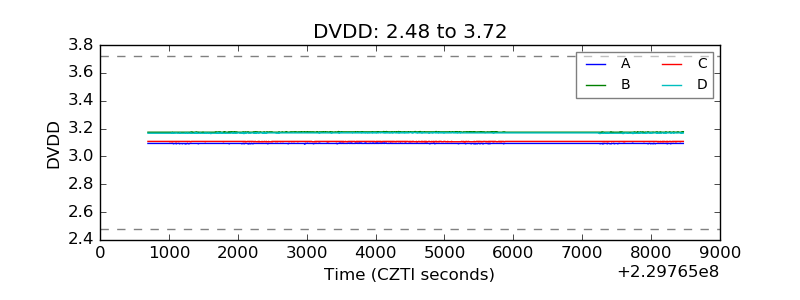 |
| Temperature 1 | 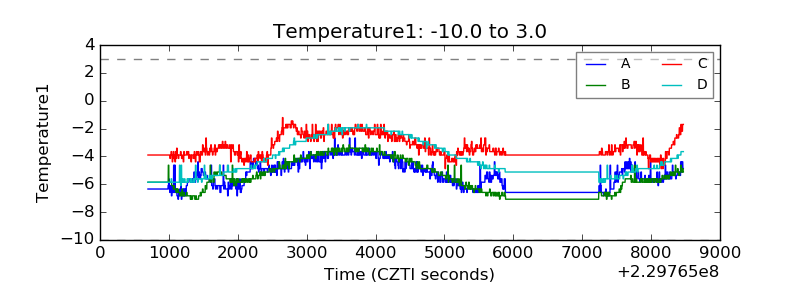 |
| Veto HV Monitor |  |
| Veto LLD | 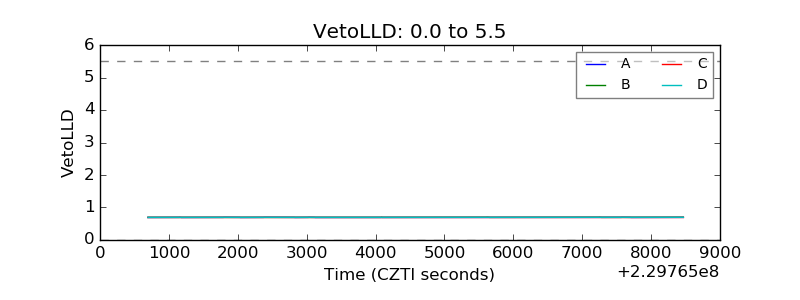 |
| Alpha Counter | 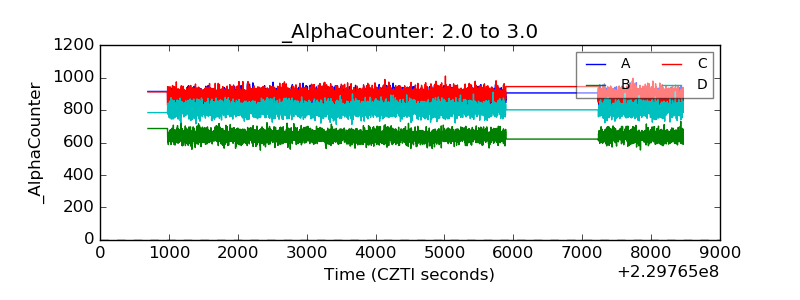 |
| _CPM_Rate | 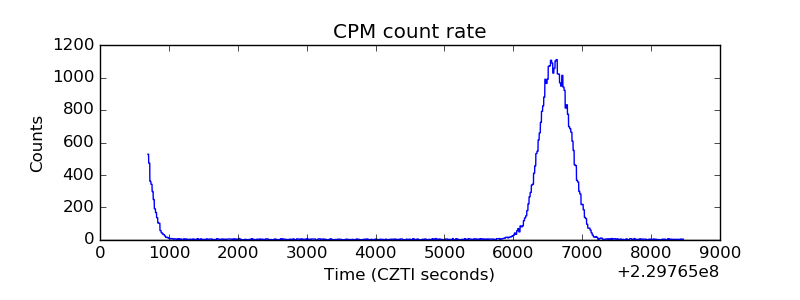 |
| CZT Counter | 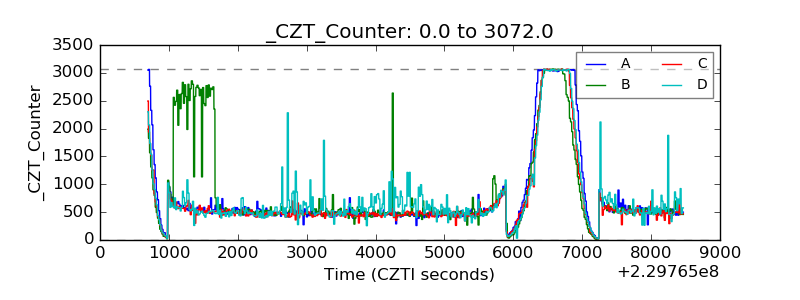 |
| +2.5 Volts monitor |  |
| +5 Volts monitor |  |
| _ROLL_ROT | 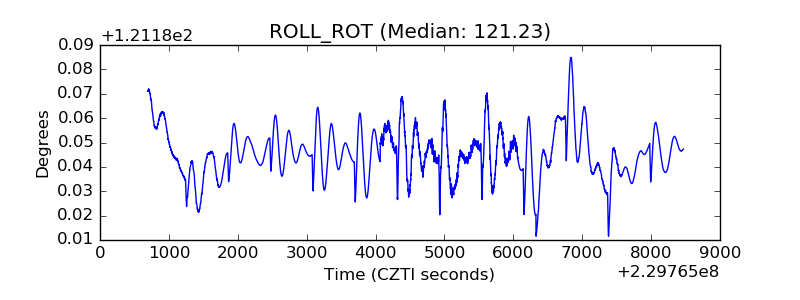 |
| _Roll_DEC | 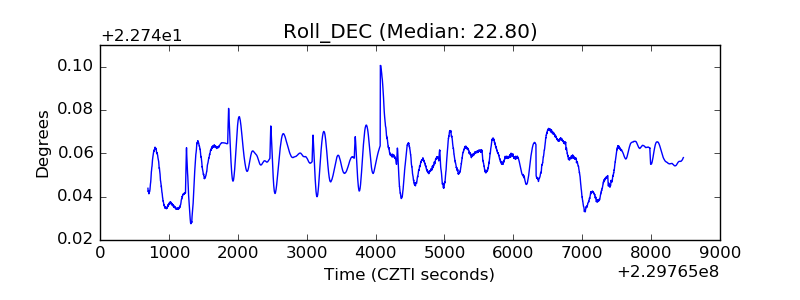 |
| _Roll_RA | 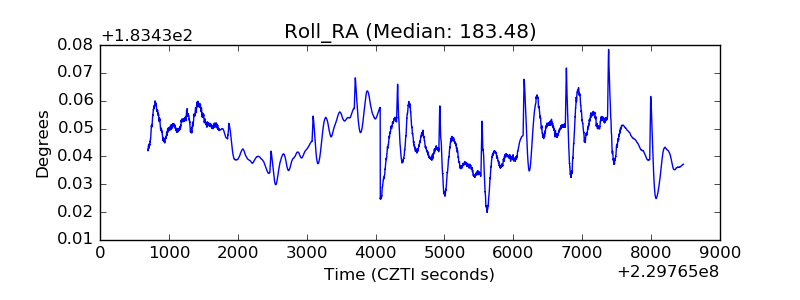 |
| Veto Counter | 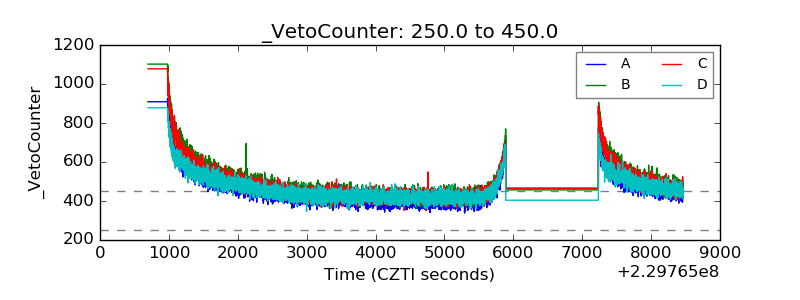 |