| Param | Original file | Final file |
|---|---|---|
| Filename | modeM0/AS1G07_029T01_9000001158_08340cztM0_level2.evt | modeM0/AS1G07_029T01_9000001158_08340cztM0_level2_quad_clean.evt |
| Size (bytes) | 500,708,160 | 90,757,440 |
| Size | 477.5 MB | 86.6 MB |
| Events in quadrant A | 3,669,875 | 564,523 |
| Events in quadrant B | 3,689,561 | 569,159 |
| Events in quadrant C | 3,614,536 | 557,018 |
| Events in quadrant D | 3,684,883 | 540,578 |
| Mode SS | |||
|---|---|---|---|
| Quadrant | BADHDUFLAG | Total packets | Discarded packets |
| A | 0 | 152 | 0 |
| B | 0 | 152 | 0 |
| C | 0 | 152 | 0 |
| D | 0 | 152 | 0 |
| Mode M0 | |||
|---|---|---|---|
| Quadrant | BADHDUFLAG | Total packets | Discarded packets |
| A | 0 | 15858 | 3 |
| B | 0 | 15764 | 2 |
| C | 0 | 15827 | 2 |
| D | 0 | 16136 | 2 |
| Mode M9 | |||
|---|---|---|---|
| Quadrant | BADHDUFLAG | Total packets | Discarded packets |
| A | 0 | 13 | 0 |
| B | 0 | 13 | 0 |
| C | 0 | 13 | 0 |
| D | 0 | 13 | 0 |
| Quadrant | Total seconds | Saturated seconds | Saturation percentage |
|---|---|---|---|
| A | 7432 | 366 | 4.924650% |
| B | 7432 | 284 | 3.821313% |
| C | 7432 | 236 | 3.175457% |
| D | 7432 | 242 | 3.256189% |
Noise dominated data is calculated using 1-second bins in cleaned event files. If a bin has >2000 counts, and if more than 50% of those come from <1% of pixels, then it is considered to be noise-dominated and hence unusable.
| Quadrant | # 1 sec bins | Bins with >0 counts | Bins with >2000 counts | High rate bins dominated by noise | Noise dominated (total time) | Noise dominated (detector-on time) | Marked lightcurve |
|---|---|---|---|---|---|---|---|
| A | 8707 | 7433 | 37 | 37 | 0.42% | 0.50% | 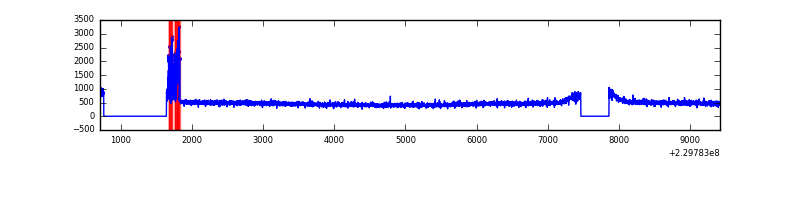 |
| B | 8707 | 7434 | 5 | 5 | 0.06% | 0.07% | 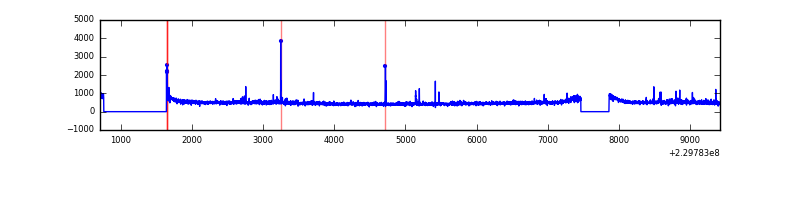 |
| C | 8707 | 7433 | 0 | 0 | 0.00% | 0.00% | 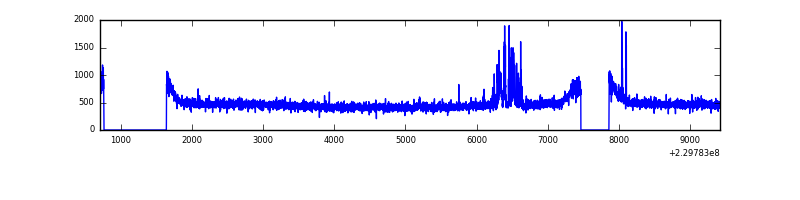 |
| D | 8707 | 7433 | 3 | 3 | 0.03% | 0.04% | 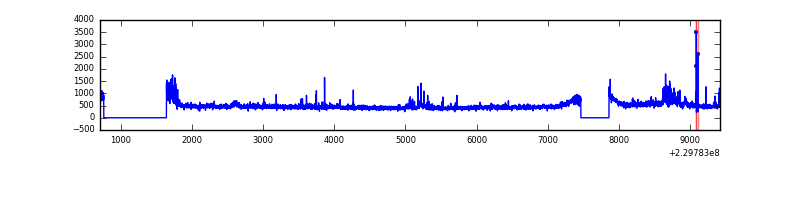 |
Top three noisy pixels from each quadrant. If the there are fewer than three noisy pixels in the level2.evt file, extra rows are filled as -1
| Pixel properties | Quadrant properties | ||||||
|---|---|---|---|---|---|---|---|
| Quadrant | DetID | PixID | Counts | Sigma | Mean | Median | Sigma |
| A | 15 | 236 | 163457 | 867.98 | 912 | 891 | 187.3 |
| A | 0 | 226 | 8375 | 39.96 | 912 | 891 | 187.3 |
| A | 12 | 194 | 8181 | 38.92 | 912 | 891 | 187.3 |
| B | 0 | 214 | 84927 | 476.91 | 914 | 892 | 176.2 |
| B | 4 | 80 | 21020 | 114.23 | 914 | 892 | 176.2 |
| B | 12 | 111 | 19983 | 108.34 | 914 | 892 | 176.2 |
| C | 9 | 54 | 131772 | 629.59 | 893 | 895 | 207.9 |
| C | 13 | 61 | 6688 | 27.87 | 893 | 895 | 207.9 |
| C | 3 | 202 | 2287 | 6.69 | 893 | 895 | 207.9 |
| D | 12 | 221 | 131937 | 609.76 | 890 | 865 | 215.0 |
| D | 1 | 7 | 55624 | 254.74 | 890 | 865 | 215.0 |
| D | 13 | 105 | 32848 | 148.79 | 890 | 865 | 215.0 |
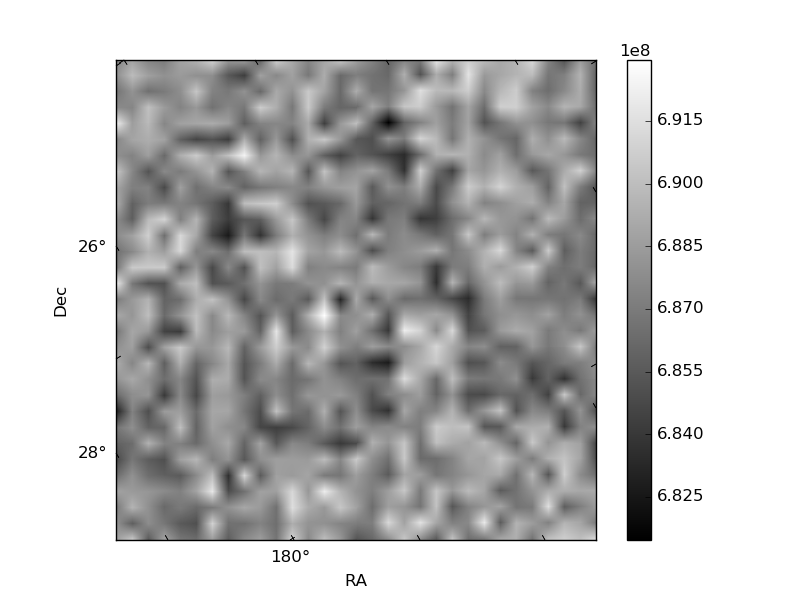
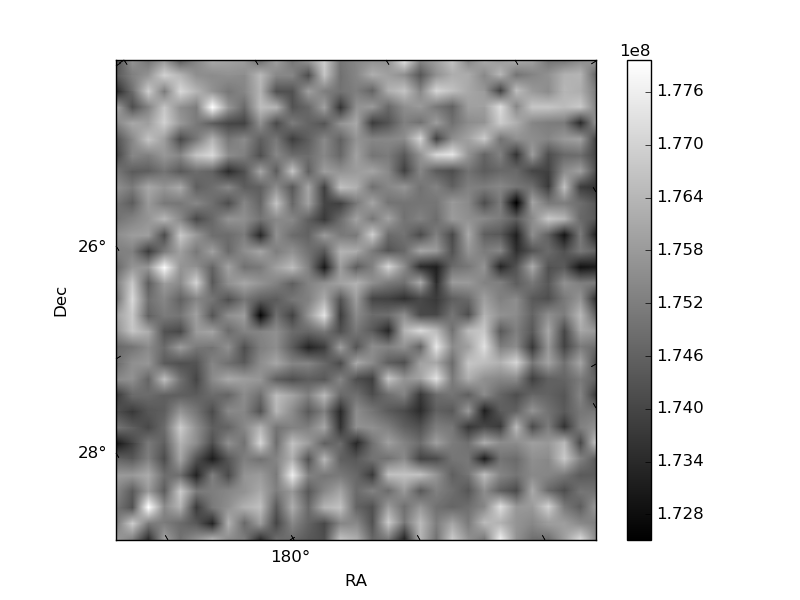
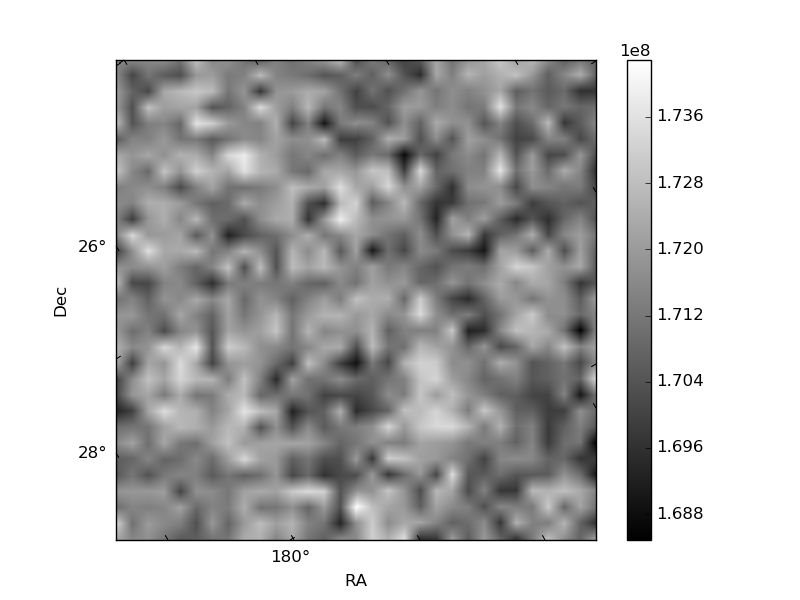
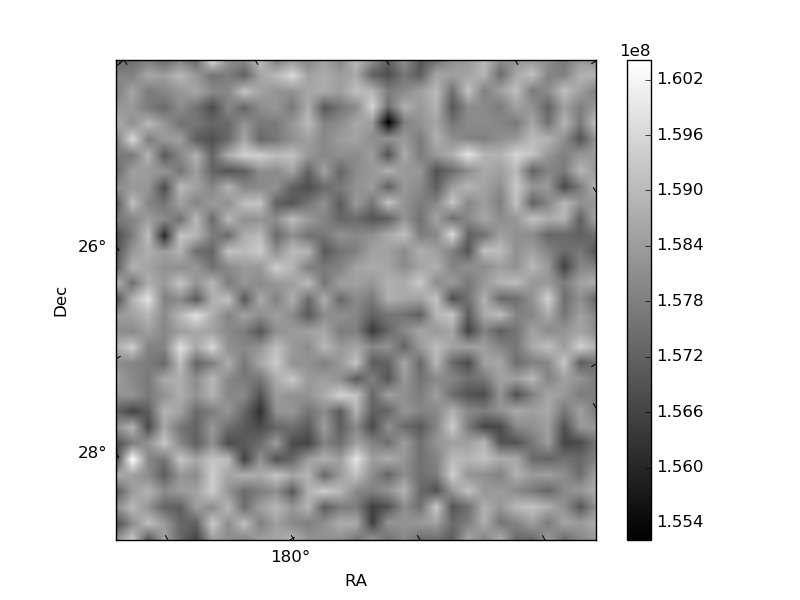
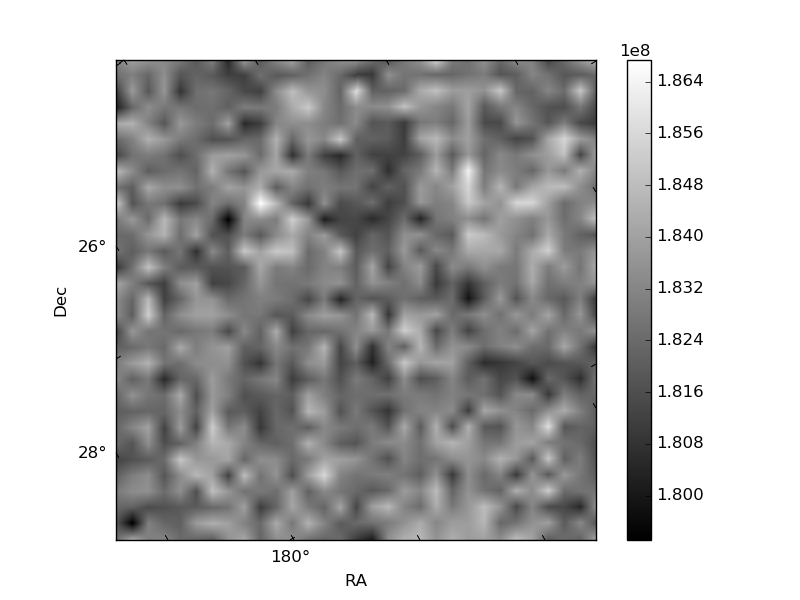
Histogram calculated using DETX and DETY for each event in the final _common_clean file
| Quadrant A | 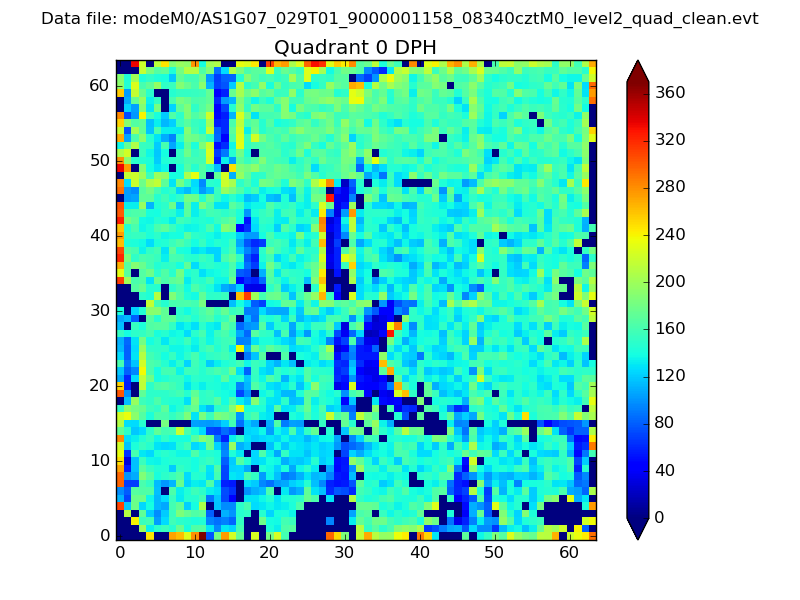 |
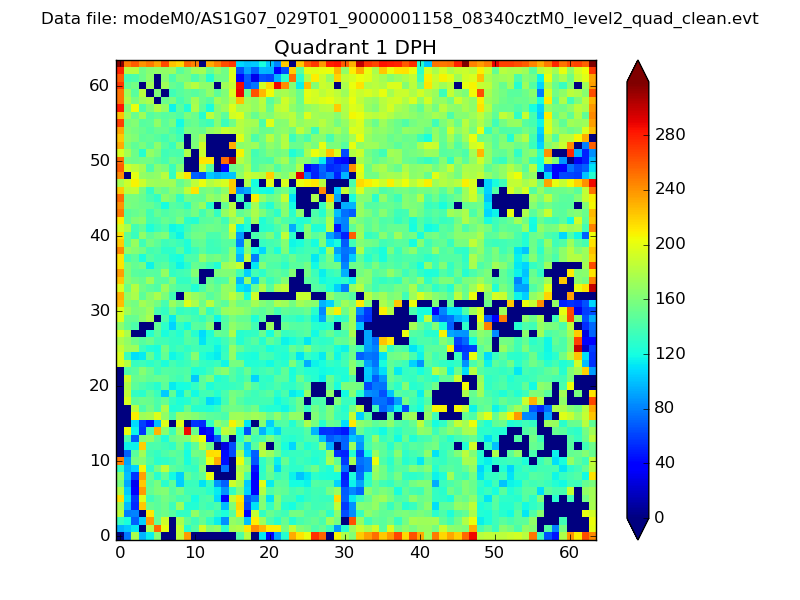 |
Quadrant B |
|---|---|---|---|
| Quadrant D | 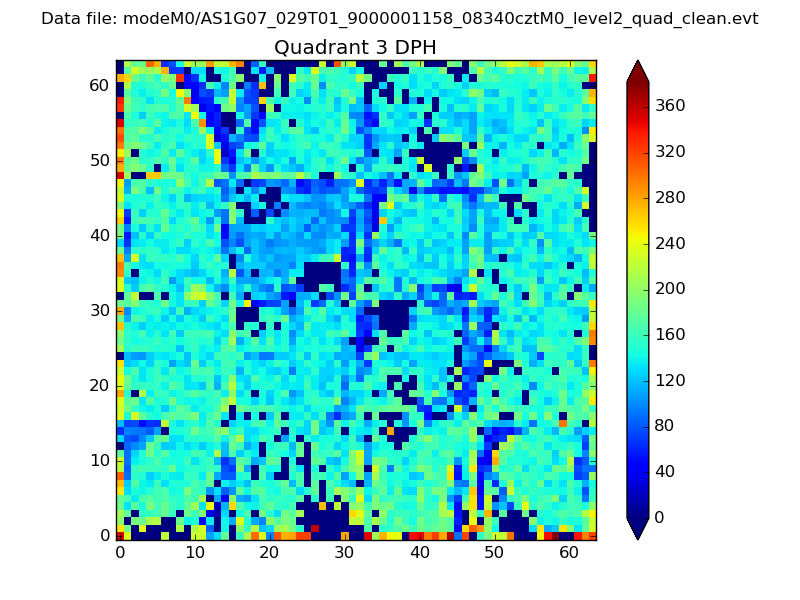 |
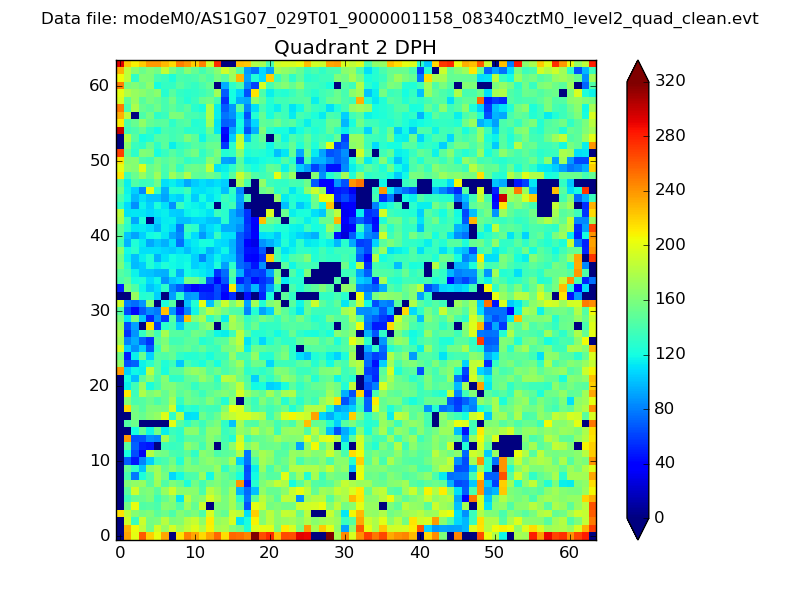 |
Quadrant C |
| Plot type | Count rate plots | Images |
|---|---|---|
| Comparison with Poisson distribution Blue bars denote a histogram of data divided into 1 sec bins. Red curve is a Poisson curve with rate = median count rate of data. |
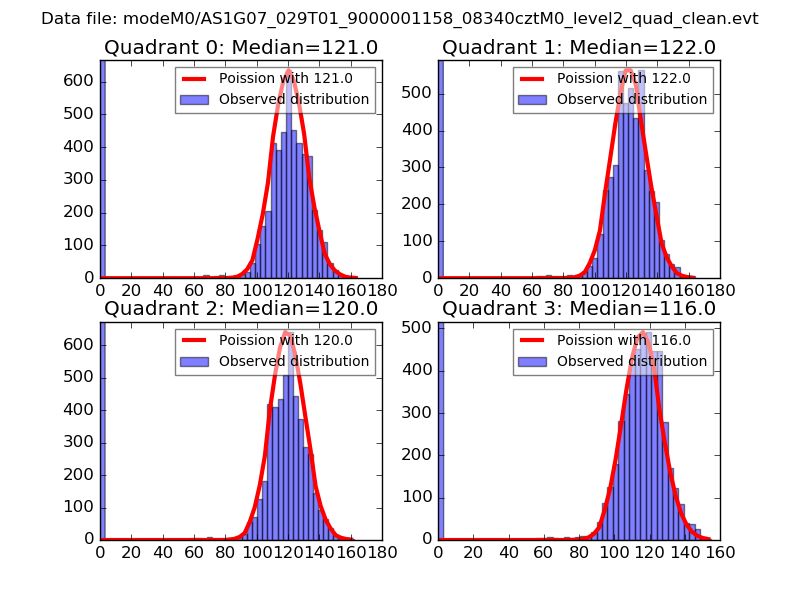 |
 |
| Quadrant-wise count rates Data is divided into 100 sec bins |
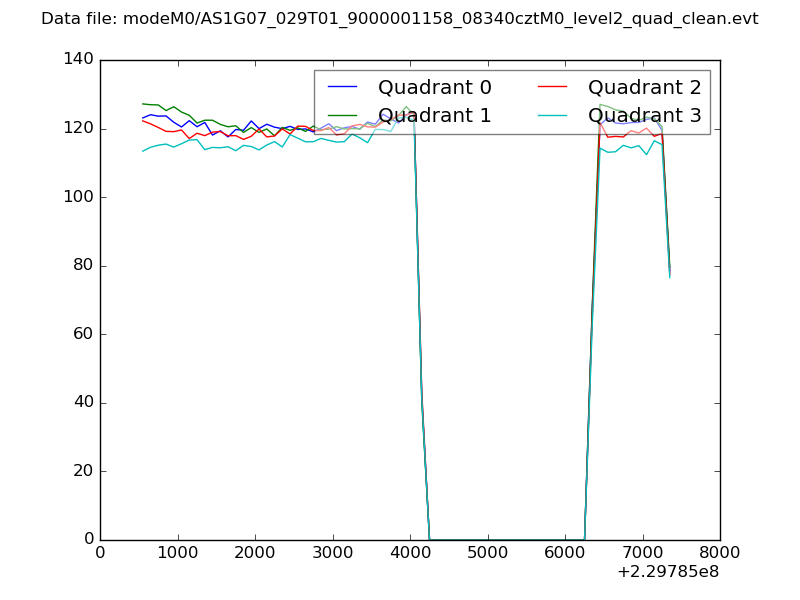 |
|
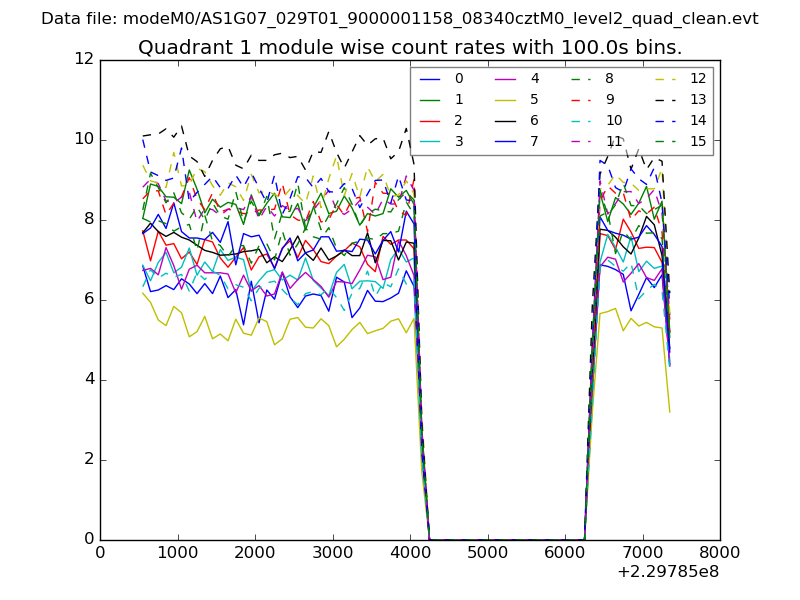
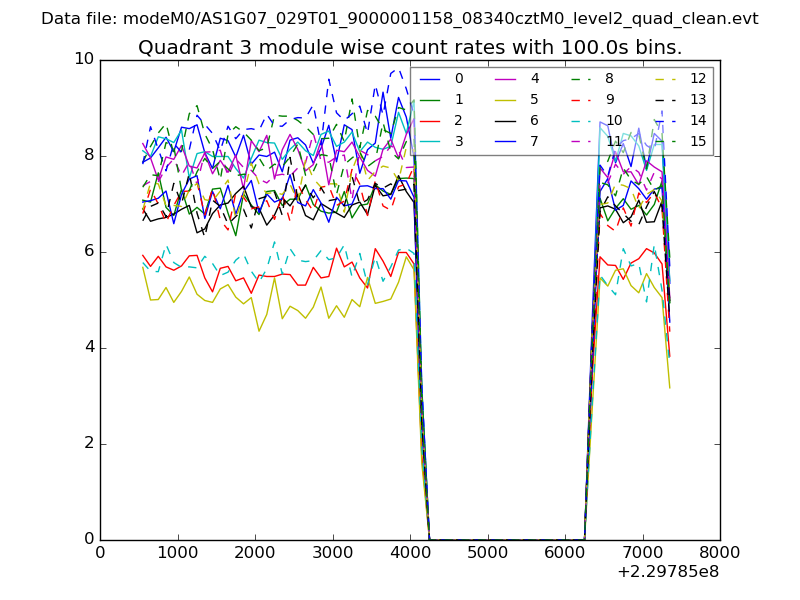
| Module-wise count rates for Quadrant A Data is divided into 100 sec bins |
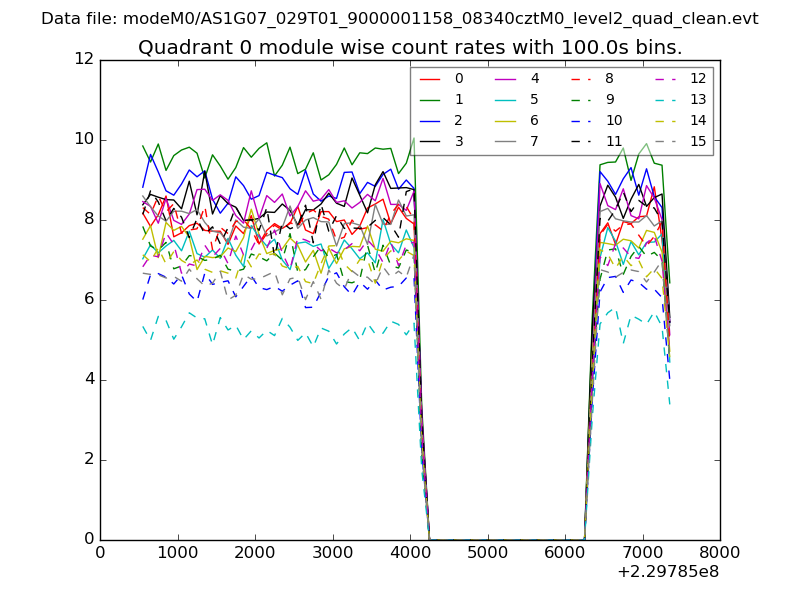 |
 |
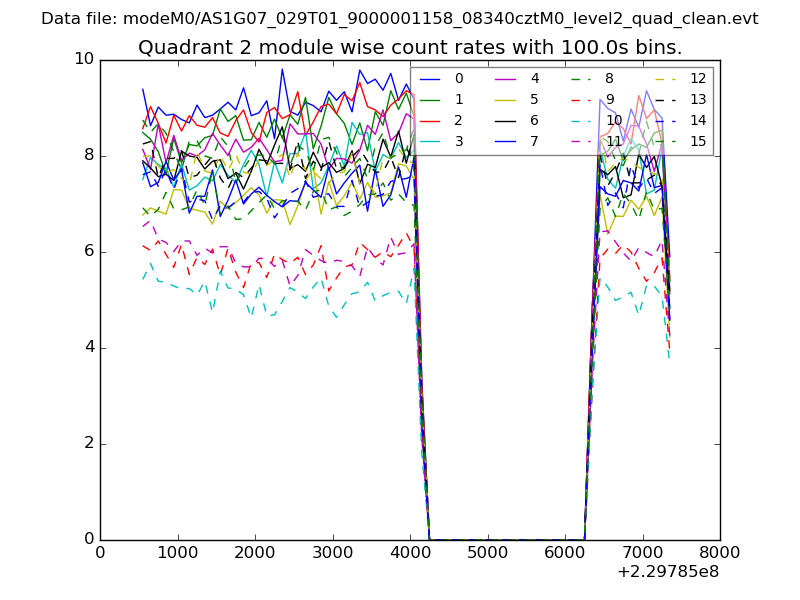
| Module-wise count rates for Quadrant B Data is divided into 100 sec bins |
 |
 |
| Module-wise count rates for Quadrant C Data is divided into 100 sec bins |
 |
 |
| Module-wise count rates for Quadrant D Data is divided into 100 sec bins |
 |
 |
| Parameter | Plot |
|---|---|
| CZT HV Monitor | 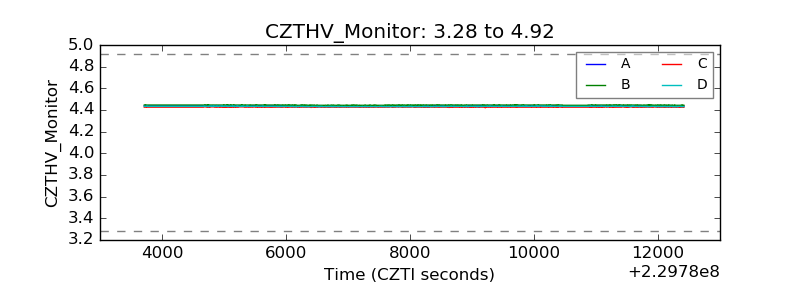 |
| D_VDD | 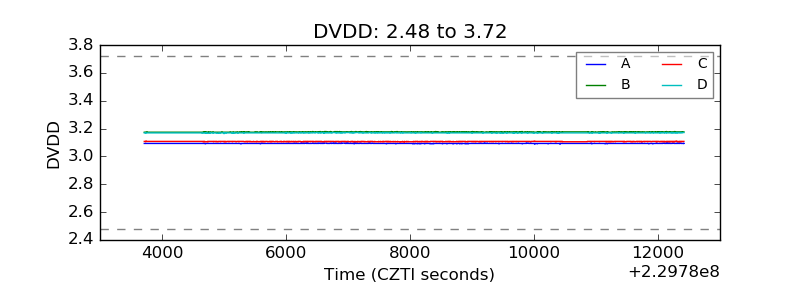 |
| Temperature 1 | 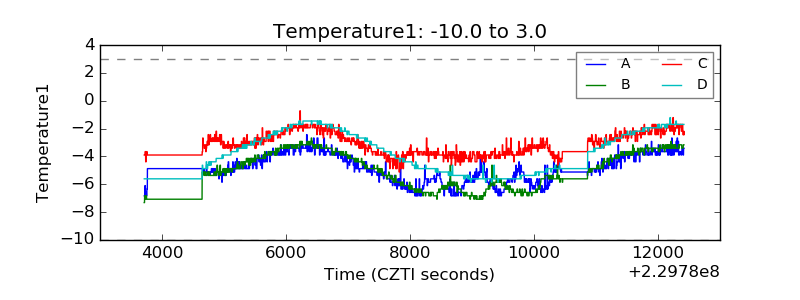 |
| Veto HV Monitor | 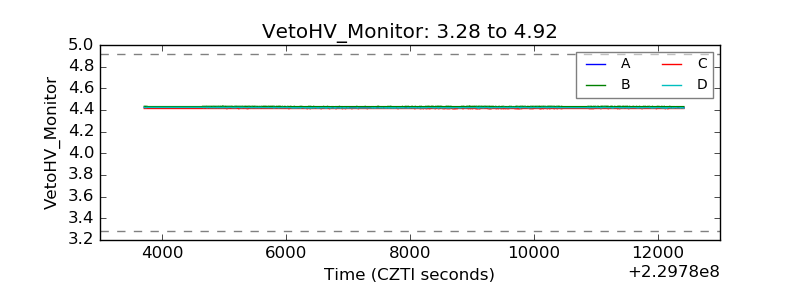 |
| Veto LLD | 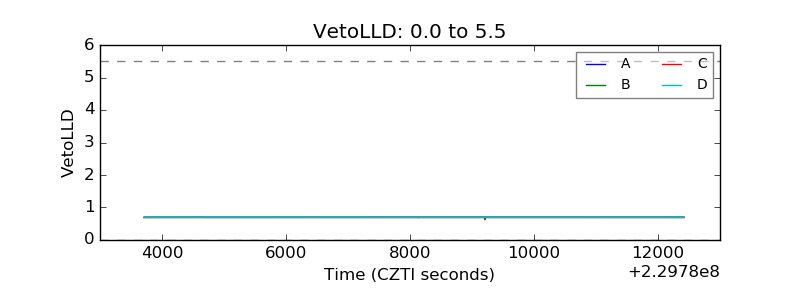 |
| Alpha Counter | 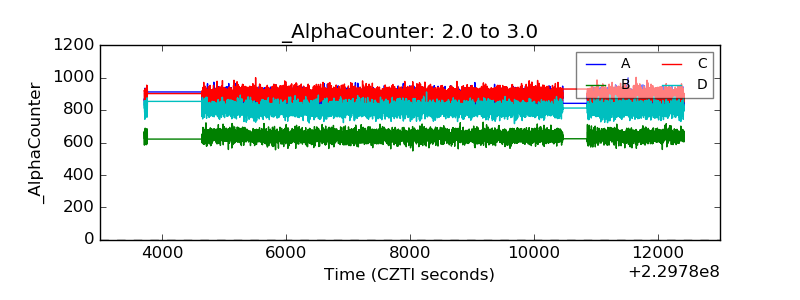 |
| _CPM_Rate | 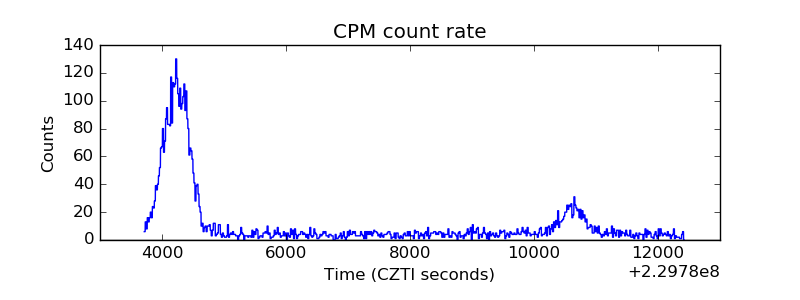 |
| CZT Counter | 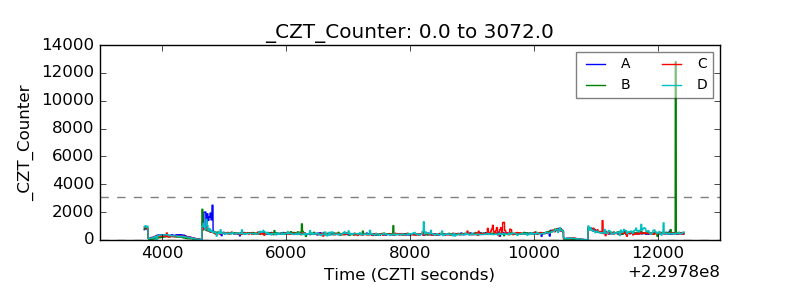 |
| +2.5 Volts monitor |  |
| +5 Volts monitor | 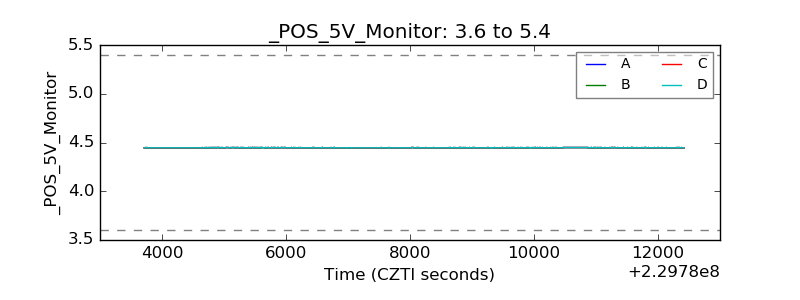 |
| _ROLL_ROT | 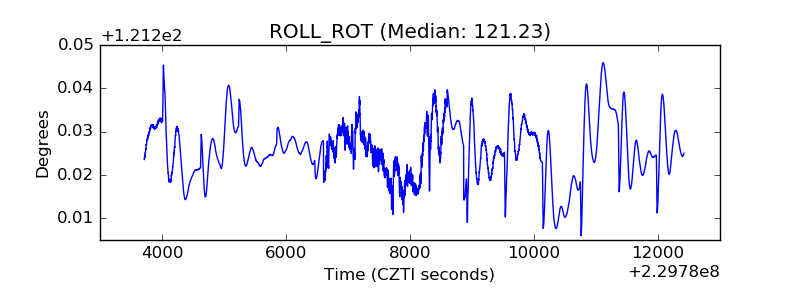 |
| _Roll_DEC | 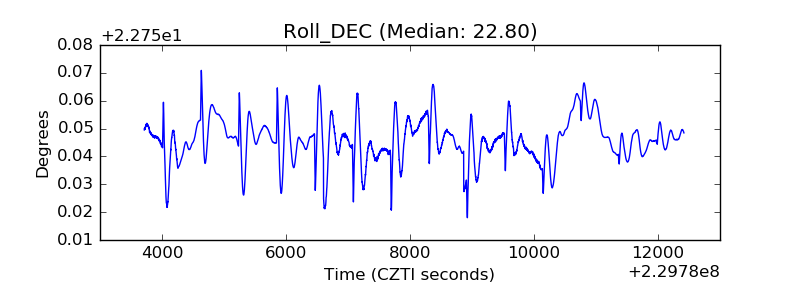 |
| _Roll_RA | 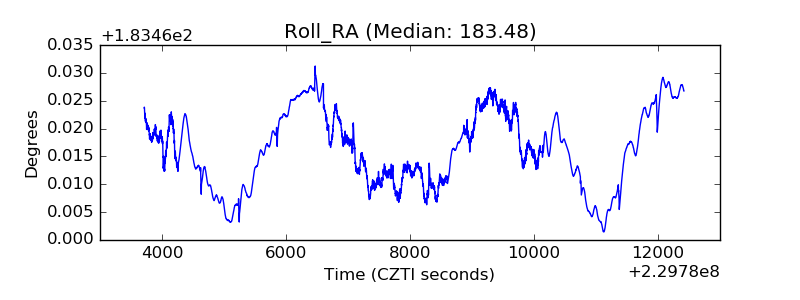 |
| Veto Counter | 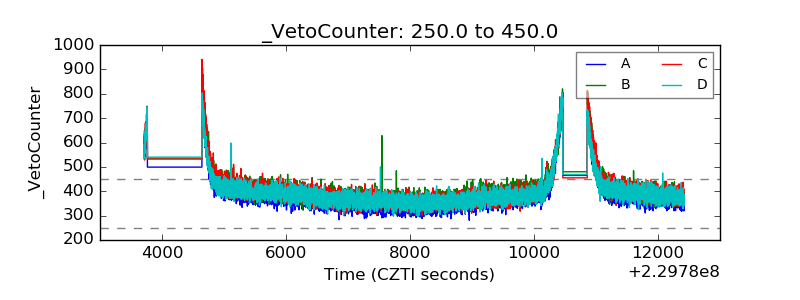 |