| Param | Original file | Final file |
|---|---|---|
| Filename | modeM0/AS1G07_029T01_9000001158_08341cztM0_level2.evt | modeM0/AS1G07_029T01_9000001158_08341cztM0_level2_quad_clean.evt |
| Size (bytes) | 474,451,200 | 92,545,920 |
| Size | 452.5 MB | 88.3 MB |
| Events in quadrant A | 3,339,620 | 585,774 |
| Events in quadrant B | 3,470,696 | 588,603 |
| Events in quadrant C | 3,603,328 | 574,978 |
| Events in quadrant D | 3,474,205 | 560,771 |
| Mode SS | |||
|---|---|---|---|
| Quadrant | BADHDUFLAG | Total packets | Discarded packets |
| A | 0 | 140 | 0 |
| B | 0 | 140 | 0 |
| C | 0 | 140 | 0 |
| D | 0 | 140 | 0 |
| Mode M0 | |||
|---|---|---|---|
| Quadrant | BADHDUFLAG | Total packets | Discarded packets |
| A | 0 | 14775 | 2 |
| B | 0 | 15014 | 1 |
| C | 0 | 15613 | 1 |
| D | 0 | 15298 | 1 |
| Quadrant | Total seconds | Saturated seconds | Saturation percentage |
|---|---|---|---|
| A | 7077 | 154 | 2.176063% |
| B | 7077 | 193 | 2.727144% |
| C | 7077 | 161 | 2.274975% |
| D | 7077 | 111 | 1.568461% |
Noise dominated data is calculated using 1-second bins in cleaned event files. If a bin has >2000 counts, and if more than 50% of those come from <1% of pixels, then it is considered to be noise-dominated and hence unusable.
| Quadrant | # 1 sec bins | Bins with >0 counts | Bins with >2000 counts | High rate bins dominated by noise | Noise dominated (total time) | Noise dominated (detector-on time) | Marked lightcurve |
|---|---|---|---|---|---|---|---|
| A | 7092 | 7078 | 0 | 0 | 0.00% | 0.00% | 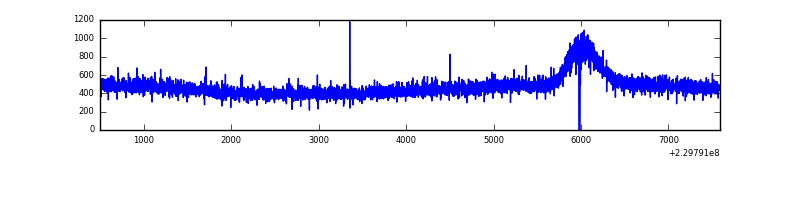 |
| B | 7092 | 7078 | 0 | 0 | 0.00% | 0.00% | 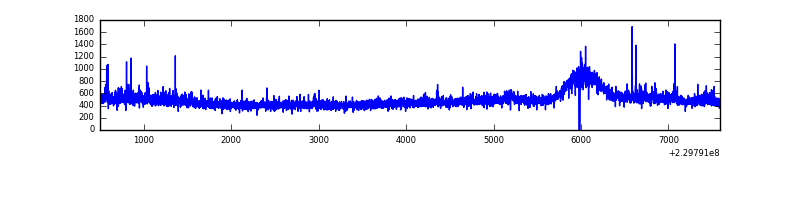 |
| C | 7092 | 7078 | 58 | 58 | 0.82% | 0.82% | 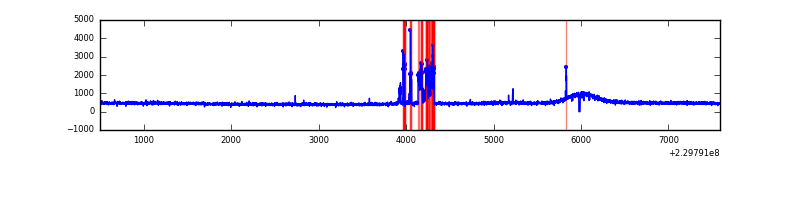 |
| D | 7092 | 7078 | 7 | 7 | 0.10% | 0.10% | 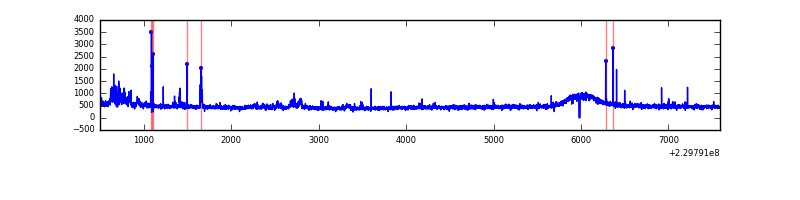 |
Top three noisy pixels from each quadrant. If the there are fewer than three noisy pixels in the level2.evt file, extra rows are filled as -1
| Pixel properties | Quadrant properties | ||||||
|---|---|---|---|---|---|---|---|
| Quadrant | DetID | PixID | Counts | Sigma | Mean | Median | Sigma |
| A | 0 | 226 | 8183 | 41.25 | 868 | 848 | 177.8 |
| A | 12 | 194 | 7970 | 40.05 | 868 | 848 | 177.8 |
| A | 3 | 137 | 3557 | 15.23 | 868 | 848 | 177.8 |
| B | 0 | 214 | 72271 | 424.0 | 866 | 845 | 168.5 |
| B | 12 | 111 | 19150 | 108.66 | 866 | 845 | 168.5 |
| B | 11 | 111 | 15678 | 88.05 | 866 | 845 | 168.5 |
| C | 9 | 54 | 308133 | 1552.08 | 843 | 846 | 198.0 |
| C | 13 | 61 | 6362 | 27.86 | 843 | 846 | 198.0 |
| C | 8 | 128 | 4443 | 18.17 | 843 | 846 | 198.0 |
| D | 12 | 221 | 144798 | 703.29 | 844 | 822 | 204.7 |
| D | 2 | 14 | 34277 | 163.42 | 844 | 822 | 204.7 |
| D | 1 | 7 | 27143 | 128.57 | 844 | 822 | 204.7 |
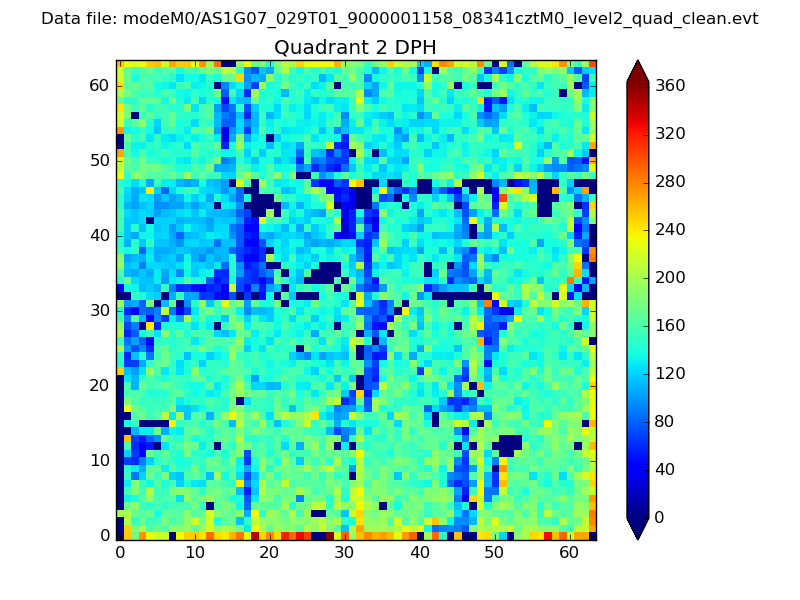
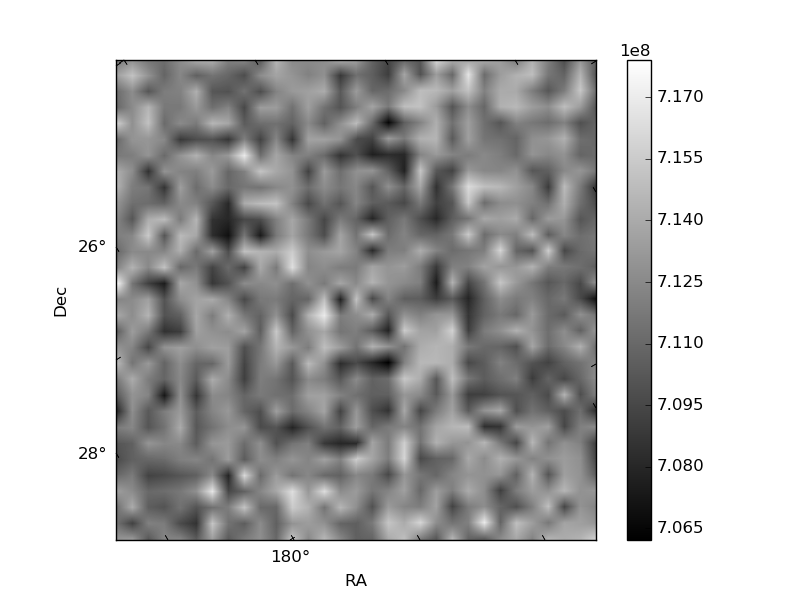
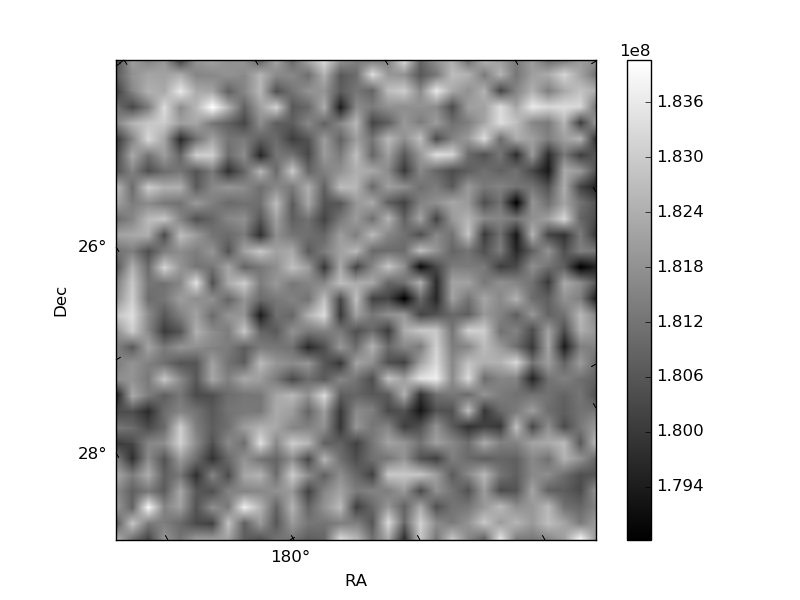
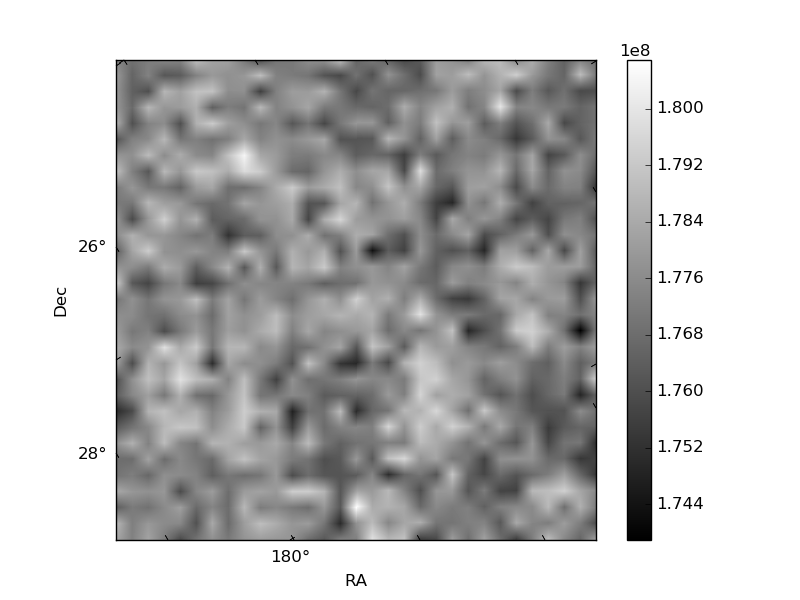
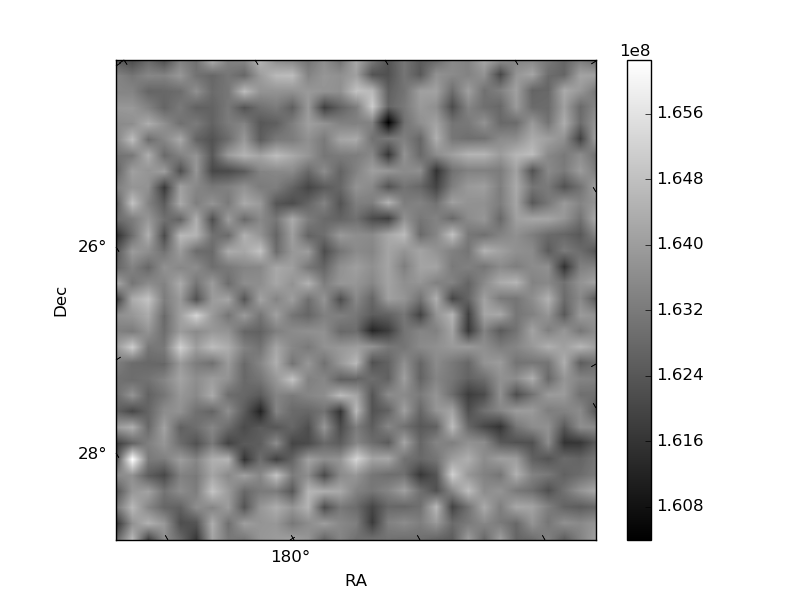
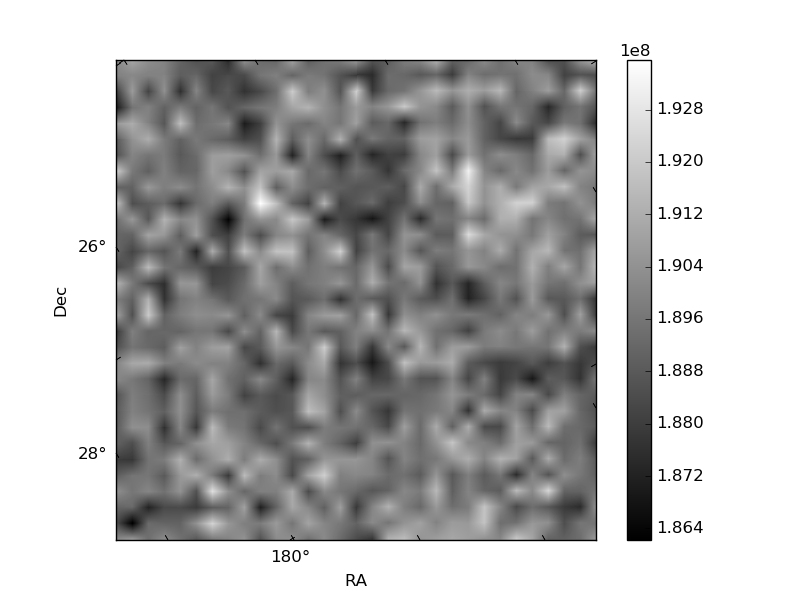
Histogram calculated using DETX and DETY for each event in the final _common_clean file
| Quadrant A | 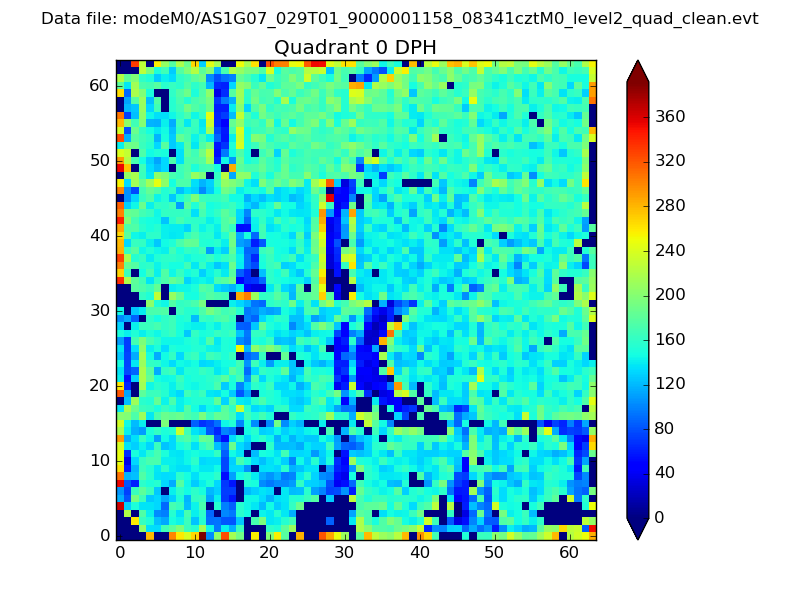 |
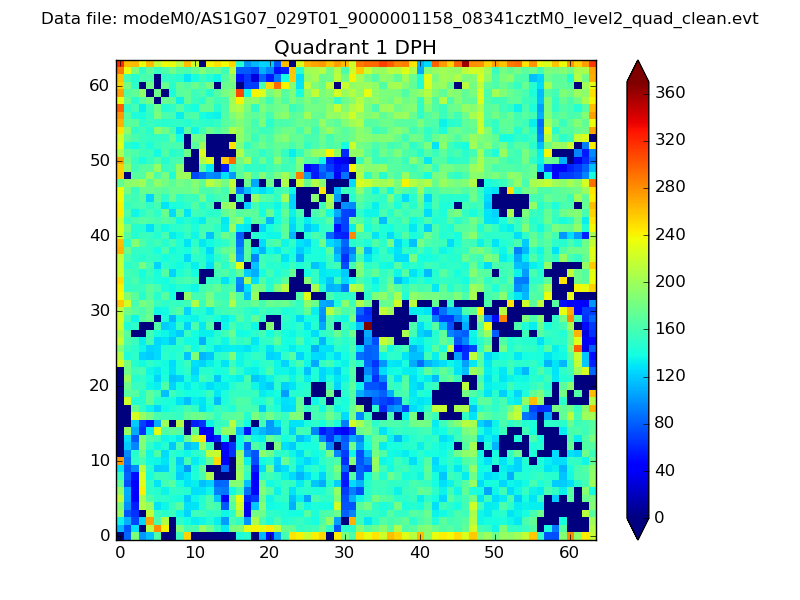 |
Quadrant B |
|---|---|---|---|
| Quadrant D | 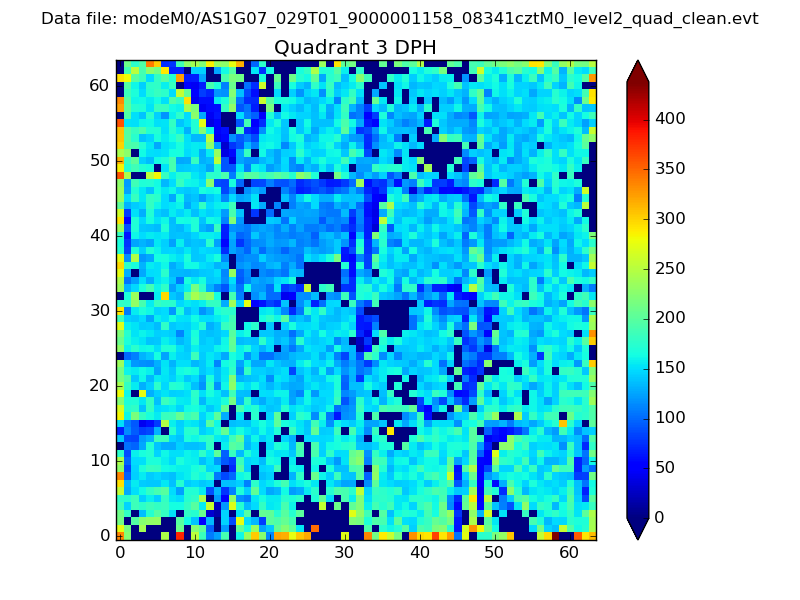 |
 |
Quadrant C |
| Plot type | Count rate plots | Images |
|---|---|---|
| Comparison with Poisson distribution Blue bars denote a histogram of data divided into 1 sec bins. Red curve is a Poisson curve with rate = median count rate of data. |
 |
 |
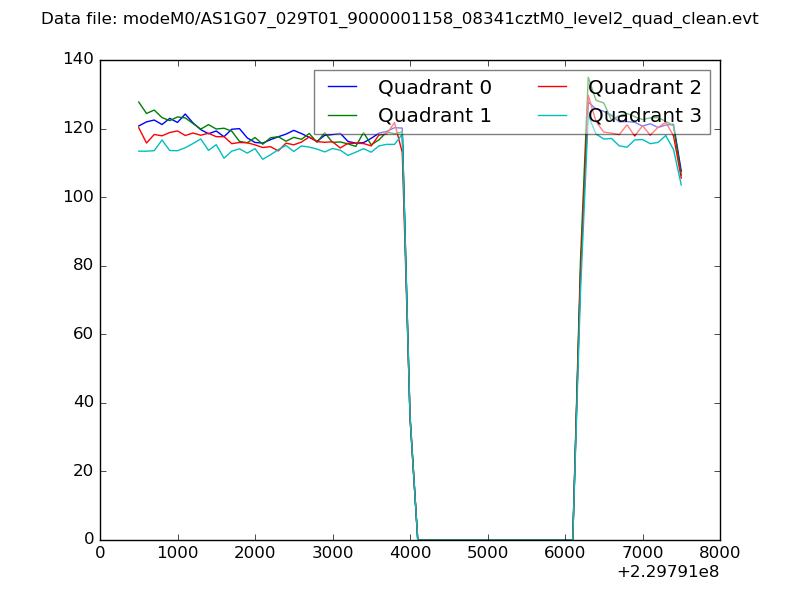
| Quadrant-wise count rates Data is divided into 100 sec bins |
 |
|
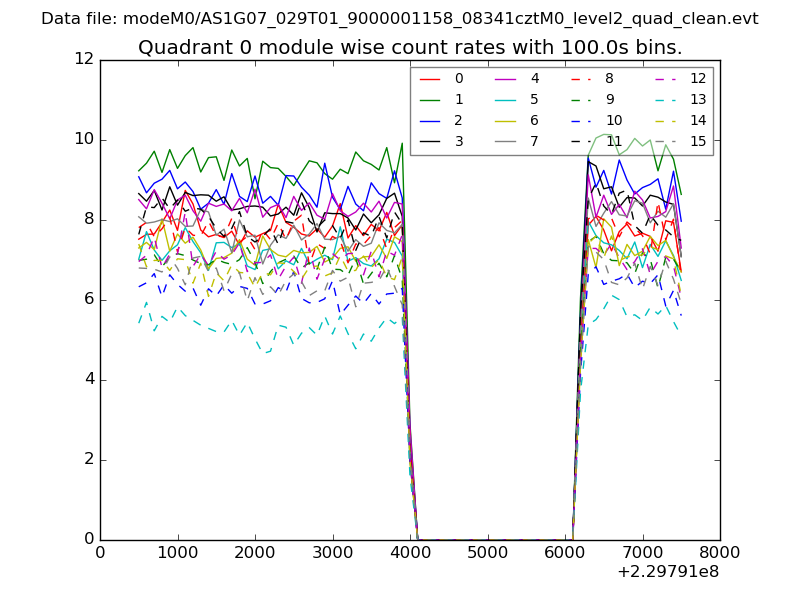
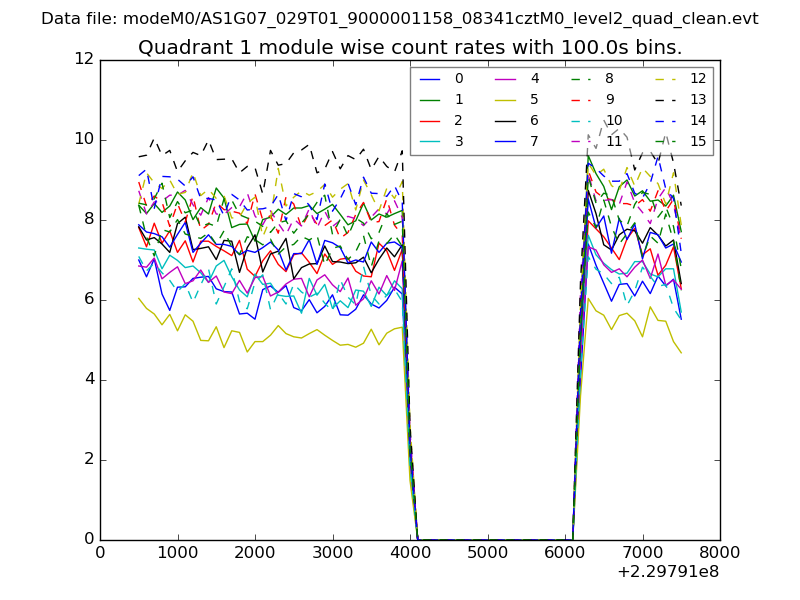
| Module-wise count rates for Quadrant A Data is divided into 100 sec bins |
 |
 |
| Module-wise count rates for Quadrant B Data is divided into 100 sec bins |
 |
 |
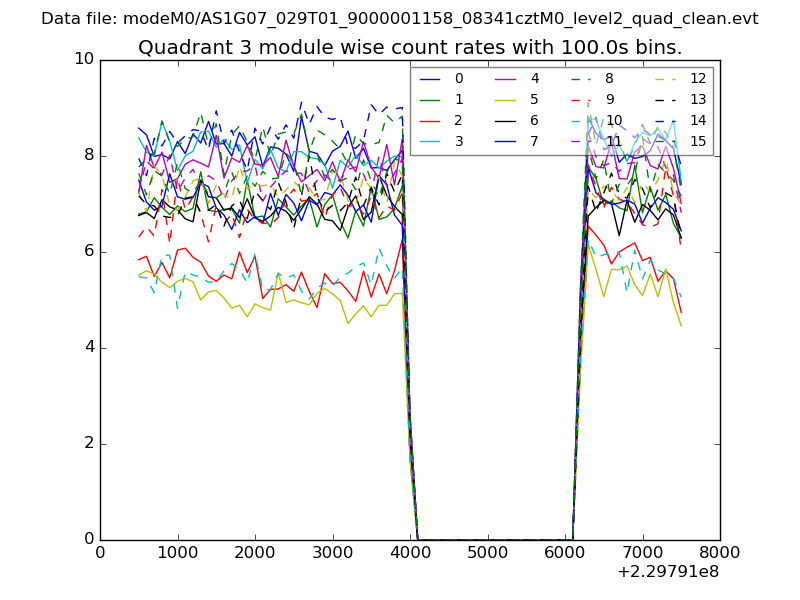
| Module-wise count rates for Quadrant C Data is divided into 100 sec bins |
 |
 |
| Module-wise count rates for Quadrant D Data is divided into 100 sec bins |
 |
 |
| Parameter | Plot |
|---|---|
| CZT HV Monitor | 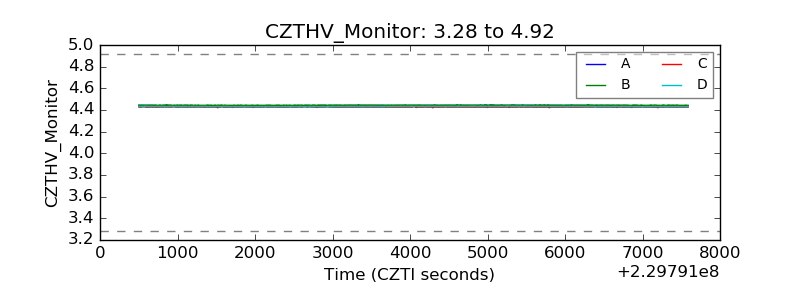 |
| D_VDD | 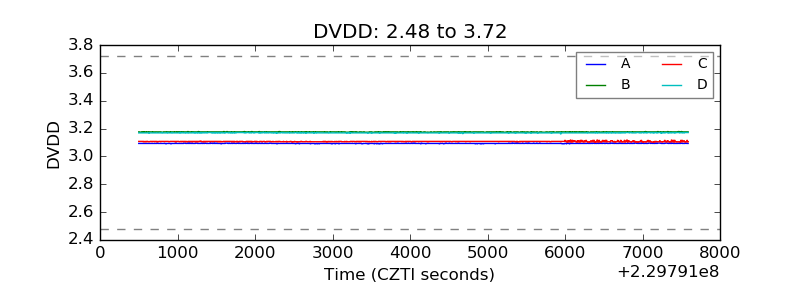 |
| Temperature 1 | 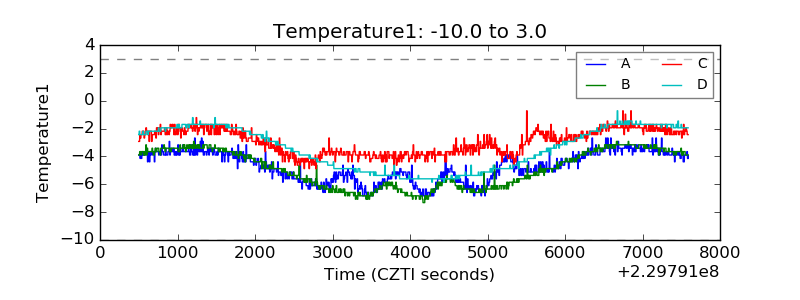 |
| Veto HV Monitor | 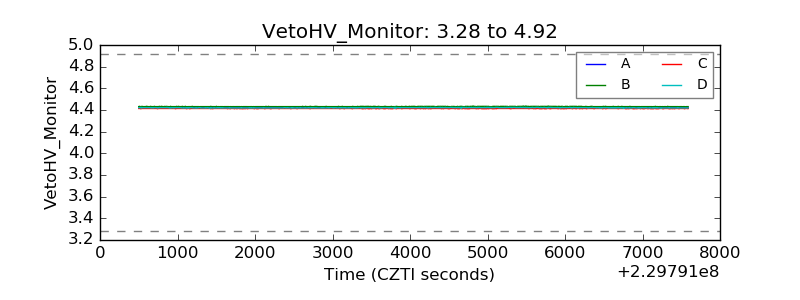 |
| Veto LLD | 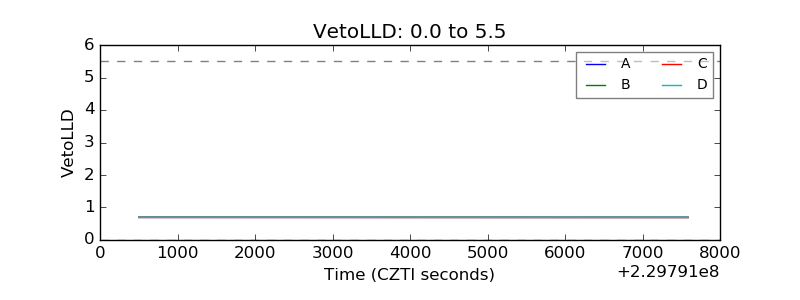 |
| Alpha Counter | 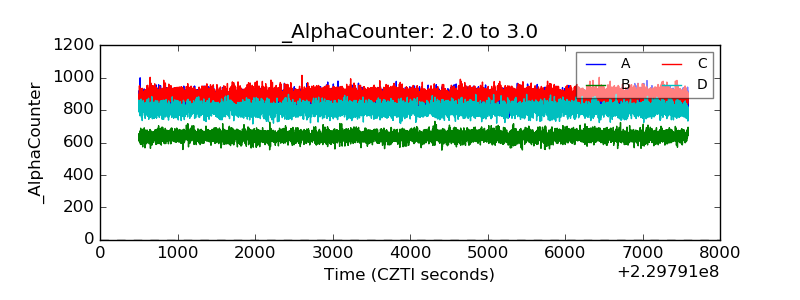 |
| _CPM_Rate | 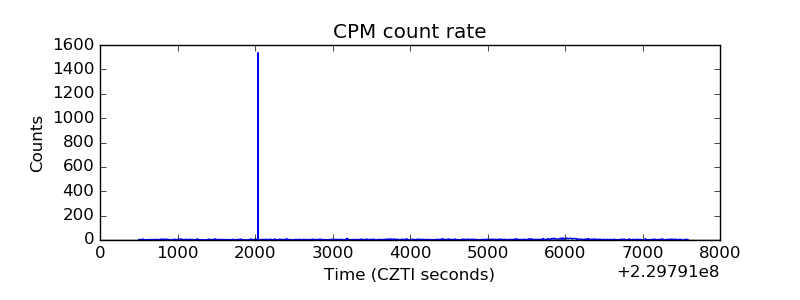 |
| CZT Counter | 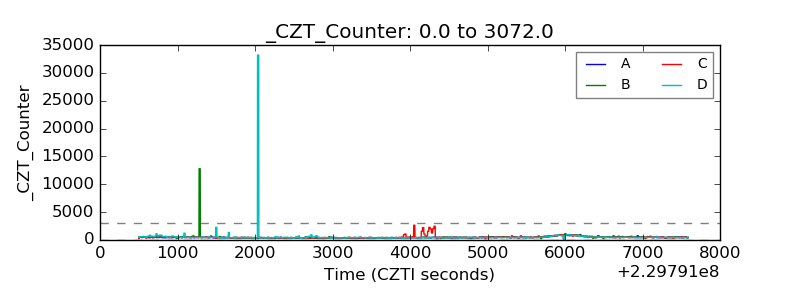 |
| +2.5 Volts monitor |  |
| +5 Volts monitor |  |
| _ROLL_ROT | 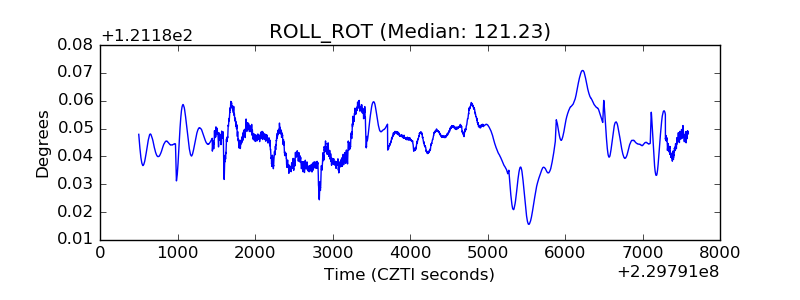 |
| _Roll_DEC | 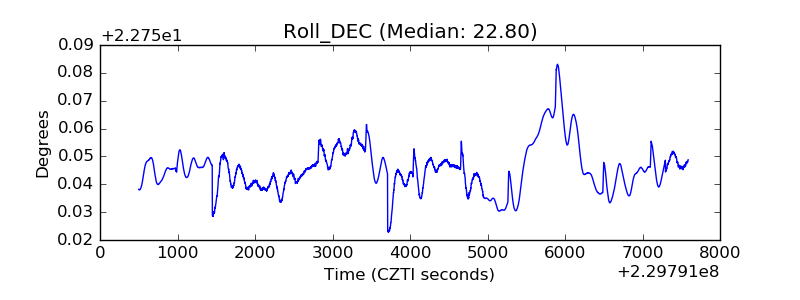 |
| _Roll_RA | 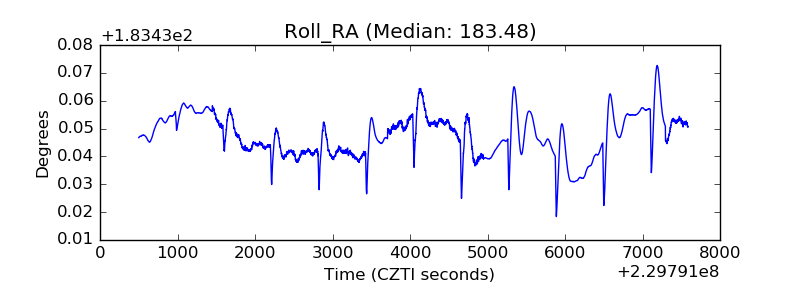 |
| Veto Counter |  |