| Param | Original file | Final file |
|---|---|---|
| Filename | modeM0/AS1G07_029T01_9000001158_08342cztM0_level2.evt | modeM0/AS1G07_029T01_9000001158_08342cztM0_level2_quad_clean.evt |
| Size (bytes) | 511,885,440 | 105,356,160 |
| Size | 488.2 MB | 100.5 MB |
| Events in quadrant A | 3,660,491 | 667,398 |
| Events in quadrant B | 3,915,491 | 674,028 |
| Events in quadrant C | 3,712,077 | 663,241 |
| Events in quadrant D | 3,685,508 | 644,767 |
| Mode SS | |||
|---|---|---|---|
| Quadrant | BADHDUFLAG | Total packets | Discarded packets |
| A | 0 | 158 | 0 |
| B | 0 | 158 | 0 |
| C | 0 | 158 | 0 |
| D | 0 | 158 | 0 |
| Mode M0 | |||
|---|---|---|---|
| Quadrant | BADHDUFLAG | Total packets | Discarded packets |
| A | 0 | 16281 | 2 |
| B | 0 | 16766 | 1 |
| C | 0 | 16437 | 1 |
| D | 0 | 16518 | 1 |
| Mode M9 | |||
|---|---|---|---|
| Quadrant | BADHDUFLAG | Total packets | Discarded packets |
| A | 0 | 1 | 0 |
| B | 0 | 1 | 0 |
| C | 0 | 1 | 0 |
| D | 0 | 1 | 0 |
| Quadrant | Total seconds | Saturated seconds | Saturation percentage |
|---|---|---|---|
| A | 7780 | 162 | 2.082262% |
| B | 7780 | 191 | 2.455013% |
| C | 7780 | 122 | 1.568123% |
| D | 7780 | 120 | 1.542416% |
Noise dominated data is calculated using 1-second bins in cleaned event files. If a bin has >2000 counts, and if more than 50% of those come from <1% of pixels, then it is considered to be noise-dominated and hence unusable.
| Quadrant | # 1 sec bins | Bins with >0 counts | Bins with >2000 counts | High rate bins dominated by noise | Noise dominated (total time) | Noise dominated (detector-on time) | Marked lightcurve |
|---|---|---|---|---|---|---|---|
| A | 7875 | 7781 | 0 | 0 | 0.00% | 0.00% | 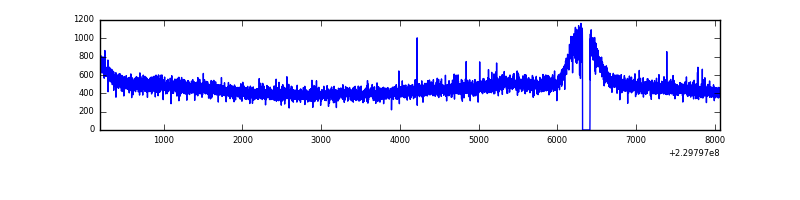 |
| B | 7875 | 7781 | 3 | 3 | 0.04% | 0.04% | 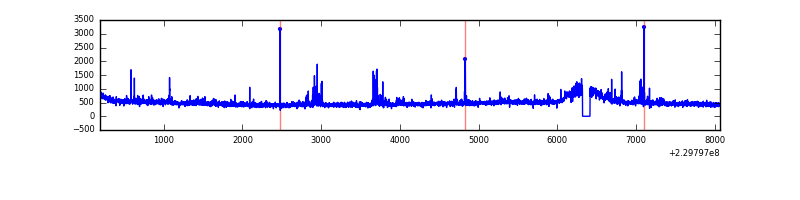 |
| C | 7875 | 7781 | 7 | 7 | 0.09% | 0.09% | 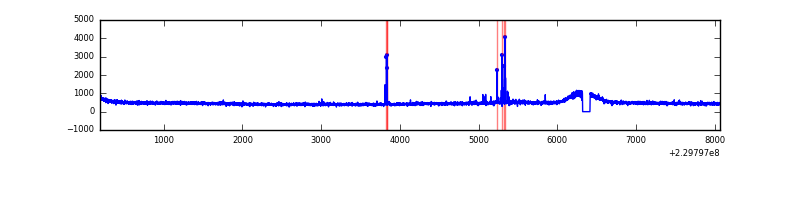 |
| D | 7875 | 7781 | 10 | 10 | 0.13% | 0.13% | 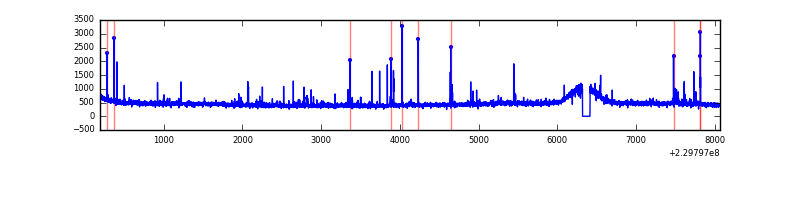 |
Top three noisy pixels from each quadrant. If the there are fewer than three noisy pixels in the level2.evt file, extra rows are filled as -1
| Pixel properties | Quadrant properties | ||||||
|---|---|---|---|---|---|---|---|
| Quadrant | DetID | PixID | Counts | Sigma | Mean | Median | Sigma |
| A | 0 | 226 | 8805 | 40.28 | 952 | 931 | 195.5 |
| A | 12 | 194 | 8588 | 39.17 | 952 | 931 | 195.5 |
| A | 3 | 137 | 3855 | 14.96 | 952 | 931 | 195.5 |
| B | 0 | 214 | 86183 | 462.76 | 949 | 925 | 184.2 |
| B | 4 | 80 | 79108 | 424.36 | 949 | 925 | 184.2 |
| B | 4 | 81 | 39618 | 210.02 | 949 | 925 | 184.2 |
| C | 9 | 54 | 69851 | 317.34 | 928 | 933 | 217.2 |
| C | 8 | 128 | 14074 | 60.51 | 928 | 933 | 217.2 |
| C | 8 | 112 | 7173 | 28.73 | 928 | 933 | 217.2 |
| D | 2 | 14 | 84078 | 369.3 | 927 | 901 | 225.2 |
| D | 13 | 105 | 55934 | 244.35 | 927 | 901 | 225.2 |
| D | 2 | 234 | 29084 | 125.13 | 927 | 901 | 225.2 |
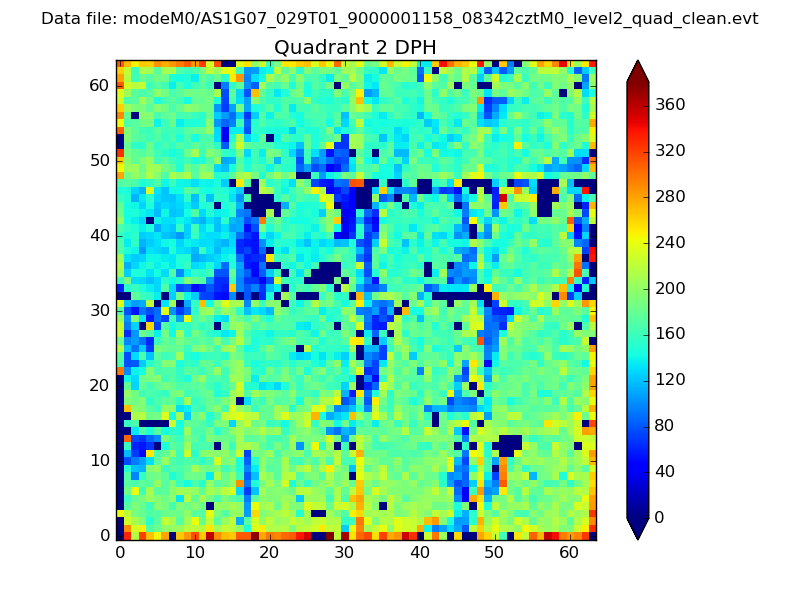
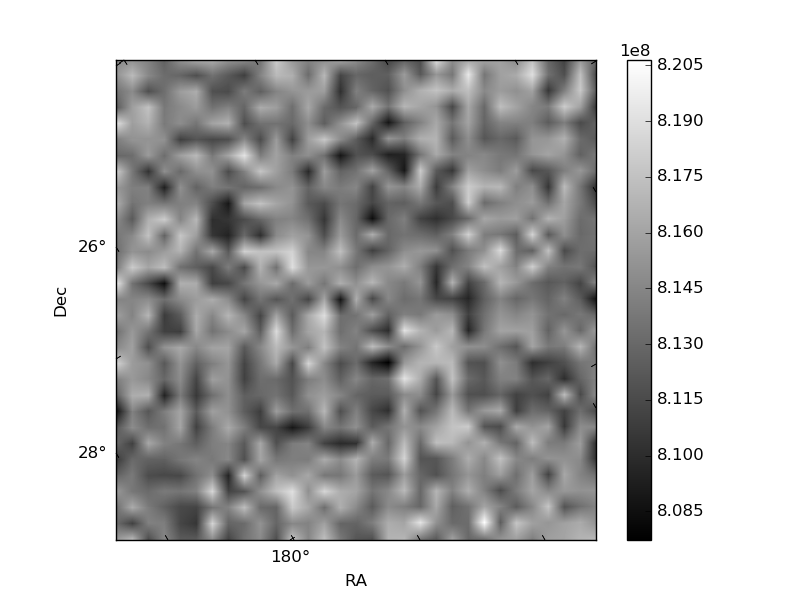
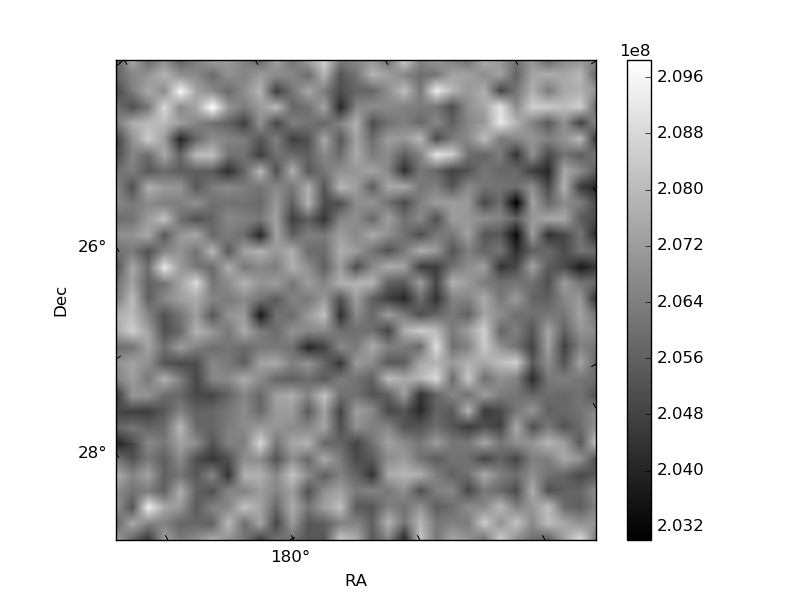
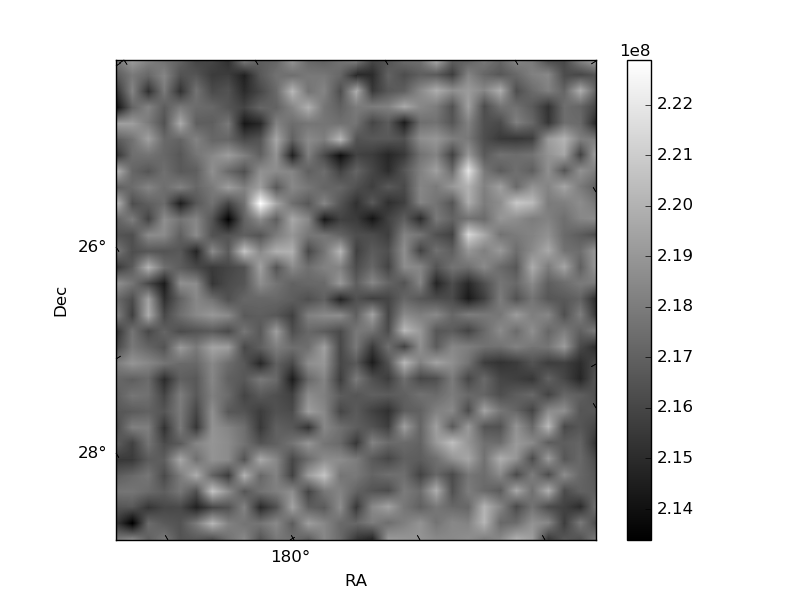
Histogram calculated using DETX and DETY for each event in the final _common_clean file
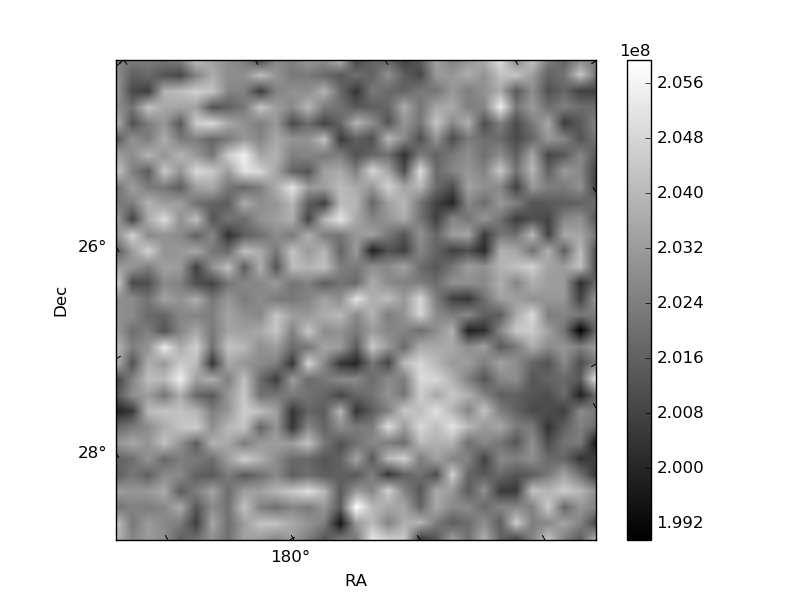
| Quadrant A | 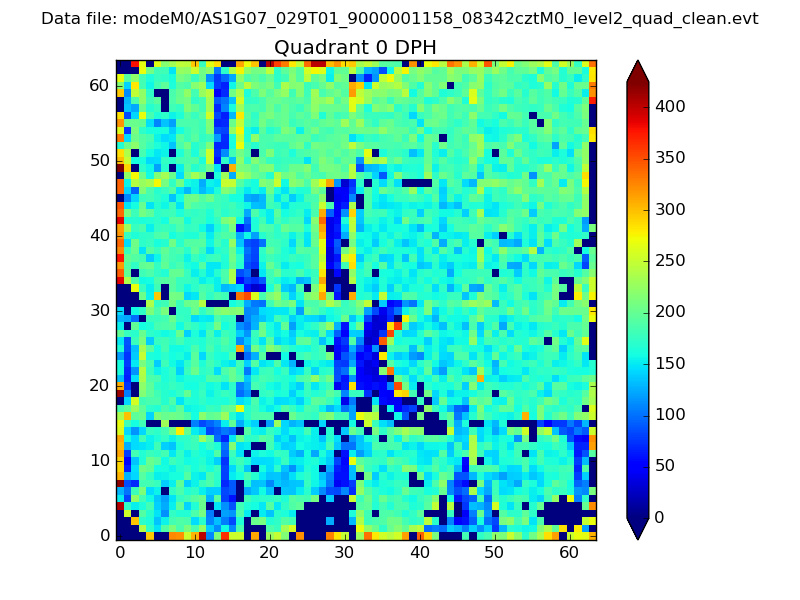 |
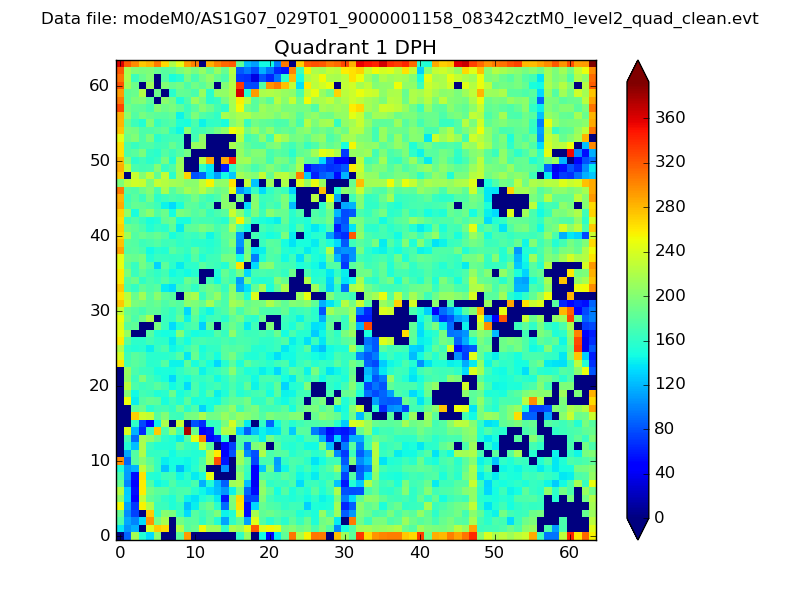 |
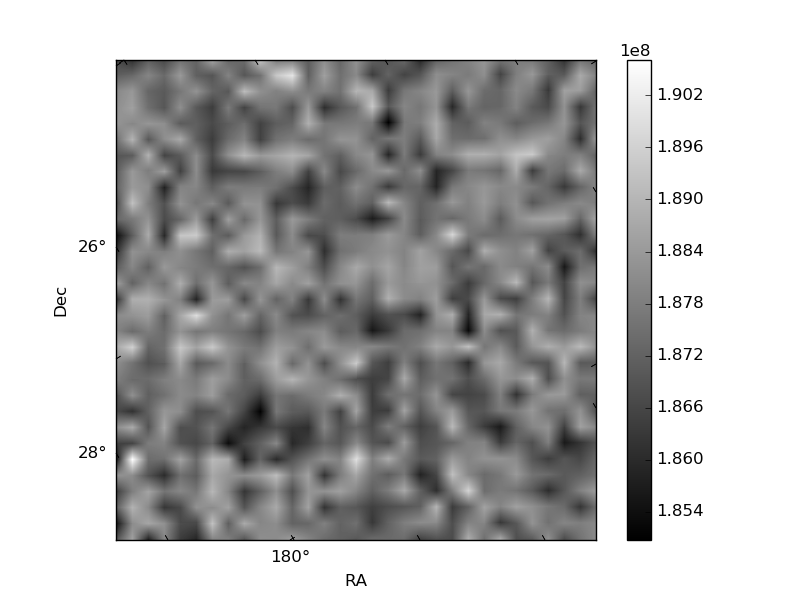
Quadrant B |
|---|---|---|---|
| Quadrant D | 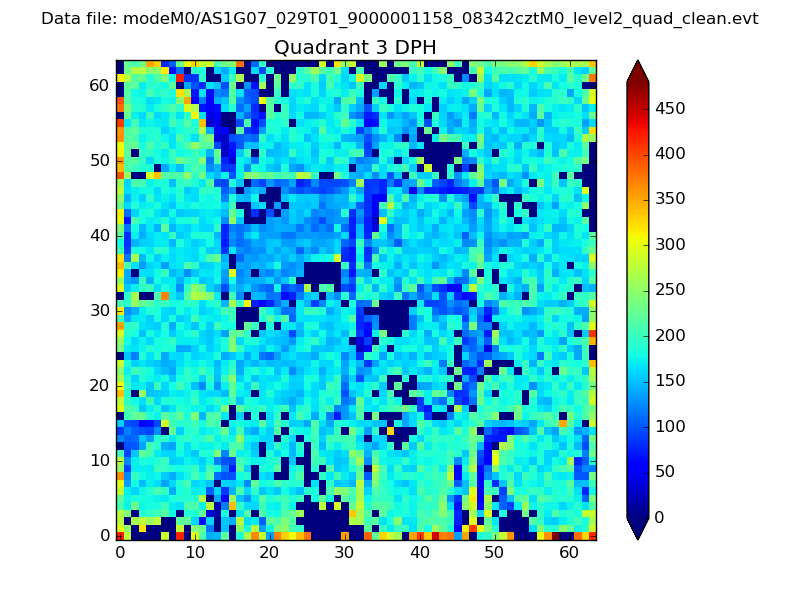 |
 |
Quadrant C |
| Plot type | Count rate plots | Images |
|---|---|---|
| Comparison with Poisson distribution Blue bars denote a histogram of data divided into 1 sec bins. Red curve is a Poisson curve with rate = median count rate of data. |
 |
 |
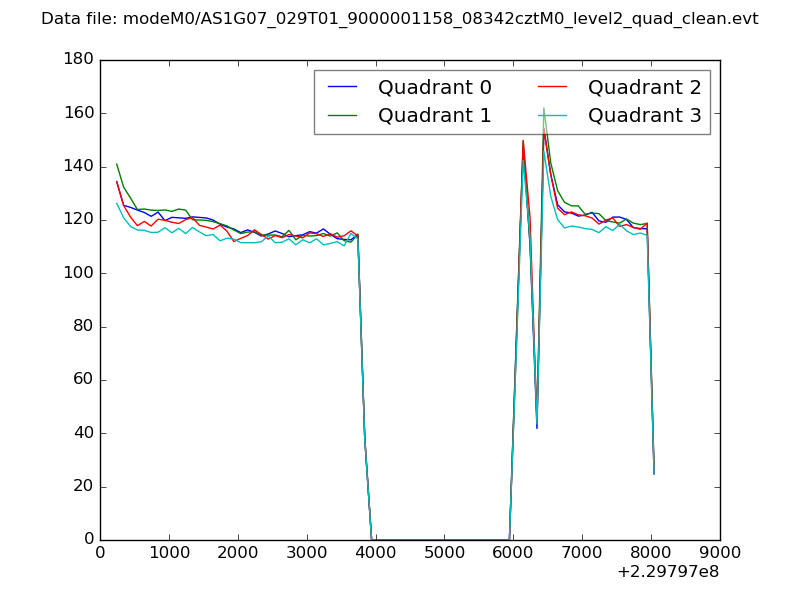
| Quadrant-wise count rates Data is divided into 100 sec bins |
 |
|
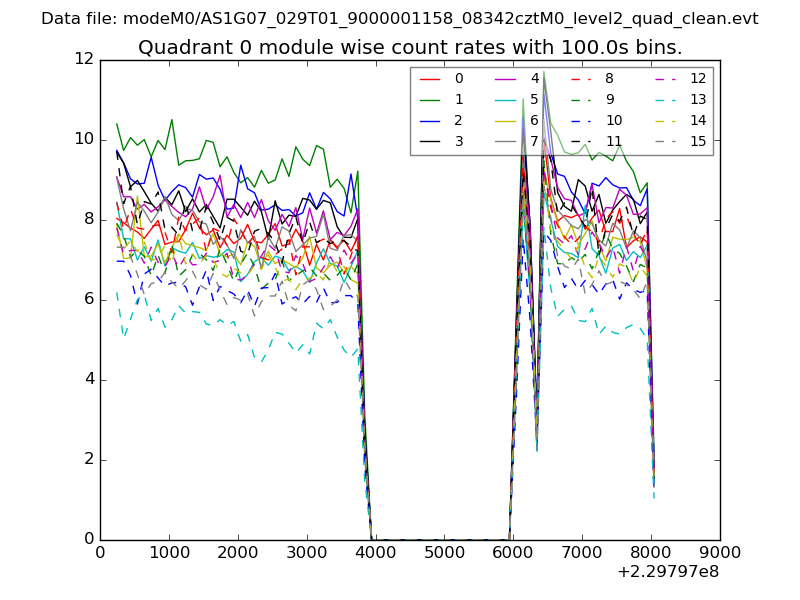
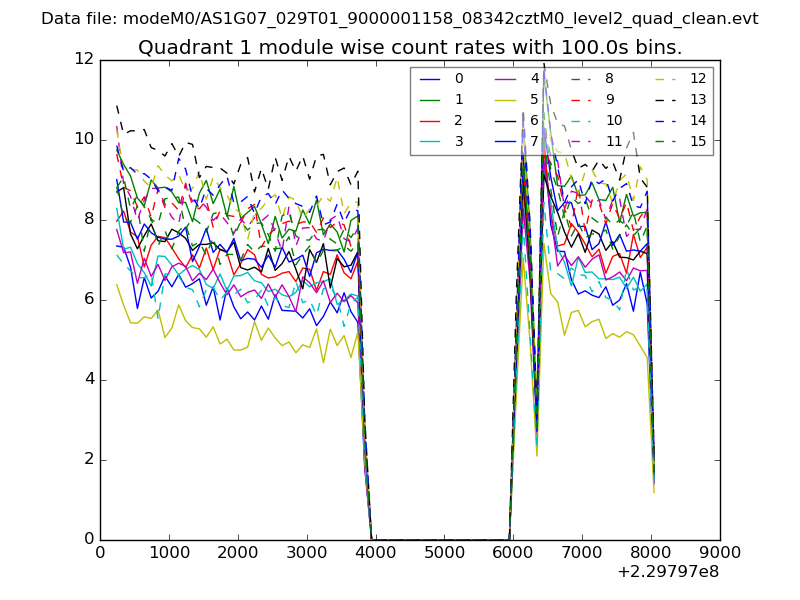
| Module-wise count rates for Quadrant A Data is divided into 100 sec bins |
 |
 |
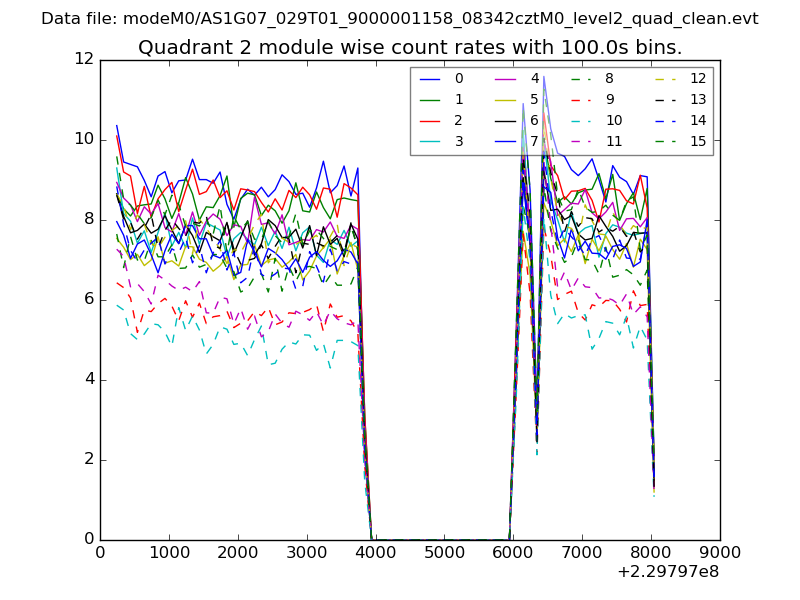
| Module-wise count rates for Quadrant B Data is divided into 100 sec bins |
 |
 |
| Module-wise count rates for Quadrant C Data is divided into 100 sec bins |
 |
 |
| Module-wise count rates for Quadrant D Data is divided into 100 sec bins |
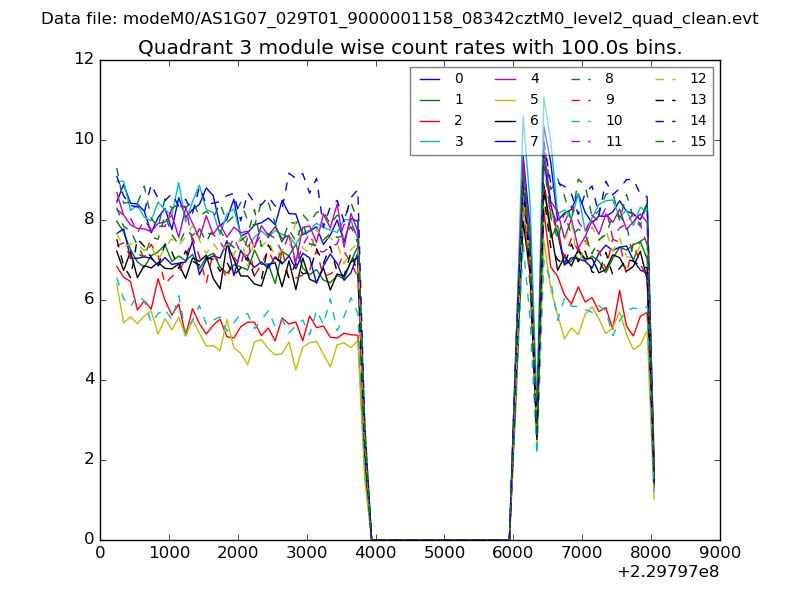 |
 |
| Parameter | Plot |
|---|---|
| CZT HV Monitor | 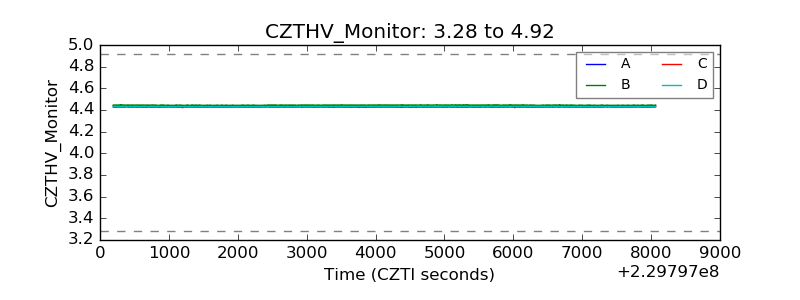 |
| D_VDD | 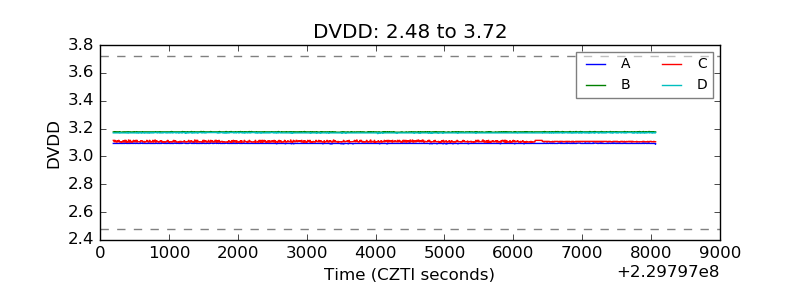 |
| Temperature 1 |  |
| Veto HV Monitor | 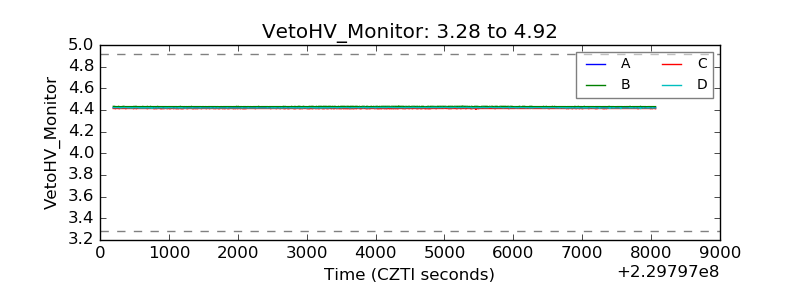 |
| Veto LLD | 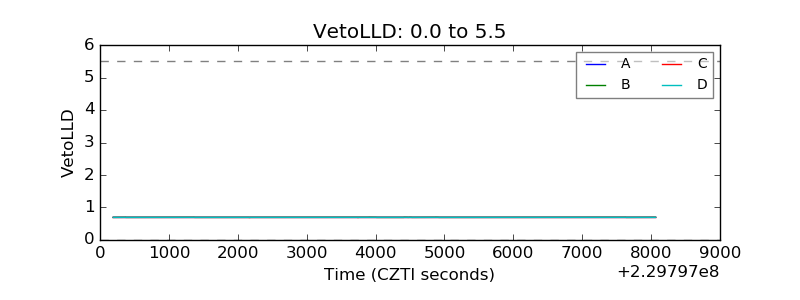 |
| Alpha Counter | 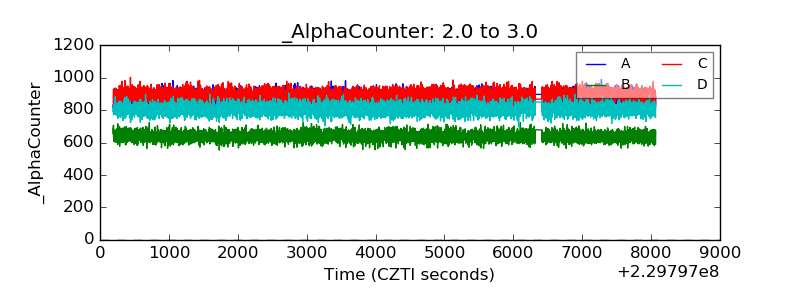 |
| _CPM_Rate | 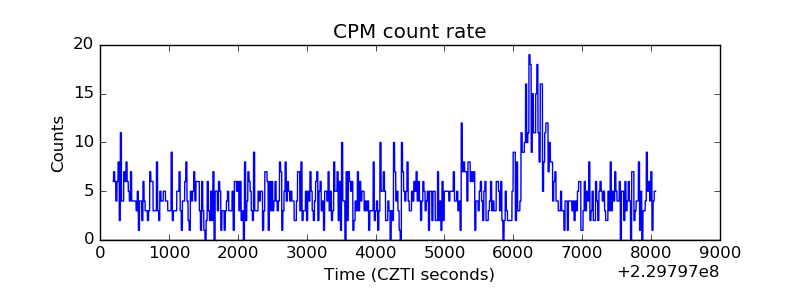 |
| CZT Counter | 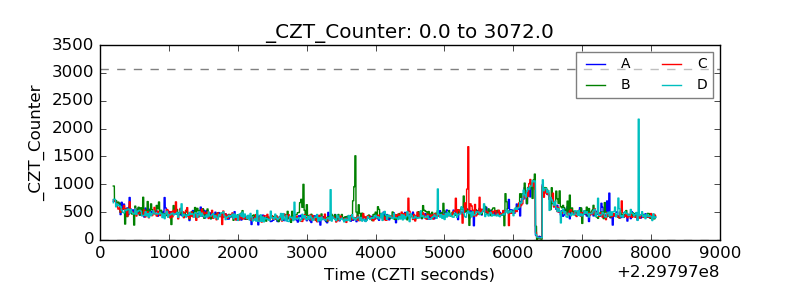 |
| +2.5 Volts monitor |  |
| +5 Volts monitor |  |
| _ROLL_ROT | 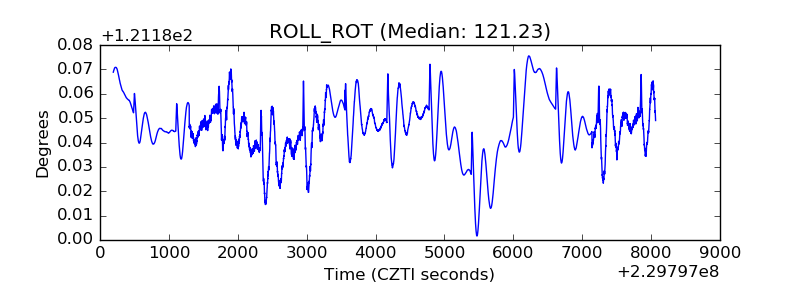 |
| _Roll_DEC | 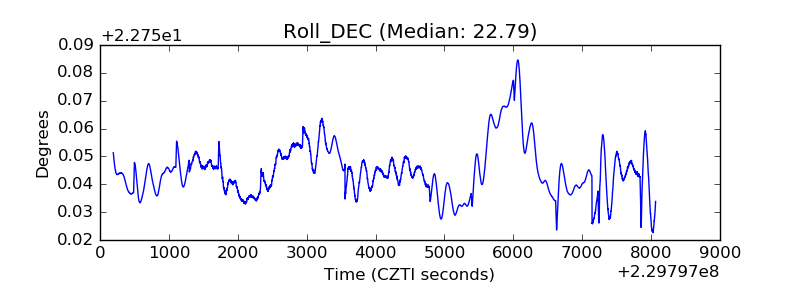 |
| _Roll_RA | 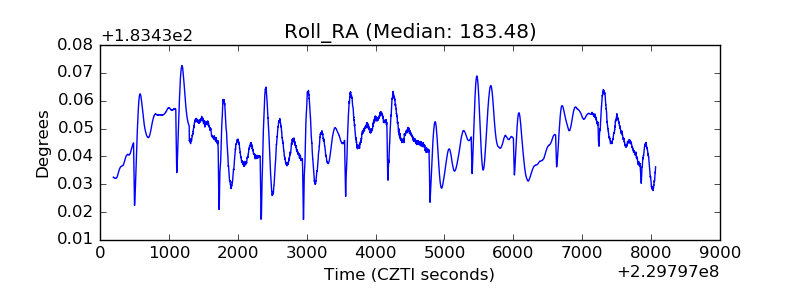 |
| Veto Counter | 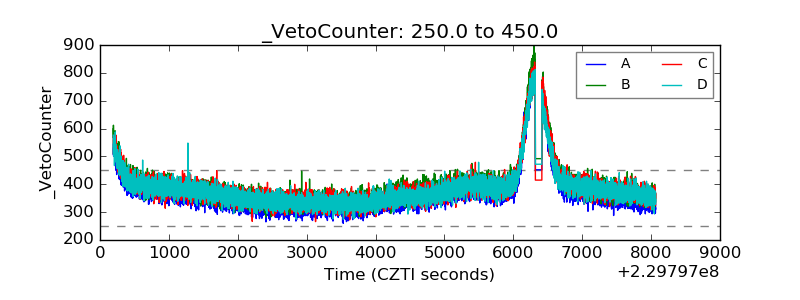 |