| Param | Original file | Final file |
|---|---|---|
| Filename | modeM0/AS1G07_029T01_9000001158_08346cztM0_level2.evt | modeM0/AS1G07_029T01_9000001158_08346cztM0_level2_quad_clean.evt |
| Size (bytes) | 1,500,212,160 | 288,740,160 |
| Size | 1.4 GB | 275.4 MB |
| Events in quadrant A | 10,785,329 | 1,788,134 |
| Events in quadrant B | 11,278,118 | 1,806,886 |
| Events in quadrant C | 10,600,857 | 1,783,804 |
| Events in quadrant D | 11,157,006 | 1,726,329 |
| Mode SS | |||
|---|---|---|---|
| Quadrant | BADHDUFLAG | Total packets | Discarded packets |
| A | 0 | 484 | 0 |
| B | 0 | 484 | 0 |
| C | 0 | 484 | 0 |
| D | 0 | 484 | 0 |
| Mode M0 | |||
|---|---|---|---|
| Quadrant | BADHDUFLAG | Total packets | Discarded packets |
| A | 0 | 48853 | 5 |
| B | 0 | 49807 | 4 |
| C | 0 | 48586 | 4 |
| D | 0 | 50664 | 4 |
| Mode M9 | |||
|---|---|---|---|
| Quadrant | BADHDUFLAG | Total packets | Discarded packets |
| A | 0 | 28 | 0 |
| B | 0 | 28 | 0 |
| C | 0 | 28 | 0 |
| D | 0 | 28 | 0 |
| Quadrant | Total seconds | Saturated seconds | Saturation percentage |
|---|---|---|---|
| A | 23840 | 152 | 0.637584% |
| B | 23840 | 208 | 0.872483% |
| C | 23840 | 105 | 0.440436% |
| D | 23840 | 276 | 1.157718% |
Noise dominated data is calculated using 1-second bins in cleaned event files. If a bin has >2000 counts, and if more than 50% of those come from <1% of pixels, then it is considered to be noise-dominated and hence unusable.
| Quadrant | # 1 sec bins | Bins with >0 counts | Bins with >2000 counts | High rate bins dominated by noise | Noise dominated (total time) | Noise dominated (detector-on time) | Marked lightcurve |
|---|---|---|---|---|---|---|---|
| A | 26655 | 23844 | 5 | 5 | 0.02% | 0.02% | 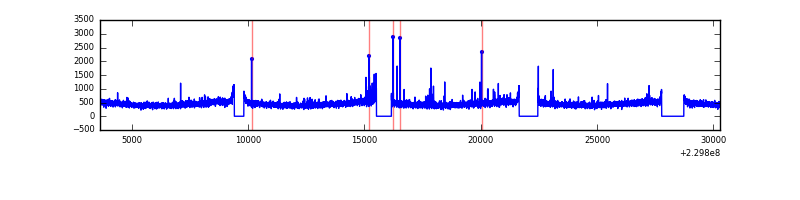 |
| B | 26655 | 23844 | 29 | 29 | 0.11% | 0.12% | 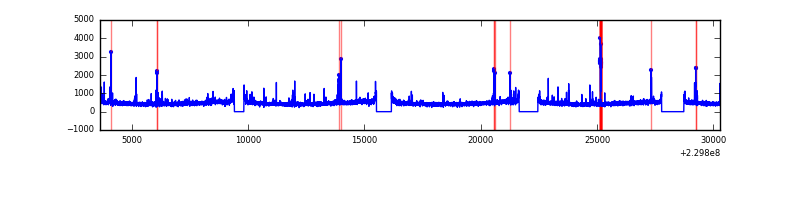 |
| C | 26655 | 23844 | 16 | 16 | 0.06% | 0.07% | 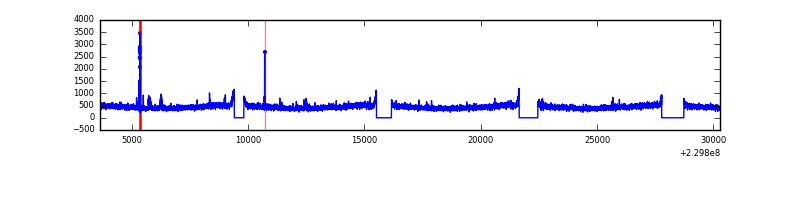 |
| D | 26655 | 23844 | 174 | 174 | 0.65% | 0.73% |  |
Top three noisy pixels from each quadrant. If the there are fewer than three noisy pixels in the level2.evt file, extra rows are filled as -1
| Pixel properties | Quadrant properties | ||||||
|---|---|---|---|---|---|---|---|
| Quadrant | DetID | PixID | Counts | Sigma | Mean | Median | Sigma |
| A | 15 | 239 | 126919 | 222.92 | 2762 | 2702 | 557.2 |
| A | 15 | 236 | 30121 | 49.21 | 2762 | 2702 | 557.2 |
| A | 0 | 226 | 25588 | 41.07 | 2762 | 2702 | 557.2 |
| B | 4 | 81 | 189875 | 353.4 | 2772 | 2702 | 529.6 |
| B | 0 | 214 | 111359 | 205.16 | 2772 | 2702 | 529.6 |
| B | 4 | 80 | 105601 | 194.28 | 2772 | 2702 | 529.6 |
| C | 9 | 54 | 103136 | 160.99 | 2692 | 2706 | 623.8 |
| C | 13 | 61 | 20489 | 28.51 | 2692 | 2706 | 623.8 |
| C | 3 | 202 | 6574 | 6.2 | 2692 | 2706 | 623.8 |
| D | 2 | 14 | 808598 | 1258.0 | 2668 | 2602 | 640.7 |
| D | 7 | 71 | 90185 | 136.7 | 2668 | 2602 | 640.7 |
| D | 2 | 234 | 83729 | 126.62 | 2668 | 2602 | 640.7 |
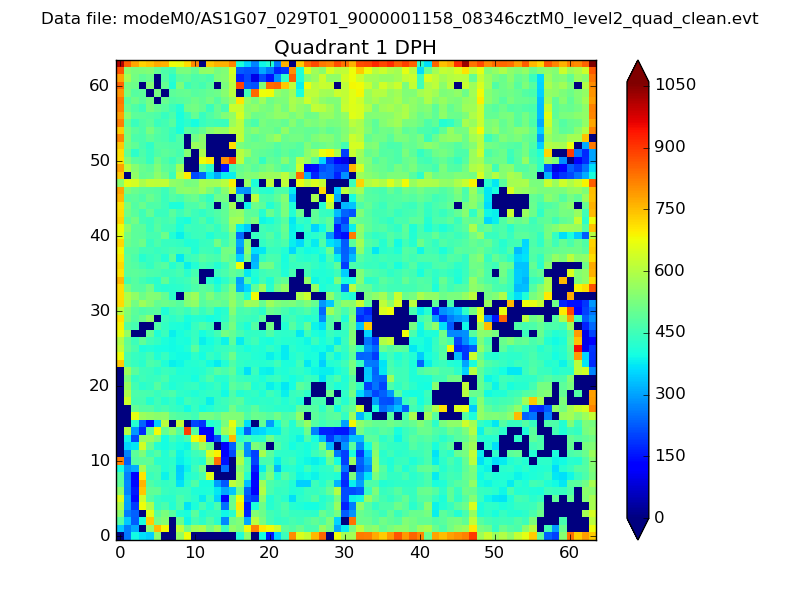
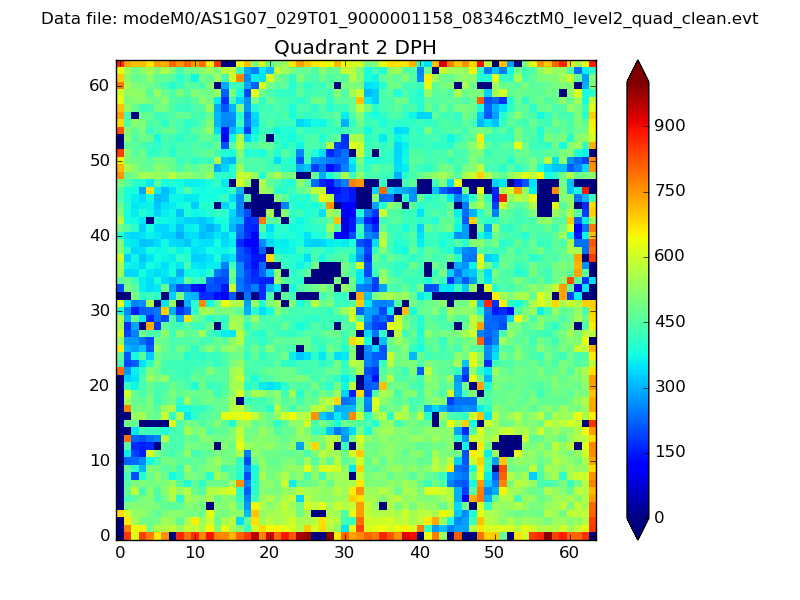
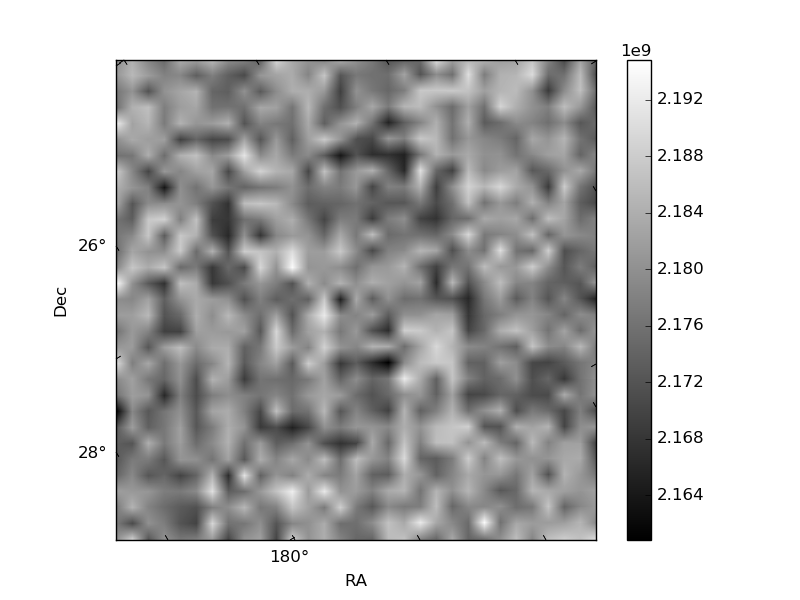
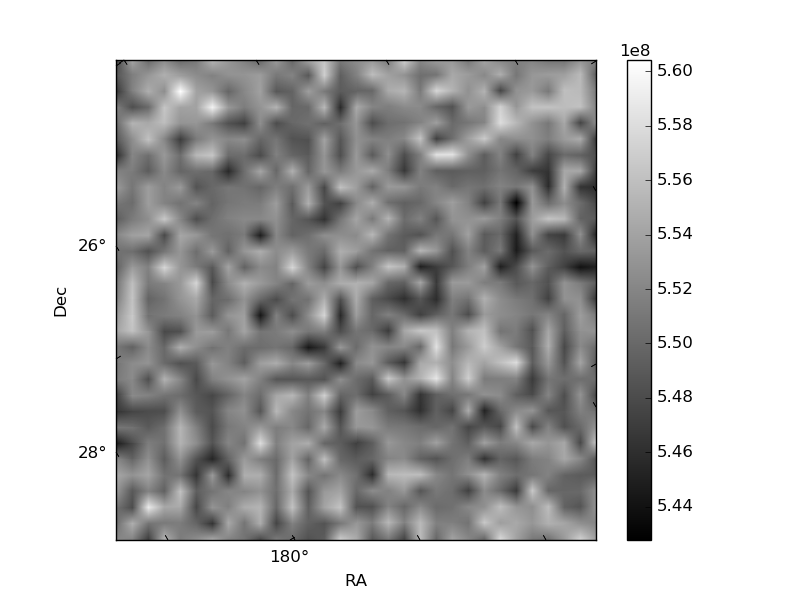
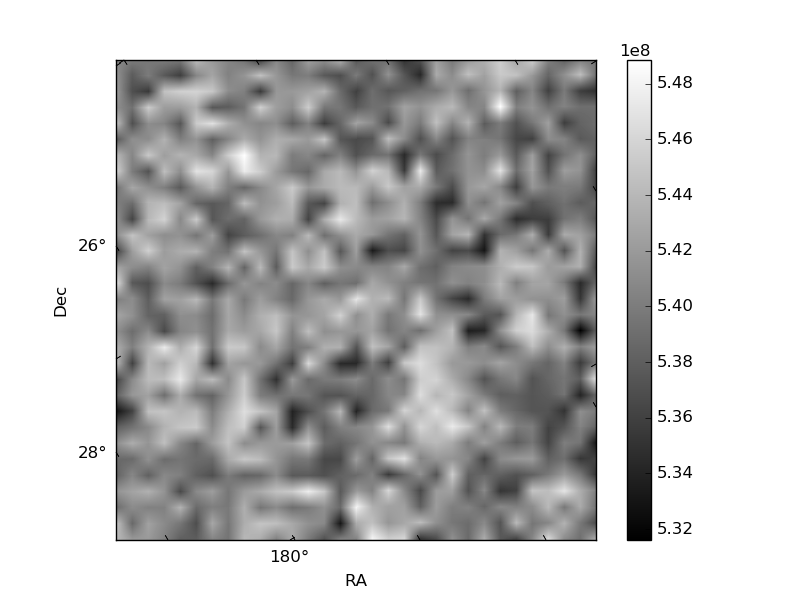
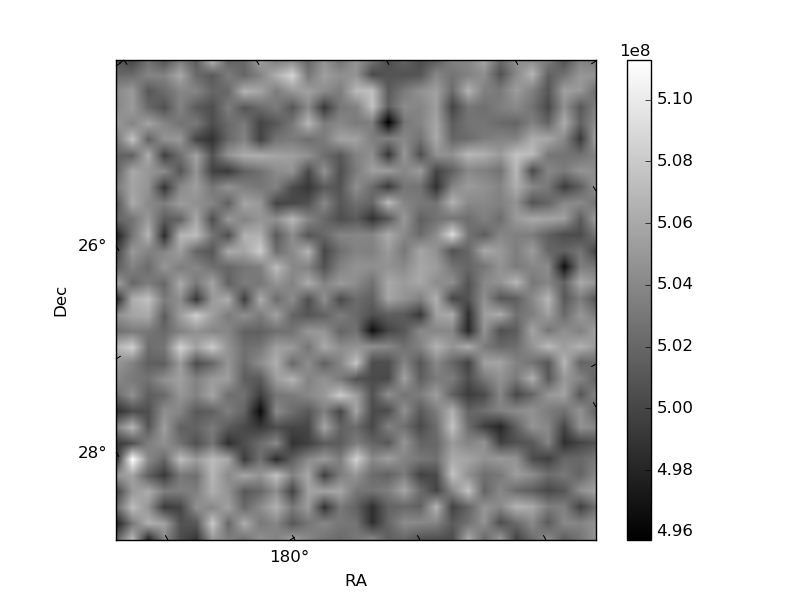
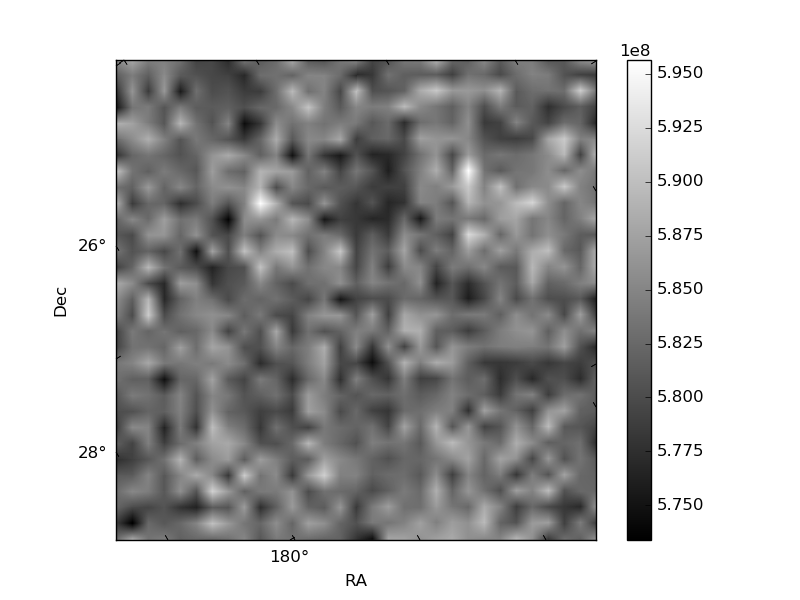
Histogram calculated using DETX and DETY for each event in the final _common_clean file
| Quadrant A | 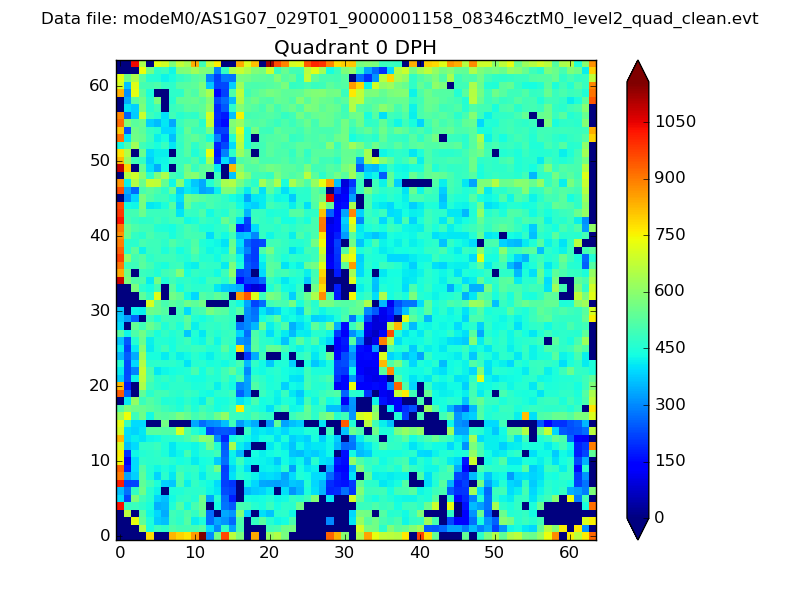 |
 |
Quadrant B |
|---|---|---|---|
| Quadrant D | 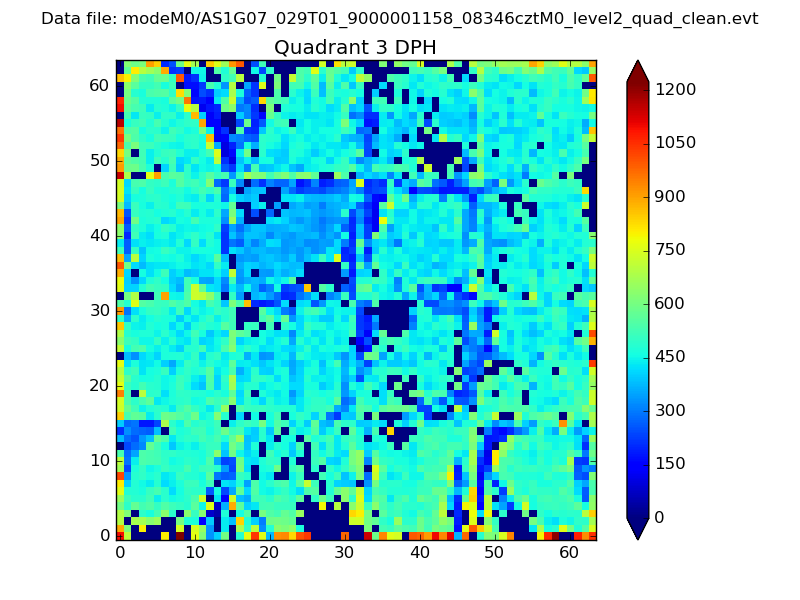 |
 |
Quadrant C |
| Plot type | Count rate plots | Images |
|---|---|---|
| Comparison with Poisson distribution Blue bars denote a histogram of data divided into 1 sec bins. Red curve is a Poisson curve with rate = median count rate of data. |
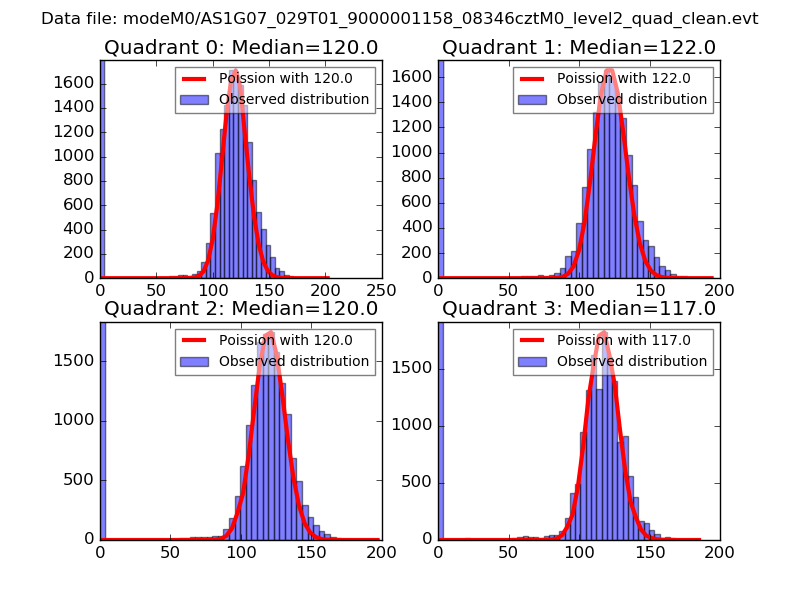 |
 |
| Quadrant-wise count rates Data is divided into 100 sec bins |
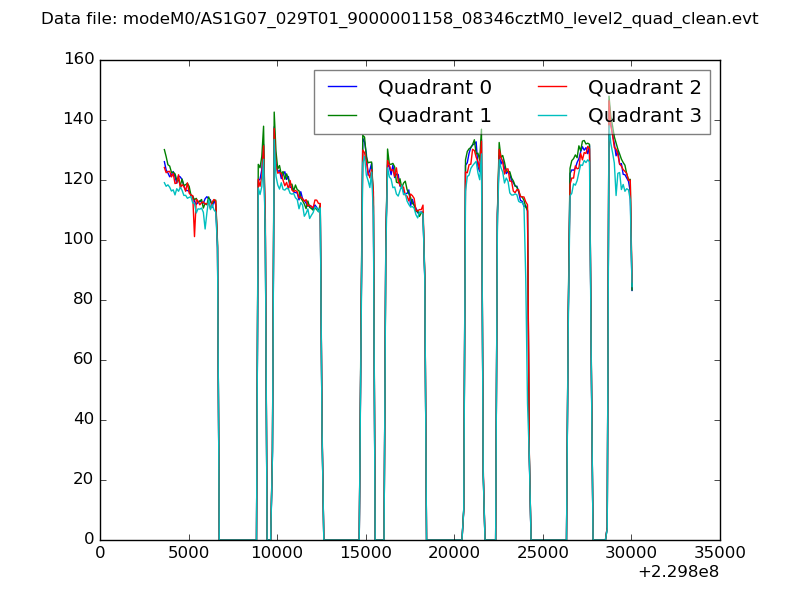 |
|
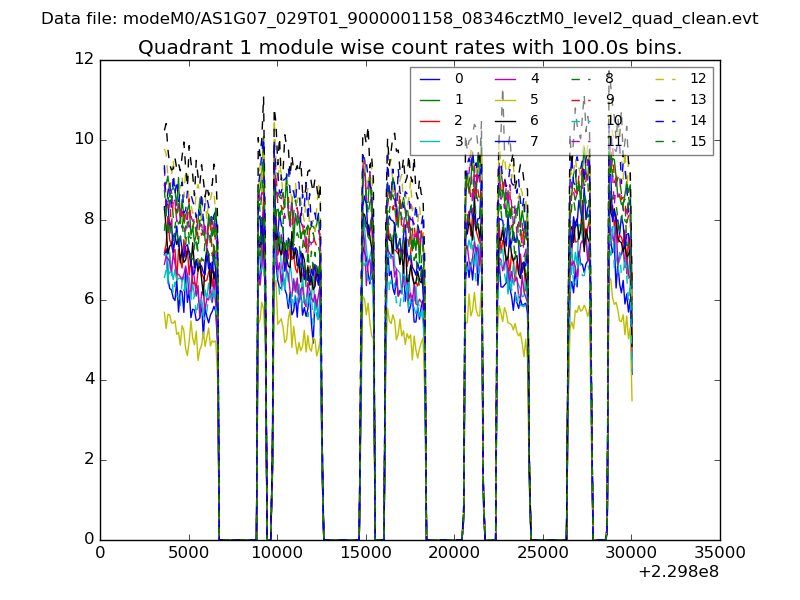
| Module-wise count rates for Quadrant A Data is divided into 100 sec bins |
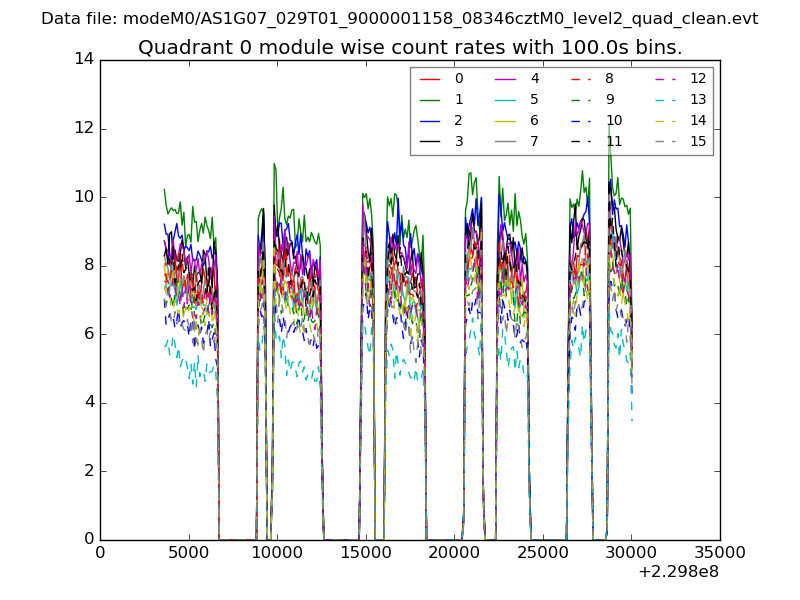 |
 |
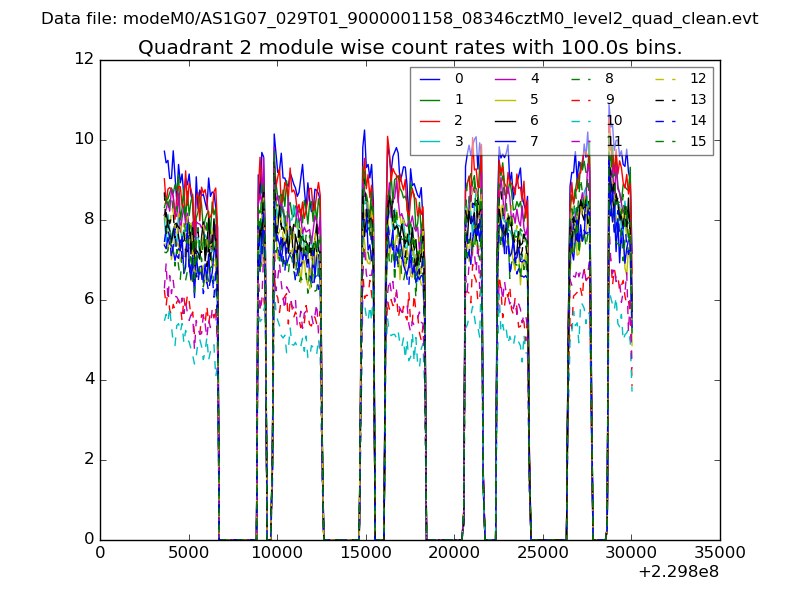
| Module-wise count rates for Quadrant B Data is divided into 100 sec bins |
 |
 |
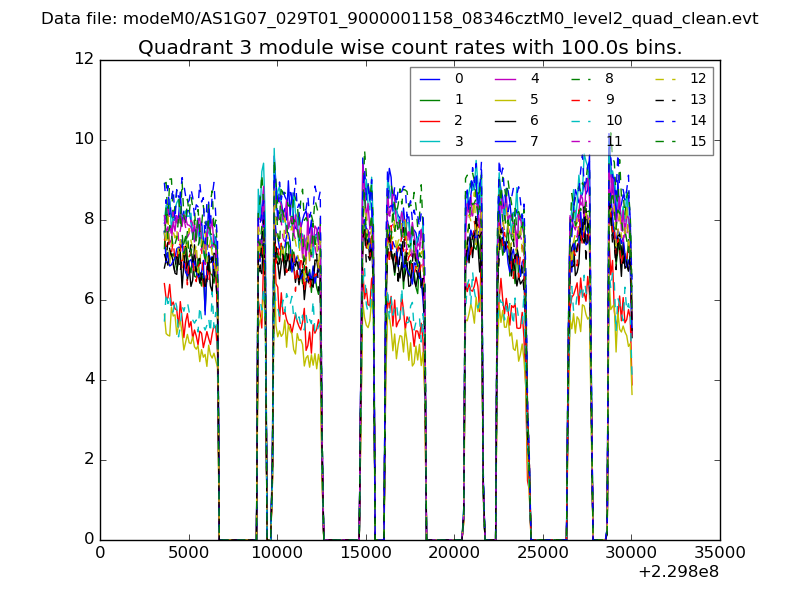
| Module-wise count rates for Quadrant C Data is divided into 100 sec bins |
 |
 |
| Module-wise count rates for Quadrant D Data is divided into 100 sec bins |
 |
 |
| Parameter | Plot |
|---|---|
| CZT HV Monitor | 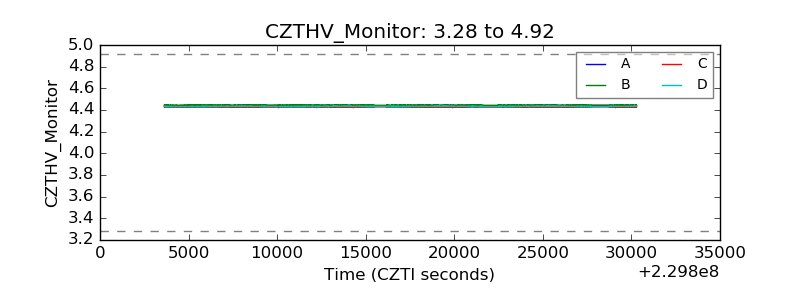 |
| D_VDD | 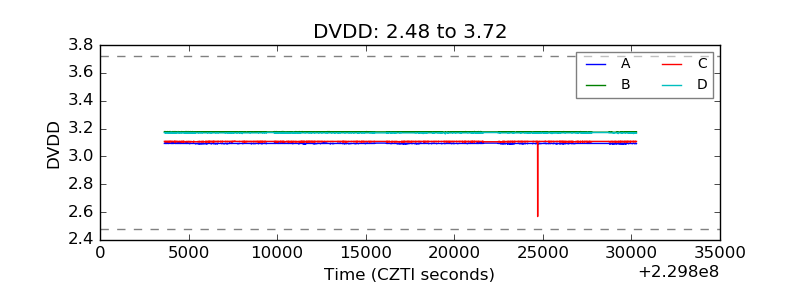 |
| Temperature 1 | 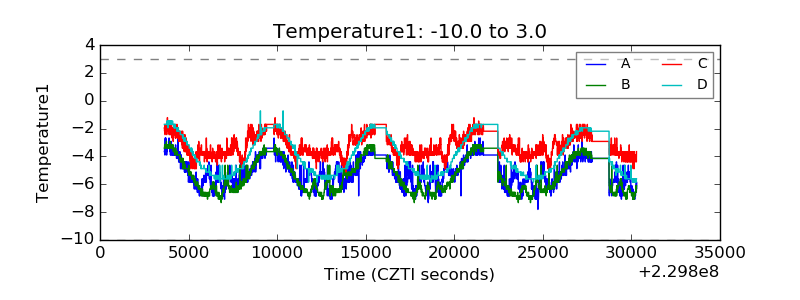 |
| Veto HV Monitor | 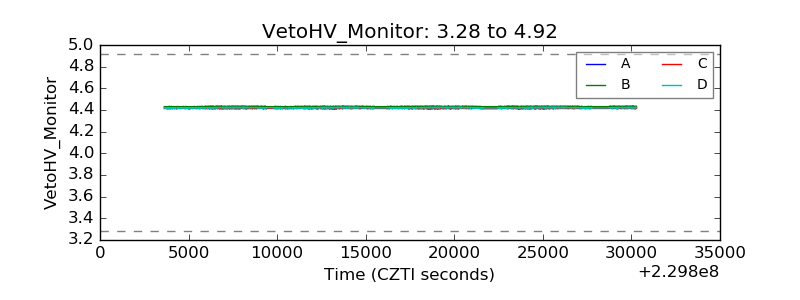 |
| Veto LLD | 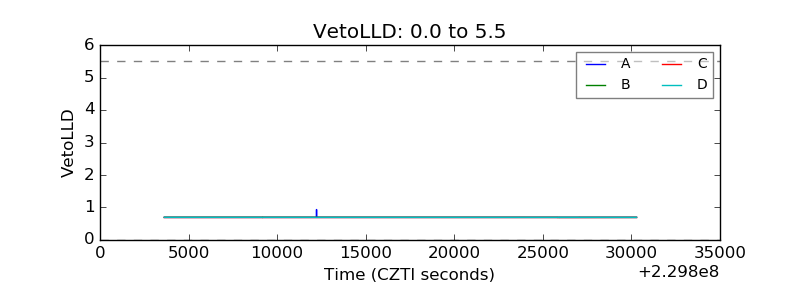 |
| Alpha Counter | 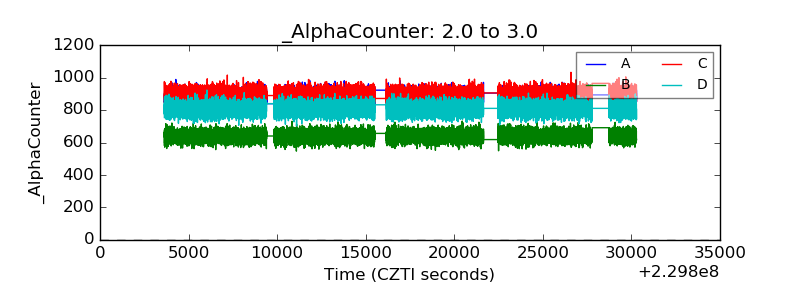 |
| _CPM_Rate | 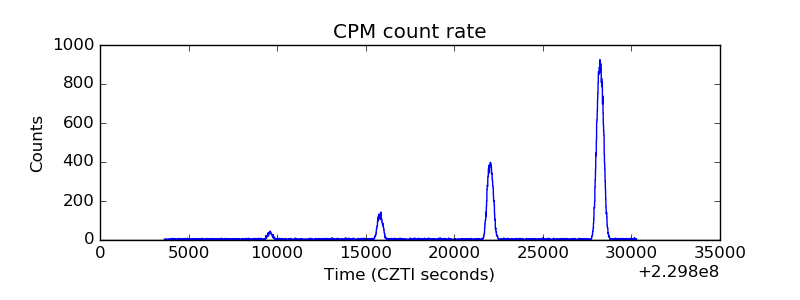 |
| CZT Counter | 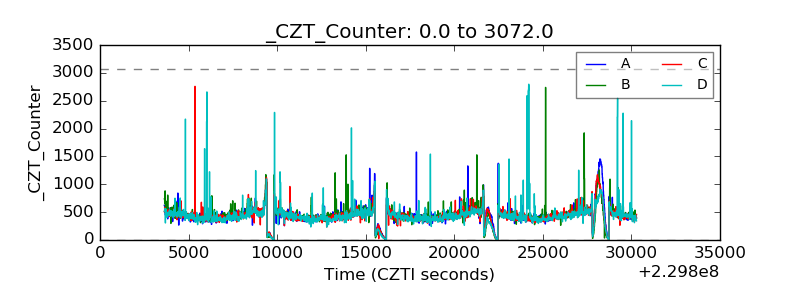 |
| +2.5 Volts monitor |  |
| +5 Volts monitor |  |
| _ROLL_ROT | 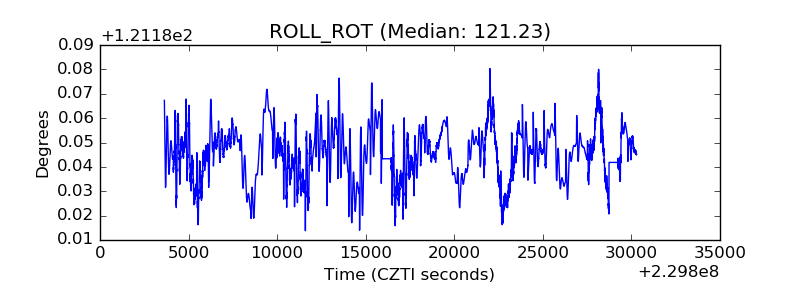 |
| _Roll_DEC | 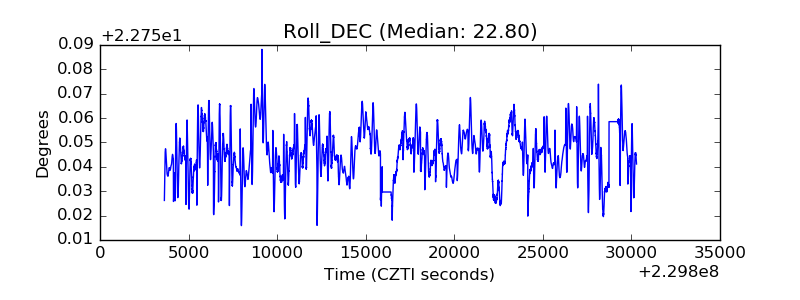 |
| _Roll_RA | 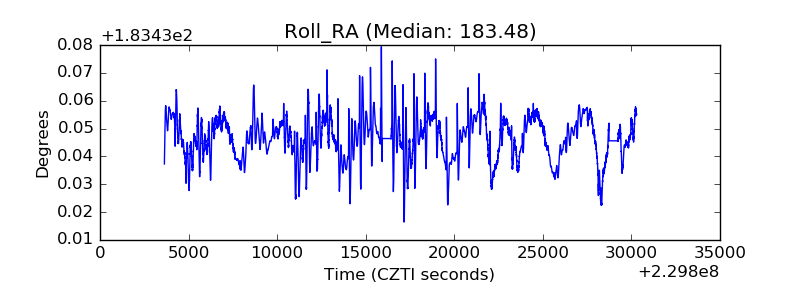 |
| Veto Counter | 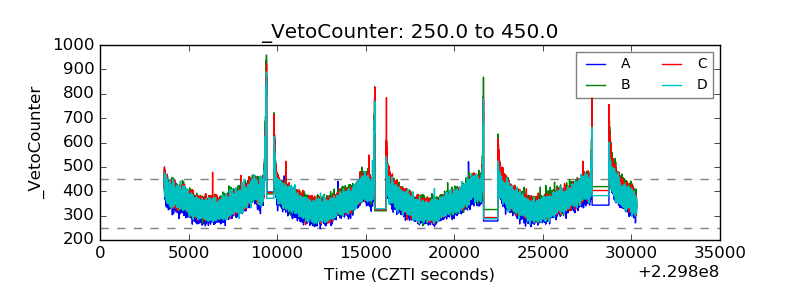 |