| Param | Original file | Final file |
|---|---|---|
| Filename | modeM0/AS1G07_029T01_9000001158_08349cztM0_level2.evt | modeM0/AS1G07_029T01_9000001158_08349cztM0_level2_quad_clean.evt |
| Size (bytes) | 659,148,480 | 71,354,880 |
| Size | 628.6 MB | 68.0 MB |
| Events in quadrant A | 10,460,023 | 357,152 |
| Events in quadrant B | 3,088,304 | 471,302 |
| Events in quadrant C | 2,903,583 | 455,006 |
| Events in quadrant D | 3,085,492 | 439,314 |
| Mode SS | |||
|---|---|---|---|
| Quadrant | BADHDUFLAG | Total packets | Discarded packets |
| A | 0 | 128 | 0 |
| B | 0 | 128 | 0 |
| C | 0 | 128 | 0 |
| D | 0 | 128 | 0 |
| Mode M0 | |||
|---|---|---|---|
| Quadrant | BADHDUFLAG | Total packets | Discarded packets |
| A | 0 | 35149 | 3 |
| B | 0 | 13062 | 4 |
| C | 0 | 12756 | 2 |
| D | 0 | 13345 | 2 |
| Mode M9 | |||
|---|---|---|---|
| Quadrant | BADHDUFLAG | Total packets | Discarded packets |
| A | 0 | 18 | 0 |
| B | 0 | 18 | 0 |
| C | 0 | 18 | 0 |
| D | 0 | 19 | 0 |
| Quadrant | Total seconds | Saturated seconds | Saturation percentage |
|---|---|---|---|
| A | 6260 | 3513 | 56.118211% |
| B | 6259 | 22 | 0.351494% |
| C | 6260 | 9 | 0.143770% |
| D | 6260 | 25 | 0.399361% |
Noise dominated data is calculated using 1-second bins in cleaned event files. If a bin has >2000 counts, and if more than 50% of those come from <1% of pixels, then it is considered to be noise-dominated and hence unusable.
| Quadrant | # 1 sec bins | Bins with >0 counts | Bins with >2000 counts | High rate bins dominated by noise | Noise dominated (total time) | Noise dominated (detector-on time) | Marked lightcurve |
|---|---|---|---|---|---|---|---|
| A | 7485 | 6261 | 3179 | 3179 | 42.47% | 50.77% | 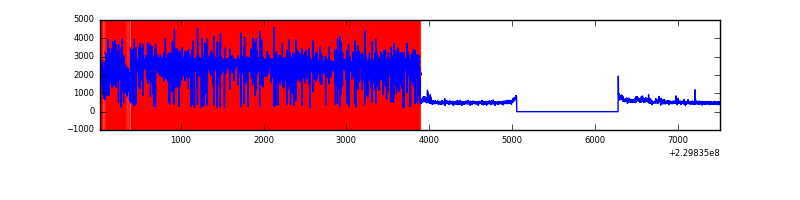 |
| B | 7485 | 6261 | 1 | 1 | 0.01% | 0.02% | 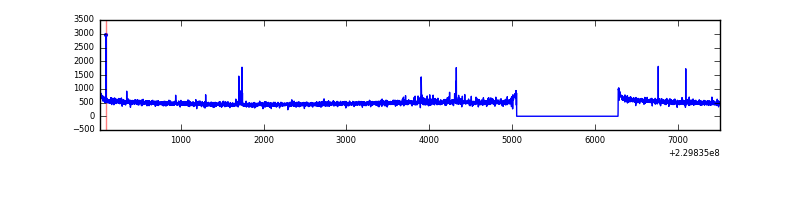 |
| C | 7485 | 6261 | 0 | 0 | 0.00% | 0.00% | 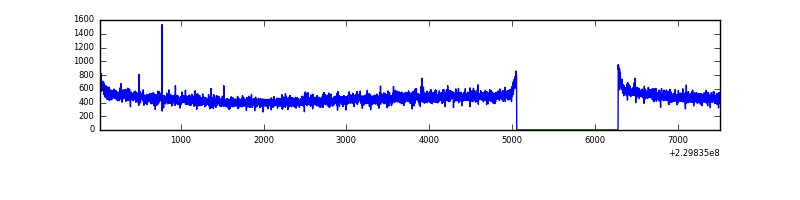 |
| D | 7485 | 6261 | 18 | 18 | 0.24% | 0.29% | 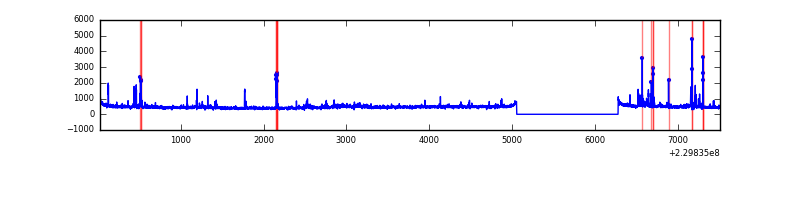 |
Top three noisy pixels from each quadrant. If the there are fewer than three noisy pixels in the level2.evt file, extra rows are filled as -1
| Pixel properties | Quadrant properties | ||||||
|---|---|---|---|---|---|---|---|
| Quadrant | DetID | PixID | Counts | Sigma | Mean | Median | Sigma |
| A | 15 | 236 | 8192316 | 70511.94 | 571 | 560 | 116.2 |
| A | 14 | 111 | 55007 | 468.66 | 571 | 560 | 116.2 |
| A | 15 | 239 | 18155 | 151.45 | 571 | 560 | 116.2 |
| B | 4 | 80 | 21946 | 142.7 | 778 | 761 | 148.5 |
| B | 0 | 214 | 19064 | 123.29 | 778 | 761 | 148.5 |
| B | 12 | 111 | 16441 | 105.62 | 778 | 761 | 148.5 |
| C | 13 | 61 | 5664 | 28.46 | 744 | 746 | 172.8 |
| C | 3 | 202 | 1887 | 6.6 | 744 | 746 | 172.8 |
| C | -1 | -1 | -1 | -1.0 | 744 | 746 | 172.8 |
| D | 2 | 14 | 134473 | 739.01 | 737 | 720 | 181.0 |
| D | 2 | 152 | 78229 | 428.25 | 737 | 720 | 181.0 |
| D | 2 | 136 | 42037 | 228.29 | 737 | 720 | 181.0 |
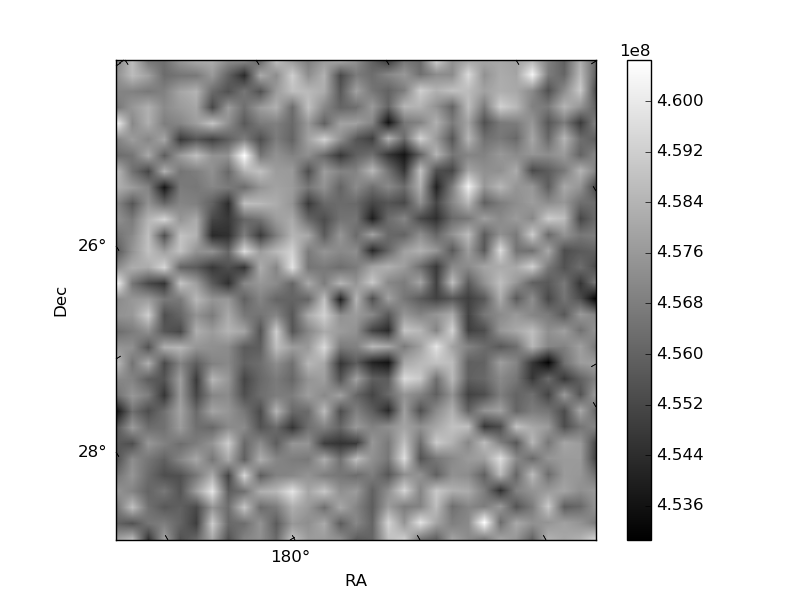
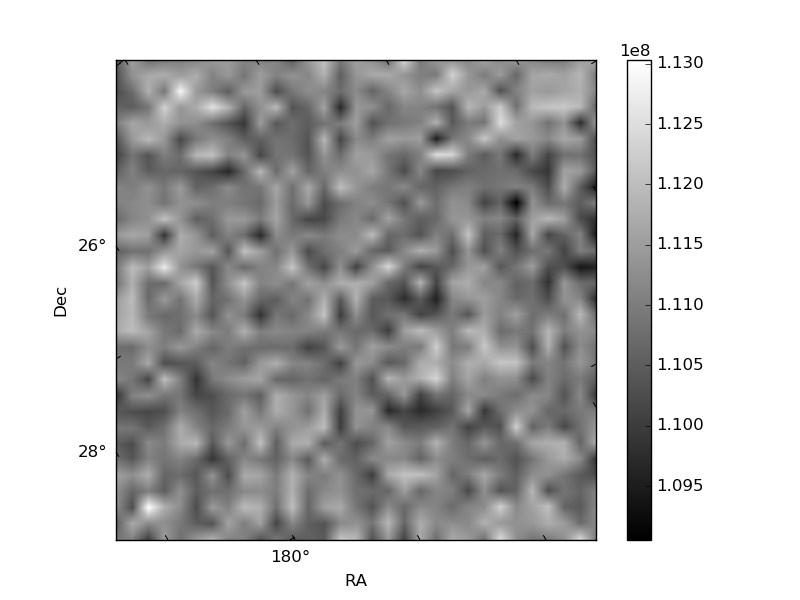
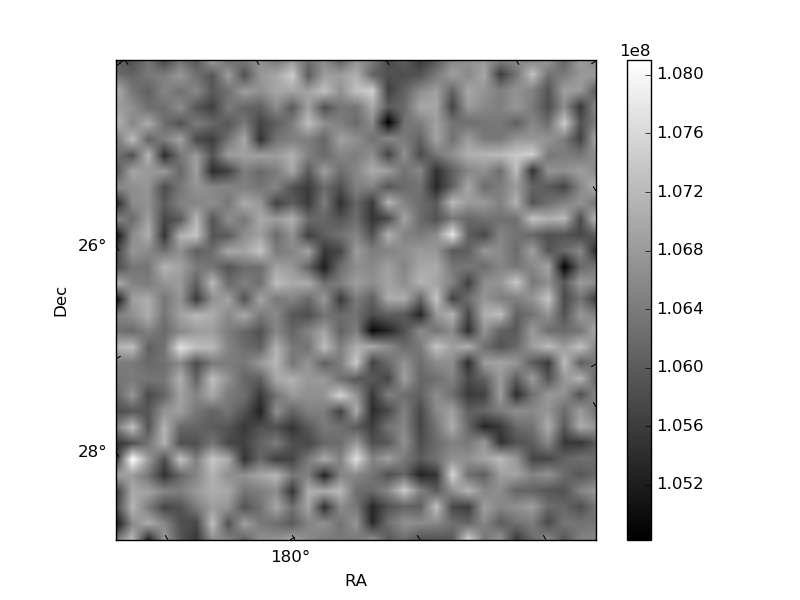
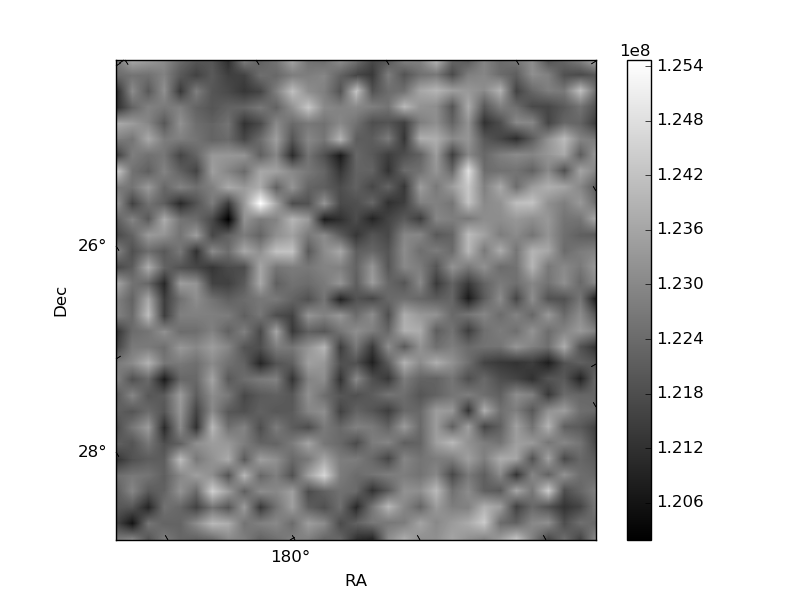
Histogram calculated using DETX and DETY for each event in the final _common_clean file
| Quadrant A | 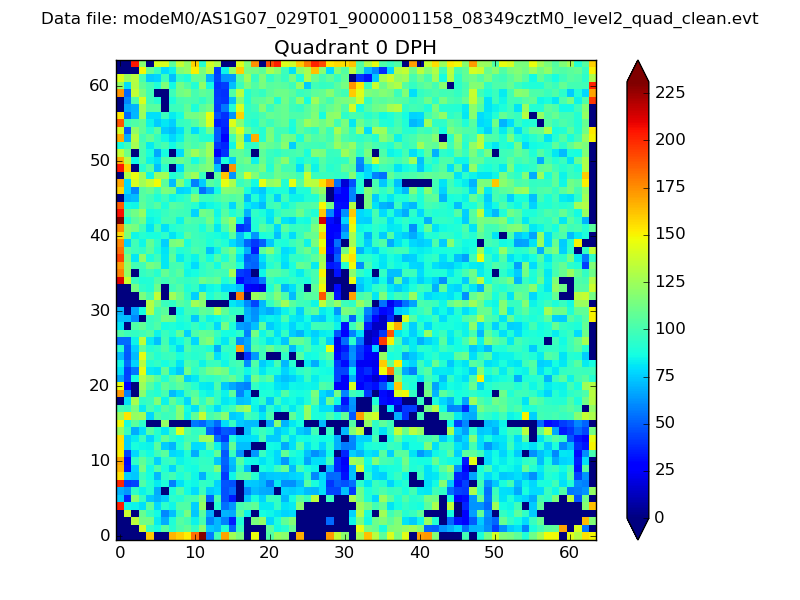 |
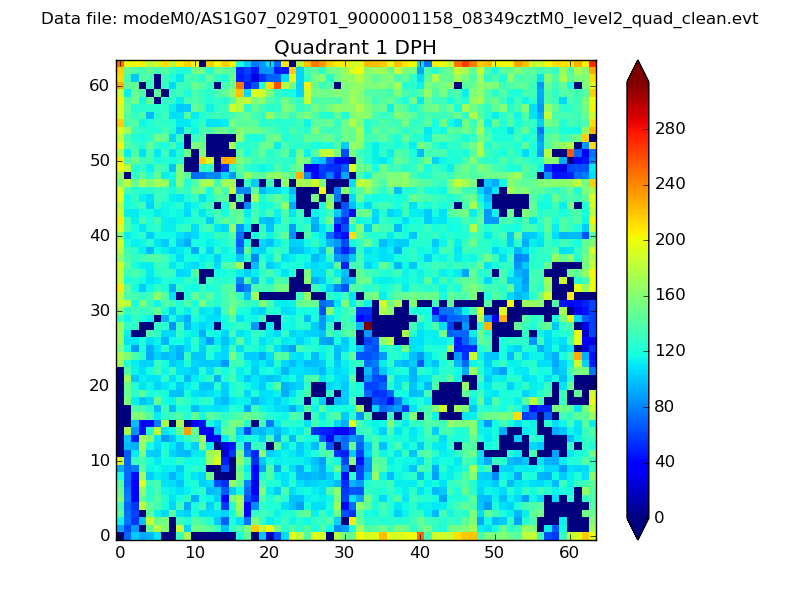 |
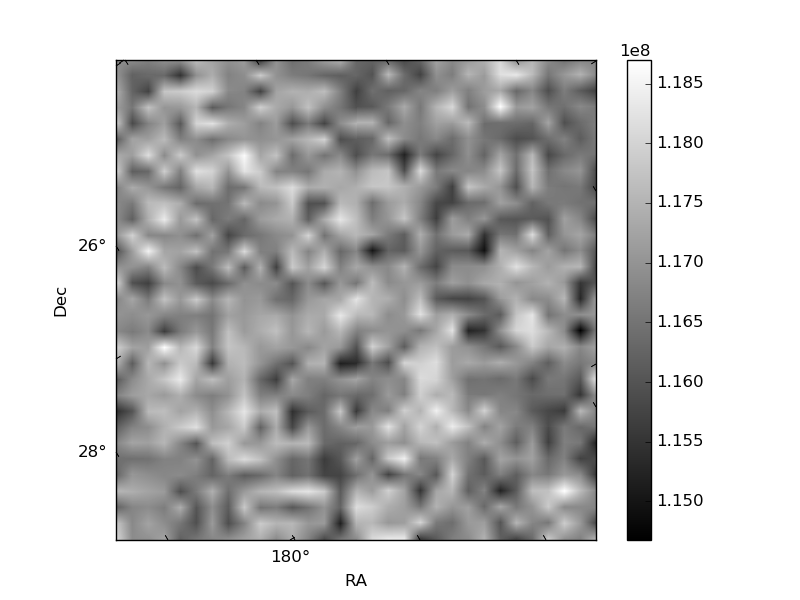
Quadrant B |
|---|---|---|---|
| Quadrant D | 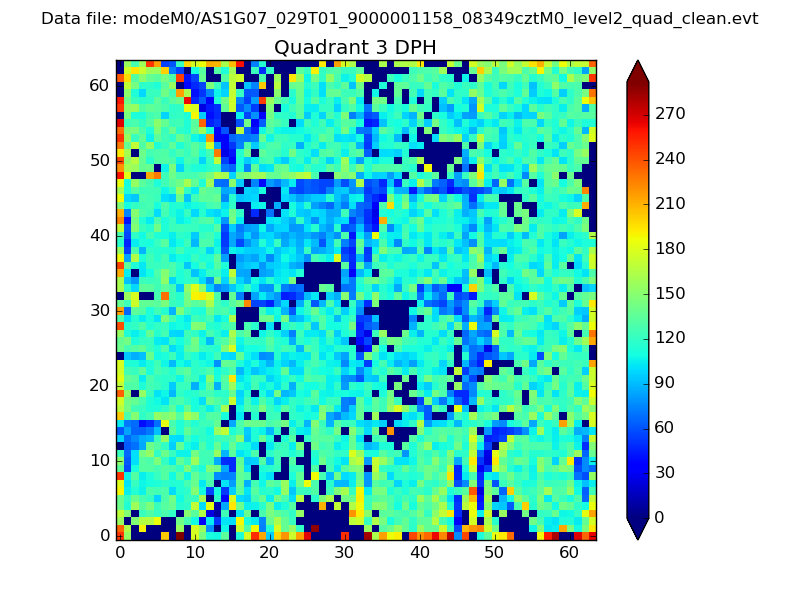 |
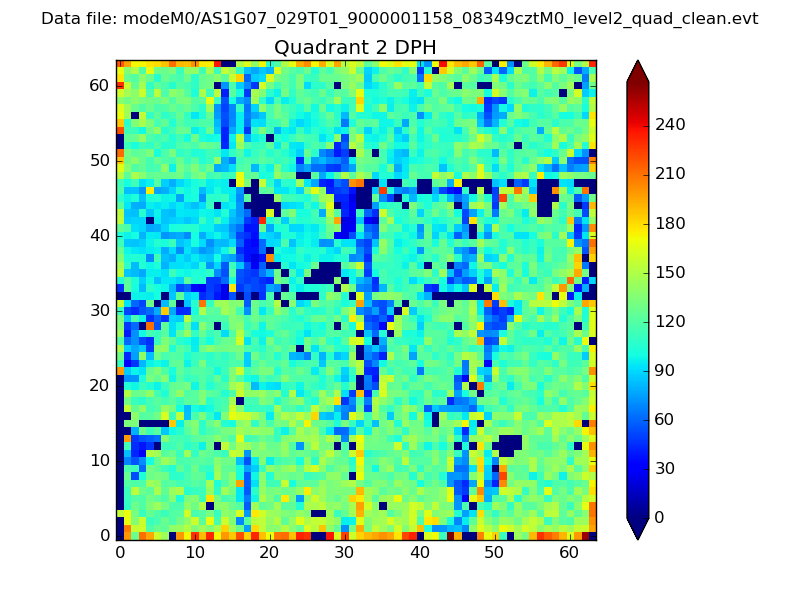 |
Quadrant C |
| Plot type | Count rate plots | Images |
|---|---|---|
| Comparison with Poisson distribution Blue bars denote a histogram of data divided into 1 sec bins. Red curve is a Poisson curve with rate = median count rate of data. |
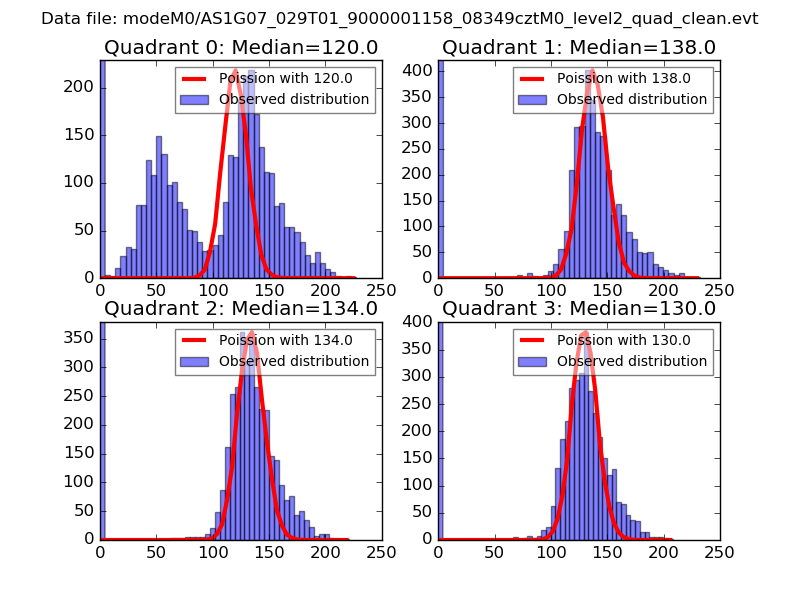 |
 |
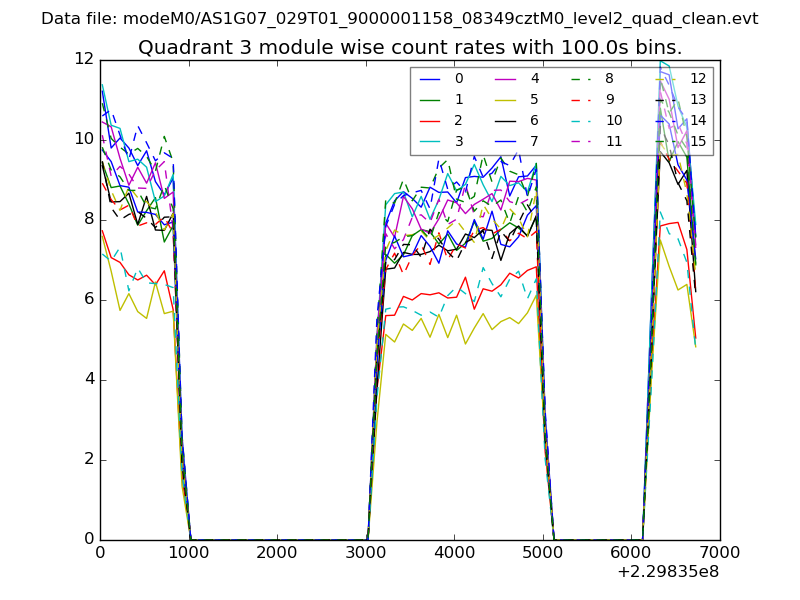
| Quadrant-wise count rates Data is divided into 100 sec bins |
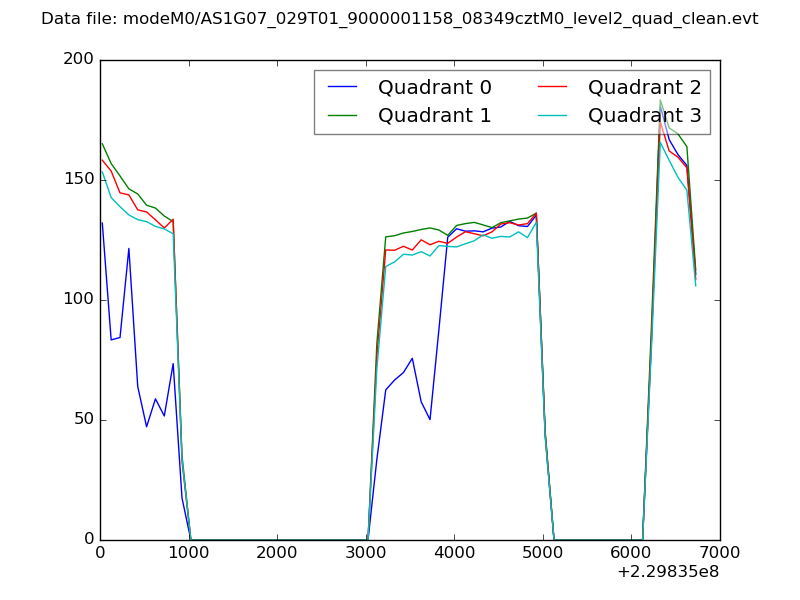 |
|
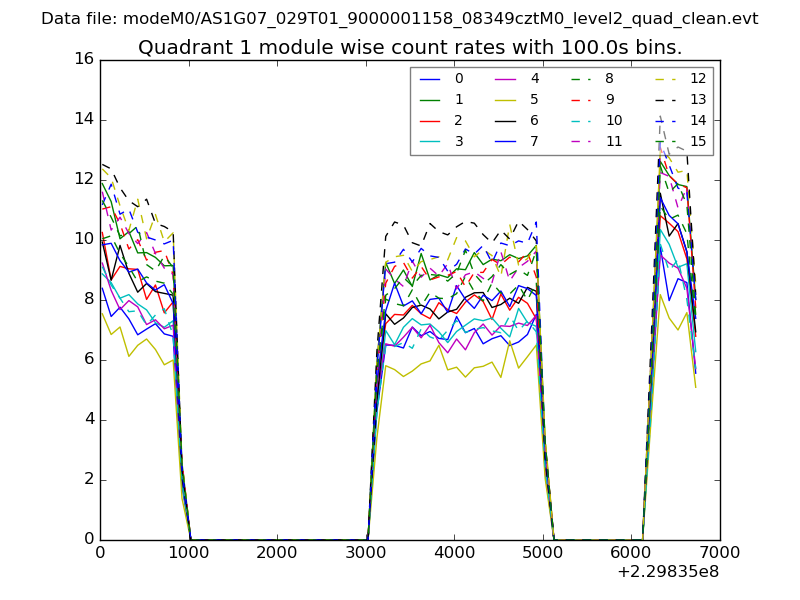
| Module-wise count rates for Quadrant A Data is divided into 100 sec bins |
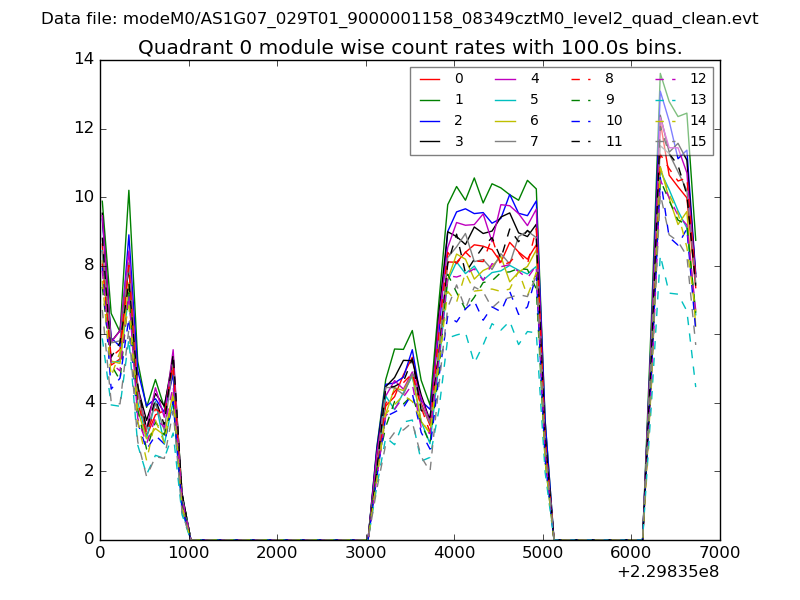 |
 |
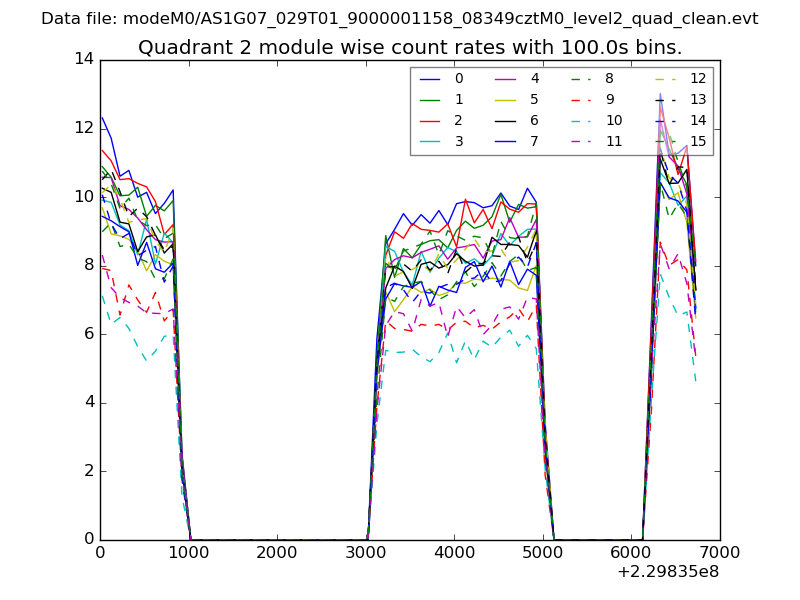
| Module-wise count rates for Quadrant B Data is divided into 100 sec bins |
 |
 |
| Module-wise count rates for Quadrant C Data is divided into 100 sec bins |
 |
 |
| Module-wise count rates for Quadrant D Data is divided into 100 sec bins |
 |
 |
| Parameter | Plot |
|---|---|
| CZT HV Monitor | 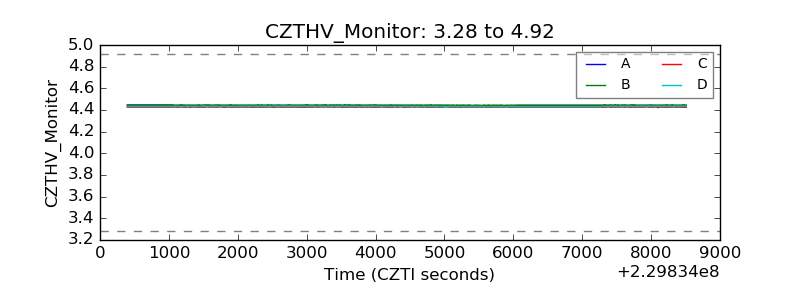 |
| D_VDD | 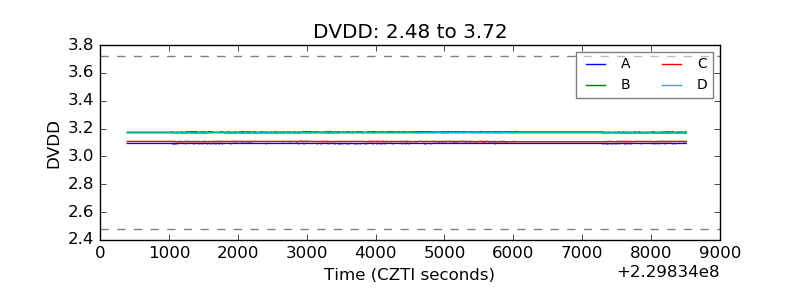 |
| Temperature 1 | 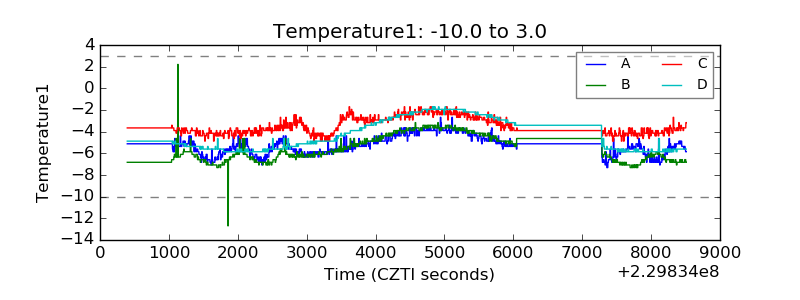 |
| Veto HV Monitor | 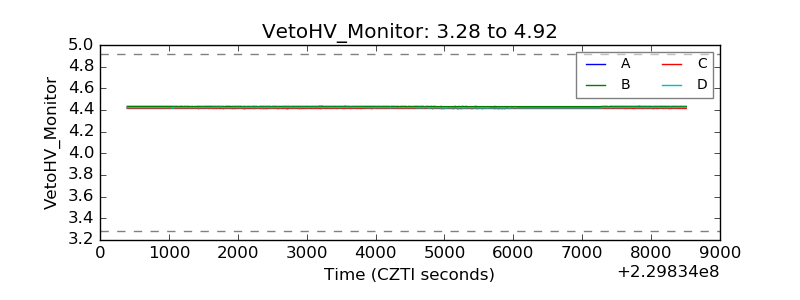 |
| Veto LLD | 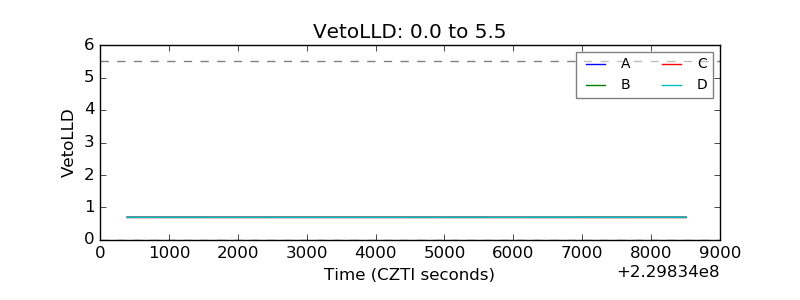 |
| Alpha Counter | 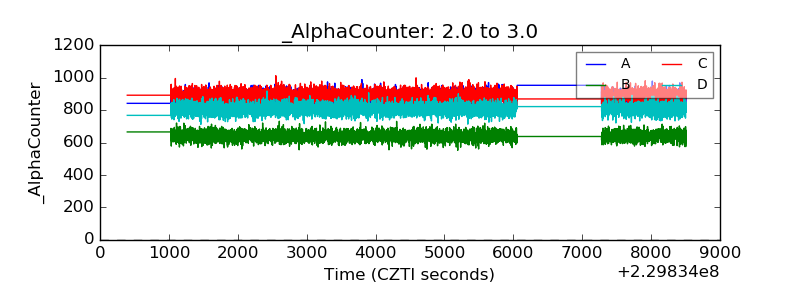 |
| _CPM_Rate | 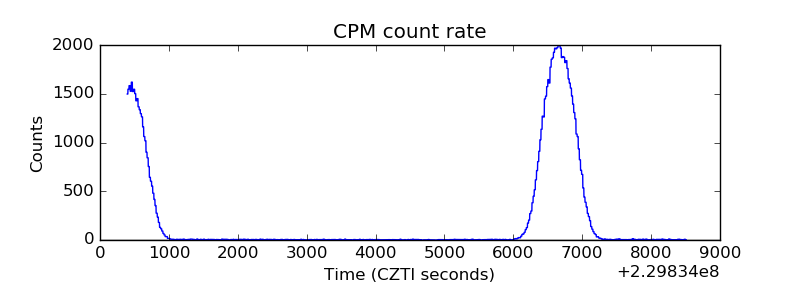 |
| CZT Counter | 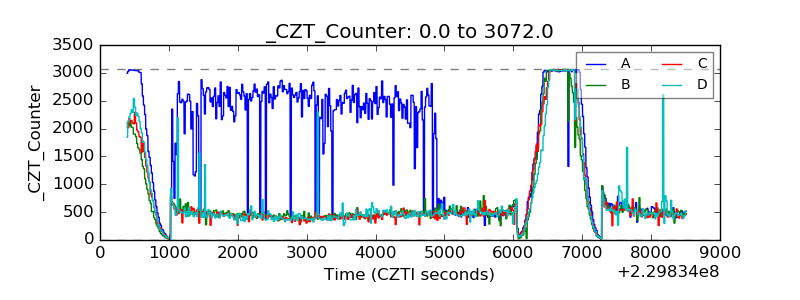 |
| +2.5 Volts monitor |  |
| +5 Volts monitor | 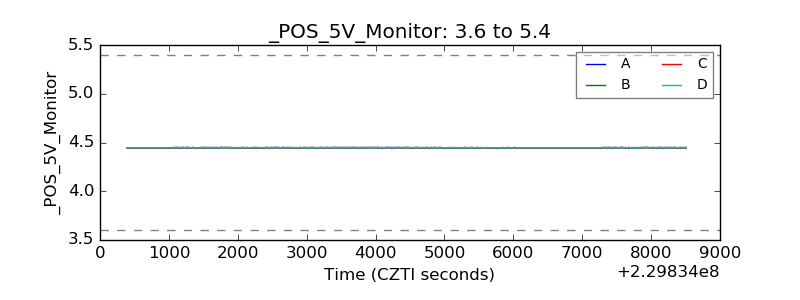 |
| _ROLL_ROT | 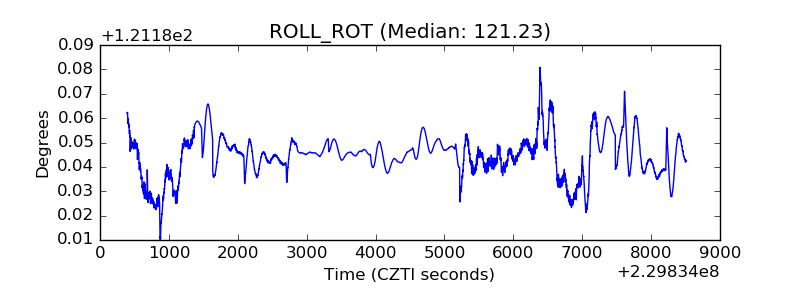 |
| _Roll_DEC | 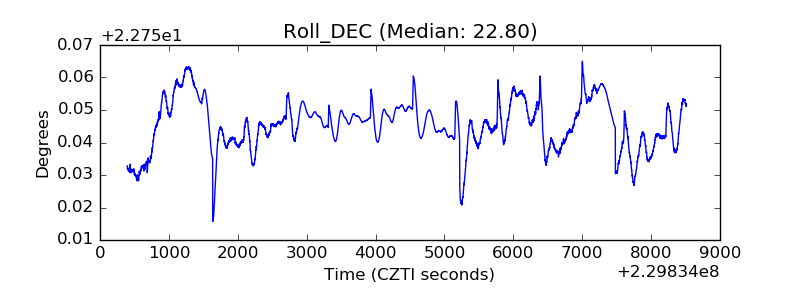 |
| _Roll_RA | 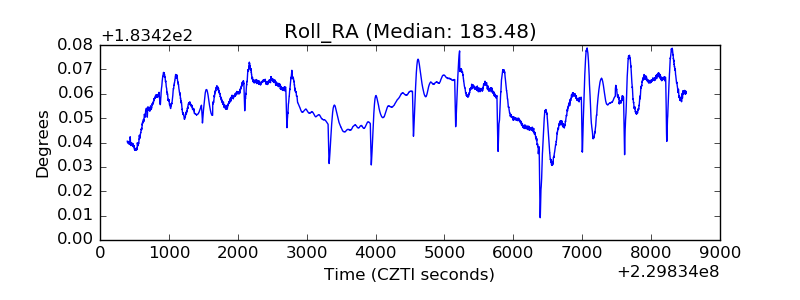 |
| Veto Counter | 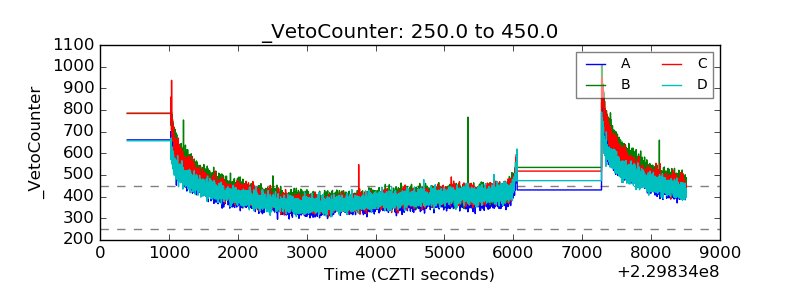 |