| Param | Original file | Final file |
|---|---|---|
| Filename | modeM0/AS1G07_029T01_9000001158_08350cztM0_level2.evt | modeM0/AS1G07_029T01_9000001158_08350cztM0_level2_quad_clean.evt |
| Size (bytes) | 418,184,640 | 66,493,440 |
| Size | 398.8 MB | 63.4 MB |
| Events in quadrant A | 3,122,261 | 401,609 |
| Events in quadrant B | 3,094,458 | 410,316 |
| Events in quadrant C | 2,930,391 | 396,088 |
| Events in quadrant D | 3,104,811 | 381,150 |
| Mode SS | |||
|---|---|---|---|
| Quadrant | BADHDUFLAG | Total packets | Discarded packets |
| A | 0 | 124 | 0 |
| B | 0 | 124 | 0 |
| C | 0 | 124 | 0 |
| D | 0 | 124 | 0 |
| Mode M0 | |||
|---|---|---|---|
| Quadrant | BADHDUFLAG | Total packets | Discarded packets |
| A | 0 | 12937 | 3 |
| B | 0 | 12808 | 2 |
| C | 0 | 12493 | 2 |
| D | 0 | 13096 | 2 |
| Mode M9 | |||
|---|---|---|---|
| Quadrant | BADHDUFLAG | Total packets | Discarded packets |
| A | 0 | 20 | 0 |
| B | 0 | 20 | 0 |
| C | 0 | 20 | 0 |
| D | 0 | 21 | 0 |
| Quadrant | Total seconds | Saturated seconds | Saturation percentage |
|---|---|---|---|
| A | 6071 | 49 | 0.807116% |
| B | 6071 | 50 | 0.823588% |
| C | 6071 | 21 | 0.345907% |
| D | 6071 | 46 | 0.757701% |
Noise dominated data is calculated using 1-second bins in cleaned event files. If a bin has >2000 counts, and if more than 50% of those come from <1% of pixels, then it is considered to be noise-dominated and hence unusable.
| Quadrant | # 1 sec bins | Bins with >0 counts | Bins with >2000 counts | High rate bins dominated by noise | Noise dominated (total time) | Noise dominated (detector-on time) | Marked lightcurve |
|---|---|---|---|---|---|---|---|
| A | 7366 | 6072 | 4 | 4 | 0.05% | 0.07% | 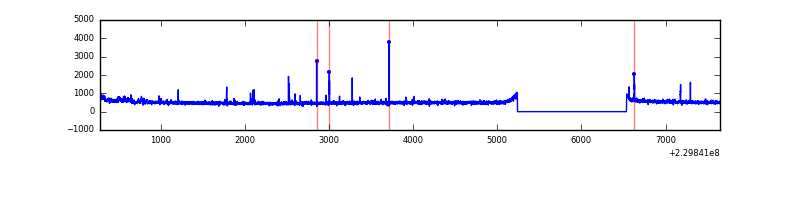 |
| B | 7366 | 6072 | 0 | 0 | 0.00% | 0.00% | 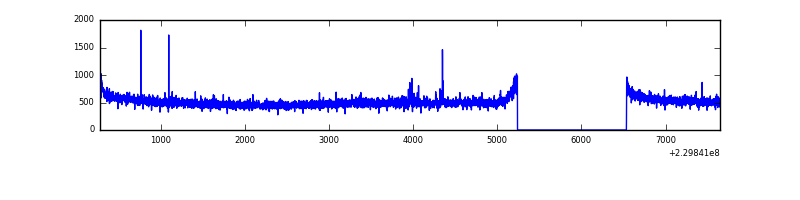 |
| C | 7366 | 6072 | 0 | 0 | 0.00% | 0.00% |  |
| D | 7366 | 6072 | 18 | 18 | 0.24% | 0.30% | 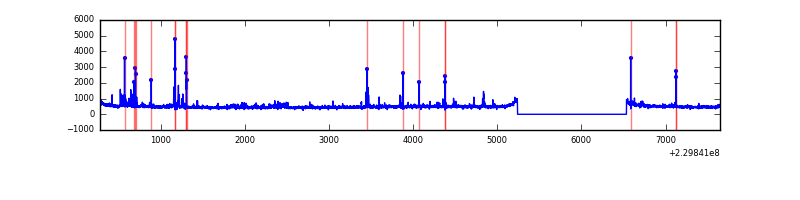 |
Top three noisy pixels from each quadrant. If the there are fewer than three noisy pixels in the level2.evt file, extra rows are filled as -1
| Pixel properties | Quadrant properties | ||||||
|---|---|---|---|---|---|---|---|
| Quadrant | DetID | PixID | Counts | Sigma | Mean | Median | Sigma |
| A | 14 | 111 | 63731 | 400.66 | 786 | 770 | 157.1 |
| A | 15 | 239 | 34785 | 216.46 | 786 | 770 | 157.1 |
| A | 0 | 226 | 7423 | 42.34 | 786 | 770 | 157.1 |
| B | 0 | 214 | 17299 | 111.46 | 789 | 774 | 148.3 |
| B | 12 | 111 | 16032 | 102.92 | 789 | 774 | 148.3 |
| B | 11 | 111 | 13225 | 83.98 | 789 | 774 | 148.3 |
| C | 13 | 61 | 5715 | 28.52 | 751 | 756 | 173.9 |
| C | 3 | 202 | 1883 | 6.48 | 751 | 756 | 173.9 |
| C | -1 | -1 | -1 | -1.0 | 751 | 756 | 173.9 |
| D | 2 | 14 | 92442 | 513.1 | 747 | 732 | 178.7 |
| D | 2 | 152 | 72097 | 399.27 | 747 | 732 | 178.7 |
| D | 12 | 233 | 41735 | 229.4 | 747 | 732 | 178.7 |
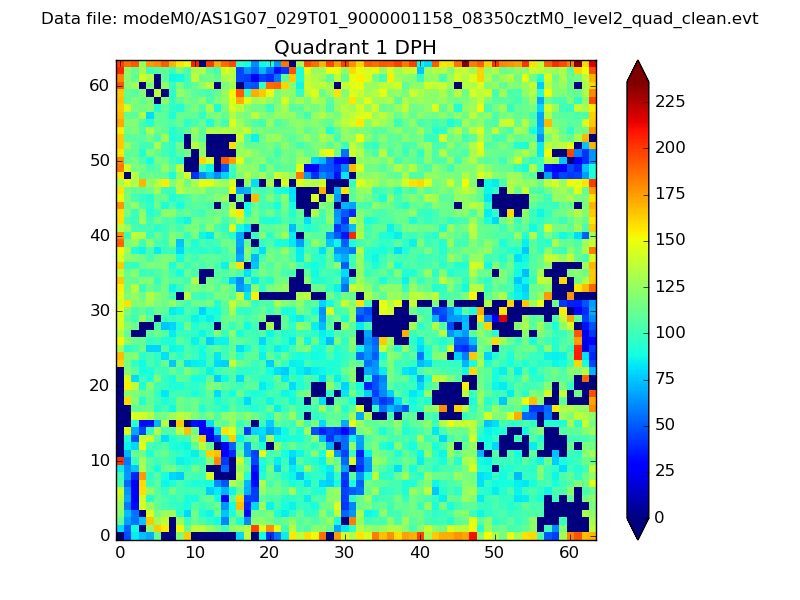
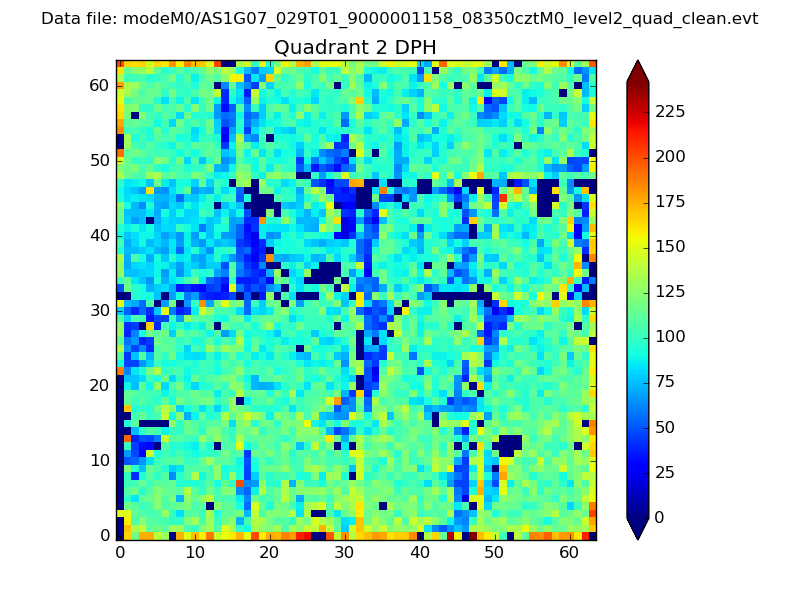
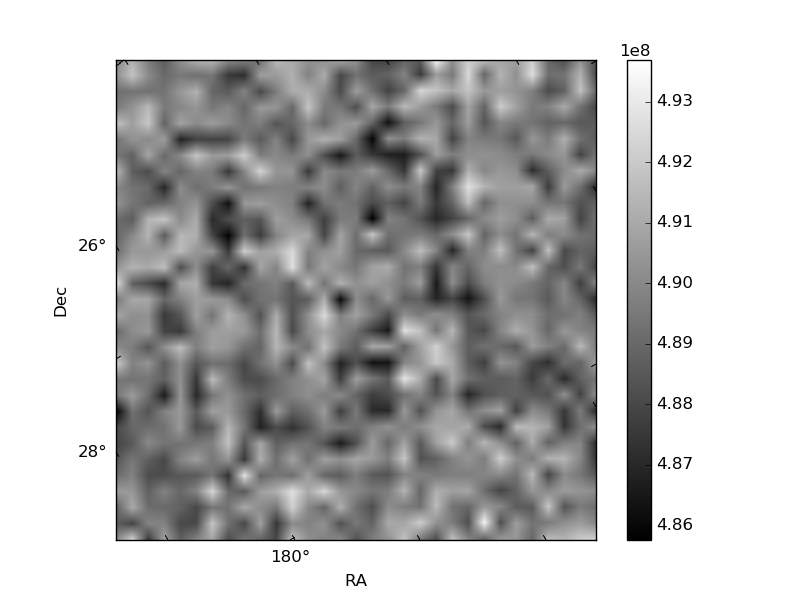
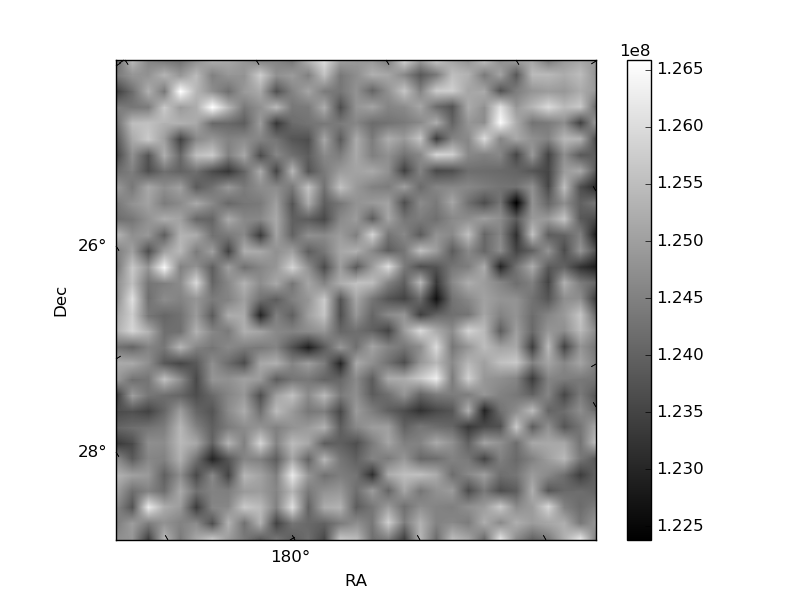
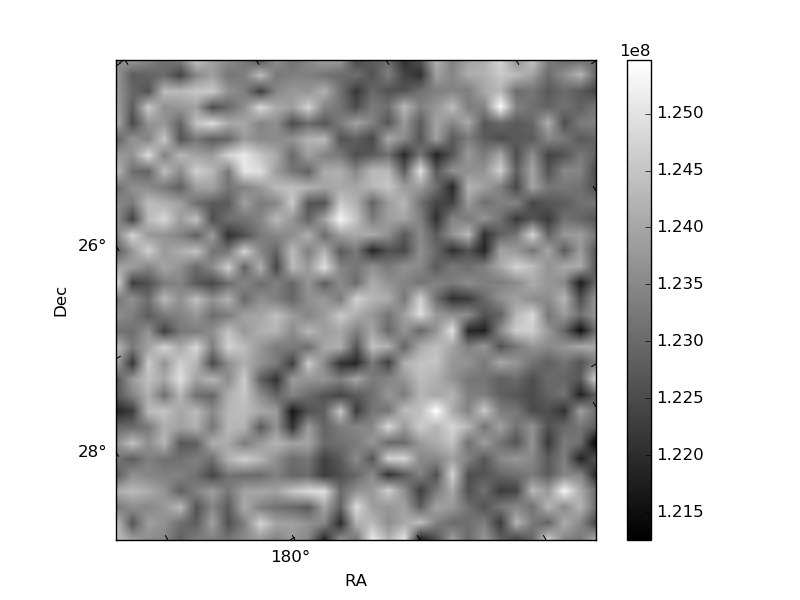
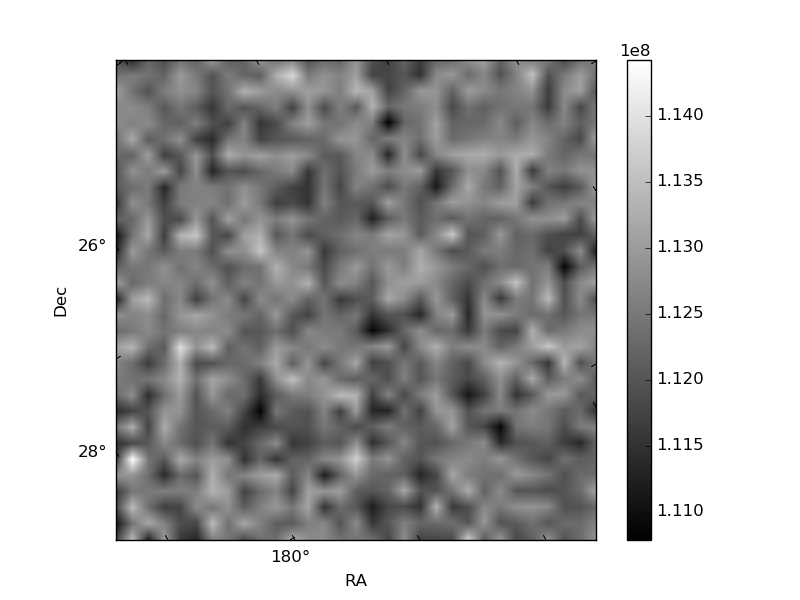
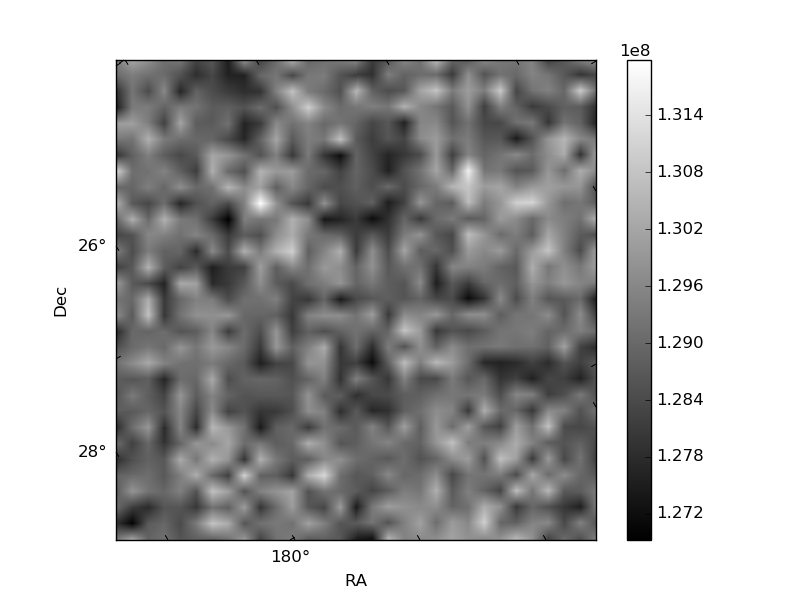
Histogram calculated using DETX and DETY for each event in the final _common_clean file
| Quadrant A | 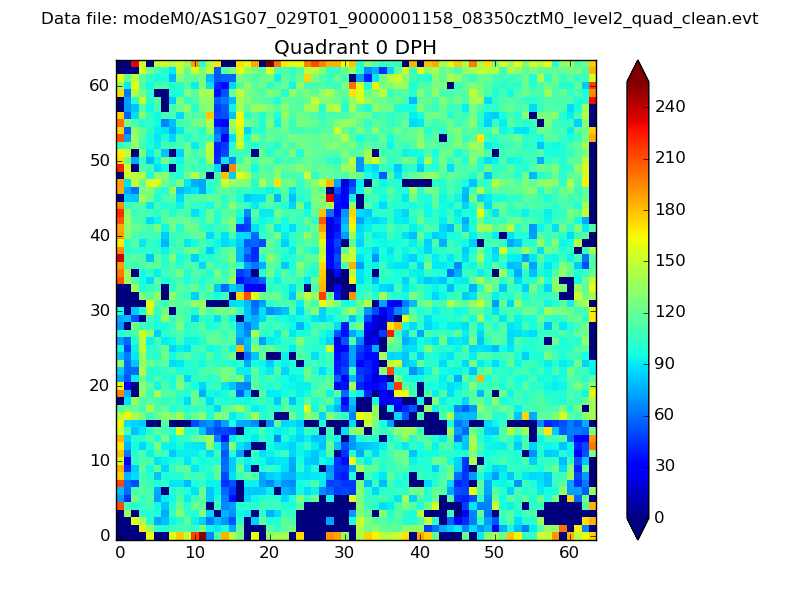 |
 |
Quadrant B |
|---|---|---|---|
| Quadrant D | 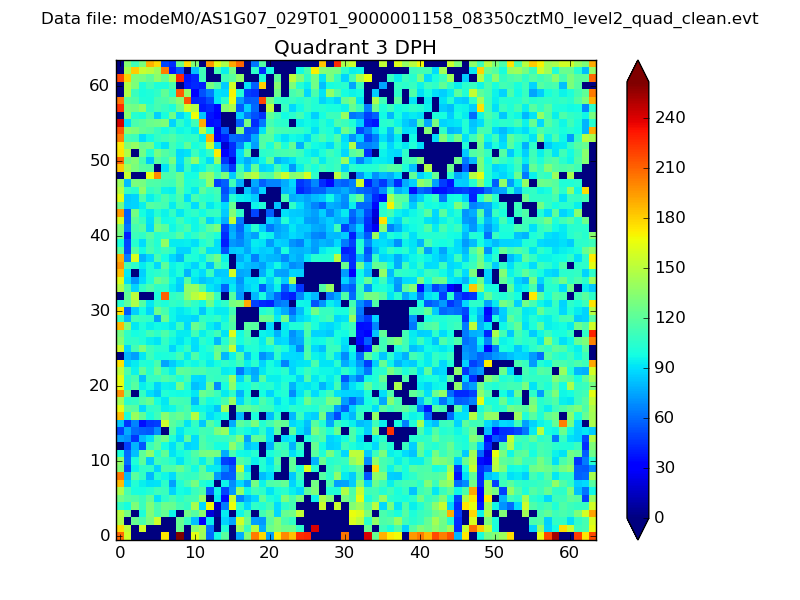 |
 |
Quadrant C |
| Plot type | Count rate plots | Images |
|---|---|---|
| Comparison with Poisson distribution Blue bars denote a histogram of data divided into 1 sec bins. Red curve is a Poisson curve with rate = median count rate of data. |
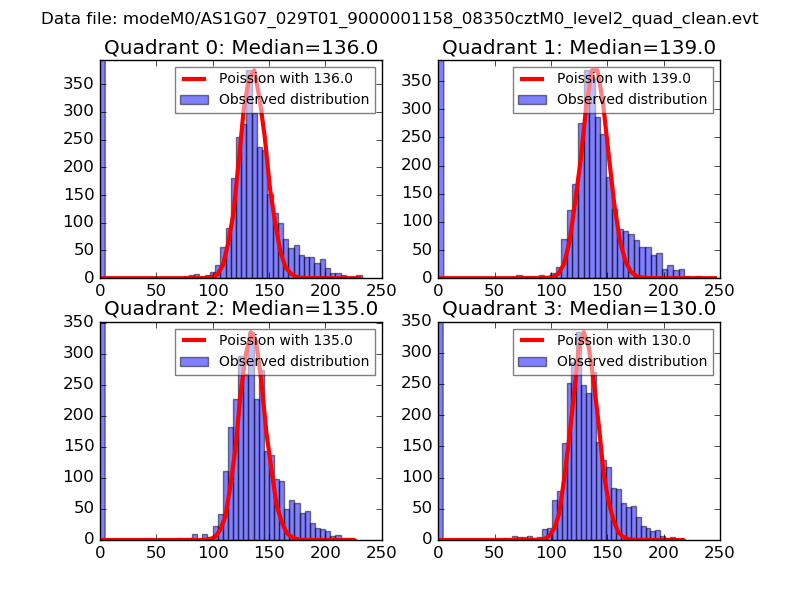 |
 |
| Quadrant-wise count rates Data is divided into 100 sec bins |
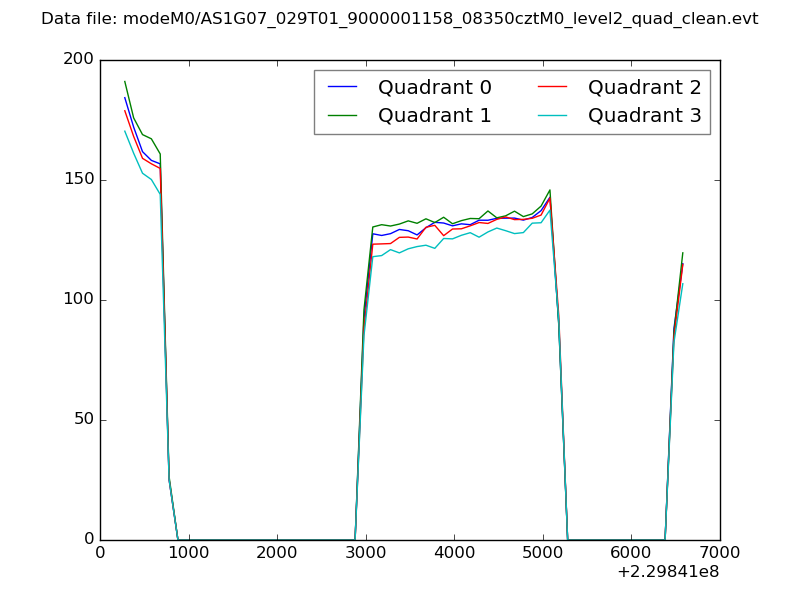 |
|
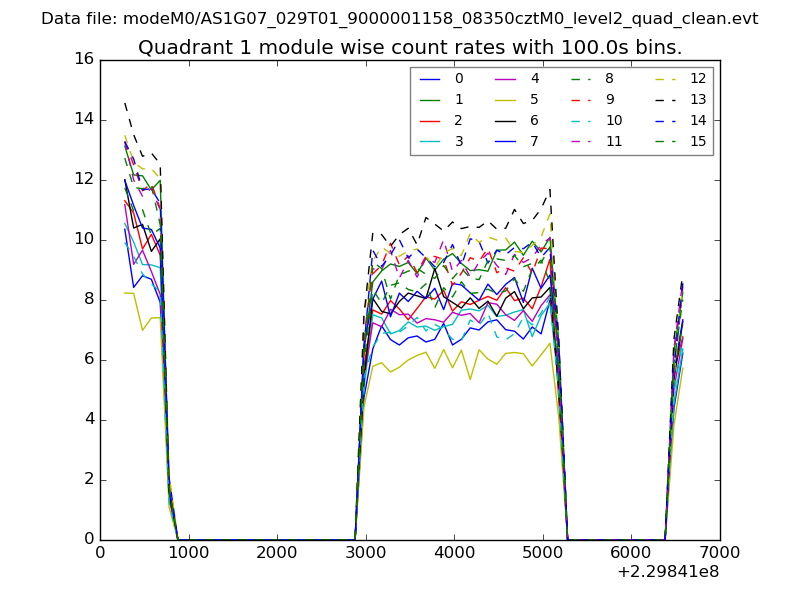
| Module-wise count rates for Quadrant A Data is divided into 100 sec bins |
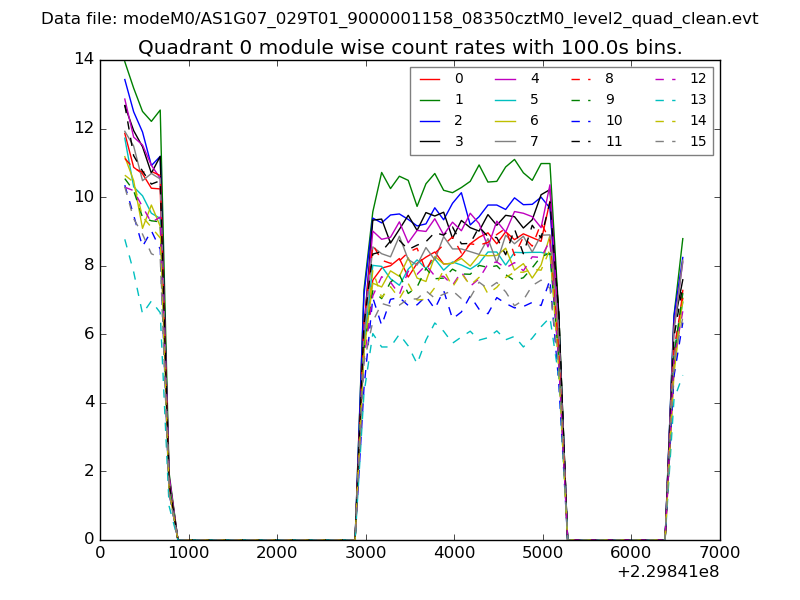 |
 |
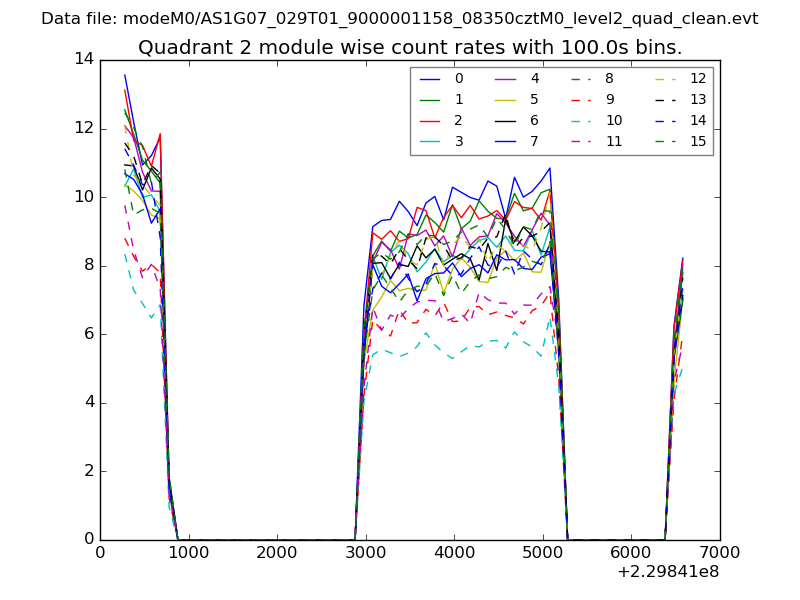
| Module-wise count rates for Quadrant B Data is divided into 100 sec bins |
 |
 |
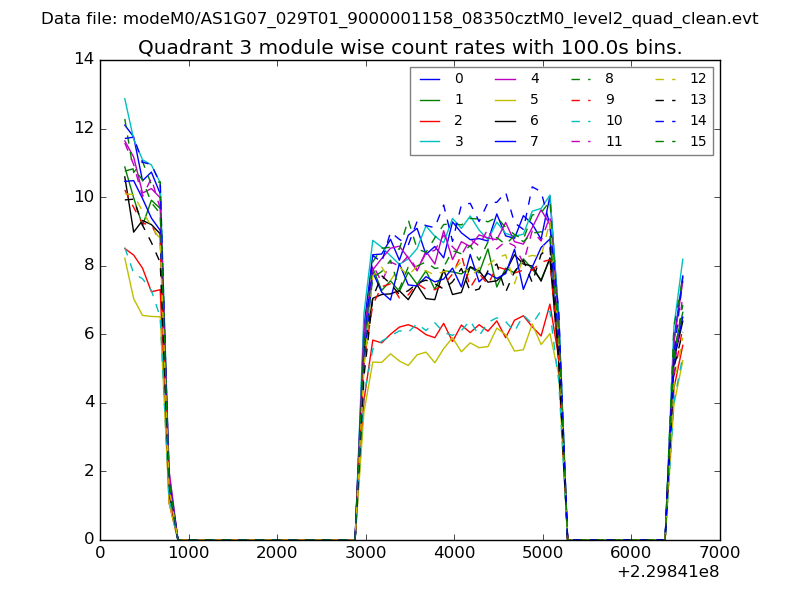
| Module-wise count rates for Quadrant C Data is divided into 100 sec bins |
 |
 |
| Module-wise count rates for Quadrant D Data is divided into 100 sec bins |
 |
 |
| Parameter | Plot |
|---|---|
| CZT HV Monitor | 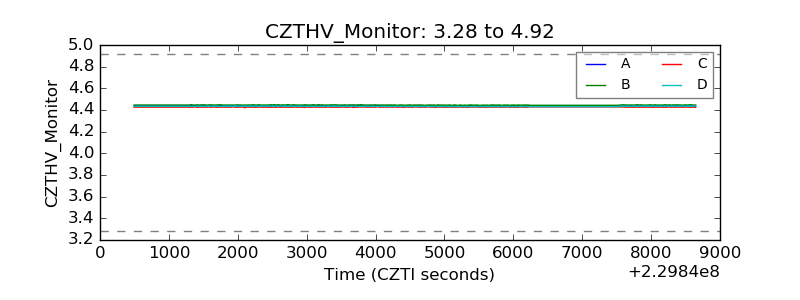 |
| D_VDD | 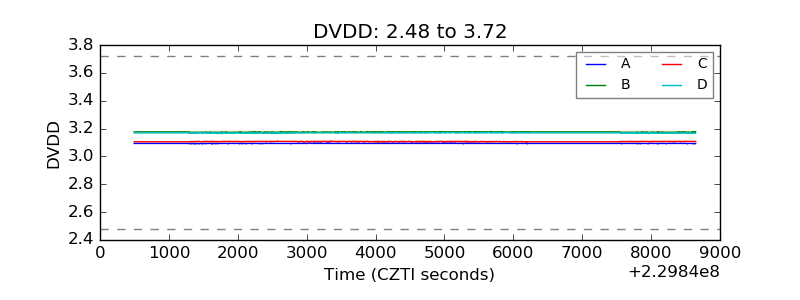 |
| Temperature 1 | 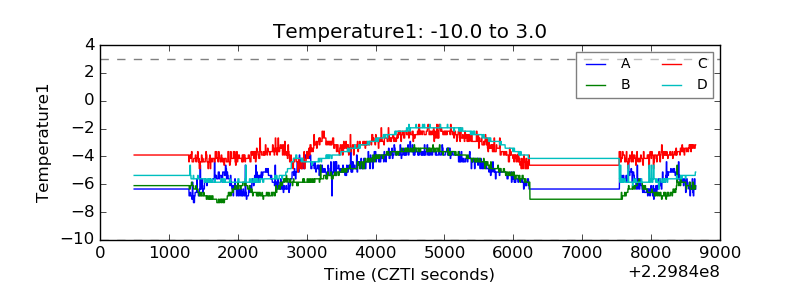 |
| Veto HV Monitor | 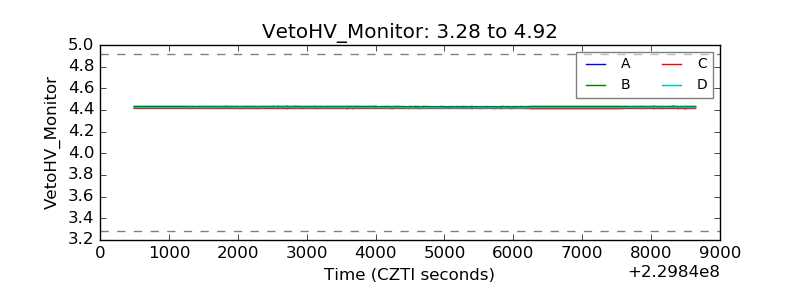 |
| Veto LLD | 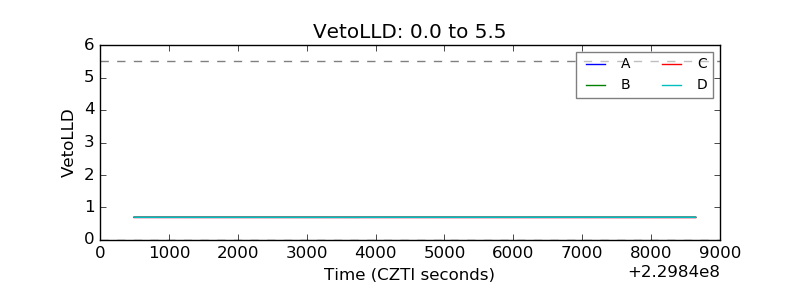 |
| Alpha Counter | 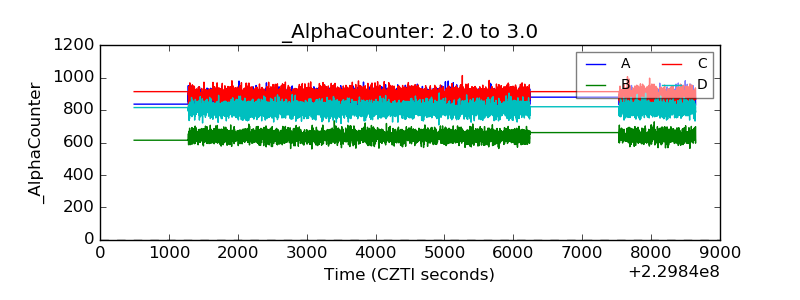 |
| _CPM_Rate | 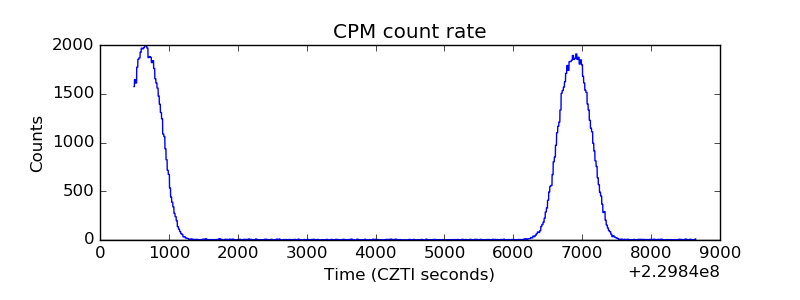 |
| CZT Counter | 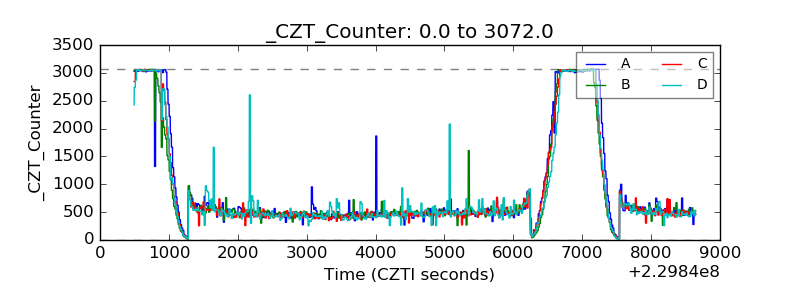 |
| +2.5 Volts monitor |  |
| +5 Volts monitor |  |
| _ROLL_ROT | 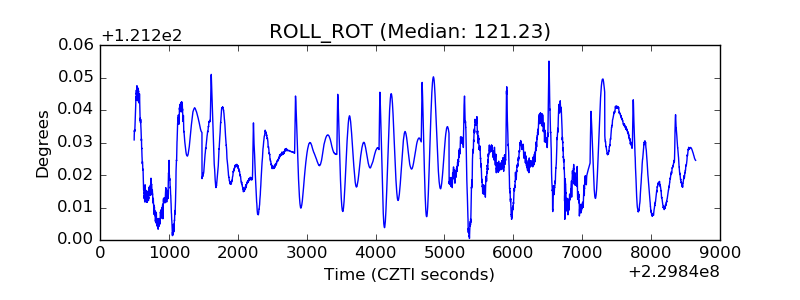 |
| _Roll_DEC | 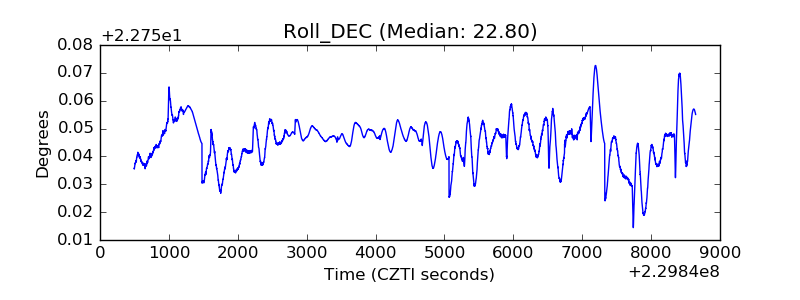 |
| _Roll_RA | 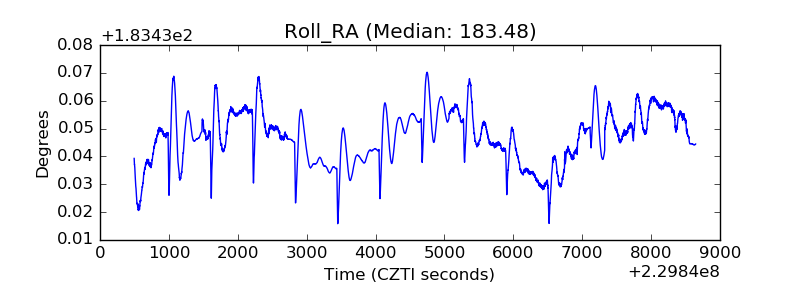 |
| Veto Counter | 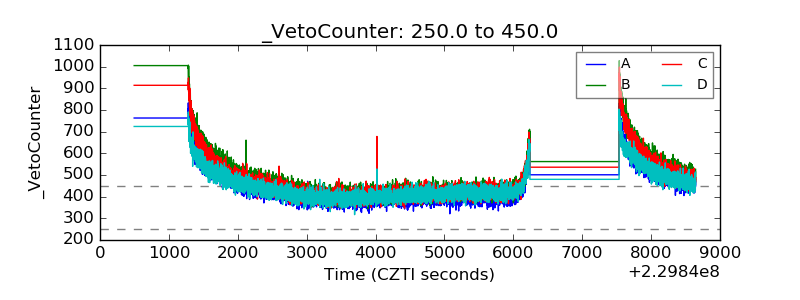 |