| Param | Original file | Final file |
|---|---|---|
| Filename | modeM0/AS1G07_029T01_9000001158_08351cztM0_level2.evt | modeM0/AS1G07_029T01_9000001158_08351cztM0_level2_quad_clean.evt |
| Size (bytes) | 271,278,720 | 40,775,040 |
| Size | 258.7 MB | 38.9 MB |
| Events in quadrant A | 2,054,098 | 242,198 |
| Events in quadrant B | 2,030,885 | 246,461 |
| Events in quadrant C | 1,923,749 | 236,943 |
| Events in quadrant D | 1,935,530 | 228,147 |
| Mode SS | |||
|---|---|---|---|
| Quadrant | BADHDUFLAG | Total packets | Discarded packets |
| A | 0 | 82 | 0 |
| B | 0 | 82 | 0 |
| C | 0 | 82 | 0 |
| D | 0 | 82 | 0 |
| Mode M0 | |||
|---|---|---|---|
| Quadrant | BADHDUFLAG | Total packets | Discarded packets |
| A | 0 | 8411 | 1 |
| B | 0 | 8366 | 1 |
| C | 0 | 8177 | 1 |
| D | 0 | 8337 | 1 |
| Mode M9 | |||
|---|---|---|---|
| Quadrant | BADHDUFLAG | Total packets | Discarded packets |
| A | 0 | 13 | 0 |
| B | 0 | 13 | 0 |
| C | 0 | 13 | 0 |
| D | 0 | 13 | 0 |
| Quadrant | Total seconds | Saturated seconds | Saturation percentage |
|---|---|---|---|
| A | 3971 | 40 | 1.007303% |
| B | 3971 | 42 | 1.057668% |
| C | 3971 | 18 | 0.453286% |
| D | 3971 | 22 | 0.554017% |
Noise dominated data is calculated using 1-second bins in cleaned event files. If a bin has >2000 counts, and if more than 50% of those come from <1% of pixels, then it is considered to be noise-dominated and hence unusable.
| Quadrant | # 1 sec bins | Bins with >0 counts | Bins with >2000 counts | High rate bins dominated by noise | Noise dominated (total time) | Noise dominated (detector-on time) | Marked lightcurve |
|---|---|---|---|---|---|---|---|
| A | 5266 | 3972 | 4 | 4 | 0.08% | 0.10% | 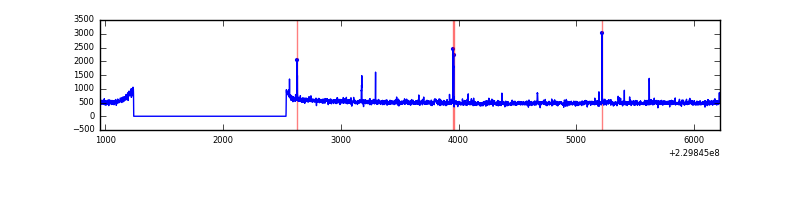 |
| B | 5266 | 3972 | 1 | 1 | 0.02% | 0.03% | 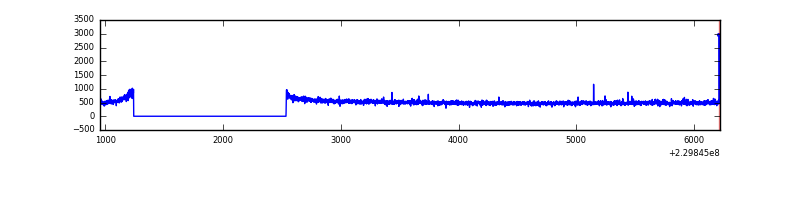 |
| C | 5266 | 3972 | 0 | 0 | 0.00% | 0.00% | 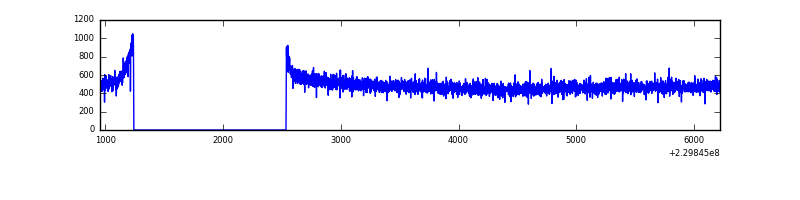 |
| D | 5266 | 3972 | 4 | 4 | 0.08% | 0.10% | 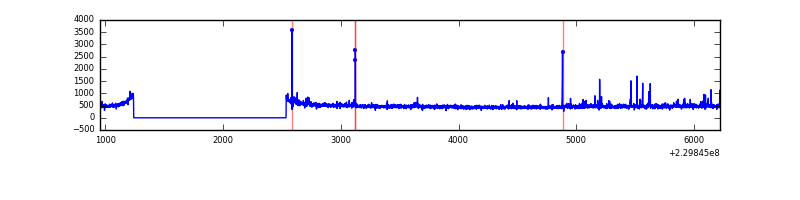 |
Top three noisy pixels from each quadrant. If the there are fewer than three noisy pixels in the level2.evt file, extra rows are filled as -1
| Pixel properties | Quadrant properties | ||||||
|---|---|---|---|---|---|---|---|
| Quadrant | DetID | PixID | Counts | Sigma | Mean | Median | Sigma |
| A | 15 | 239 | 34899 | 329.88 | 517 | 507 | 104.3 |
| A | 14 | 111 | 30258 | 285.36 | 517 | 507 | 104.3 |
| A | 0 | 226 | 4858 | 41.73 | 517 | 507 | 104.3 |
| B | 0 | 214 | 14650 | 143.64 | 518 | 506 | 98.5 |
| B | 12 | 111 | 10487 | 101.36 | 518 | 506 | 98.5 |
| B | 11 | 111 | 8615 | 82.35 | 518 | 506 | 98.5 |
| C | 13 | 61 | 3764 | 28.51 | 493 | 497 | 114.6 |
| C | 3 | 202 | 1253 | 6.6 | 493 | 497 | 114.6 |
| C | -1 | -1 | -1 | -1.0 | 493 | 497 | 114.6 |
| D | 12 | 233 | 19378 | 159.58 | 491 | 480 | 118.4 |
| D | 2 | 14 | 15520 | 127.0 | 491 | 480 | 118.4 |
| D | 2 | 234 | 14065 | 114.71 | 491 | 480 | 118.4 |
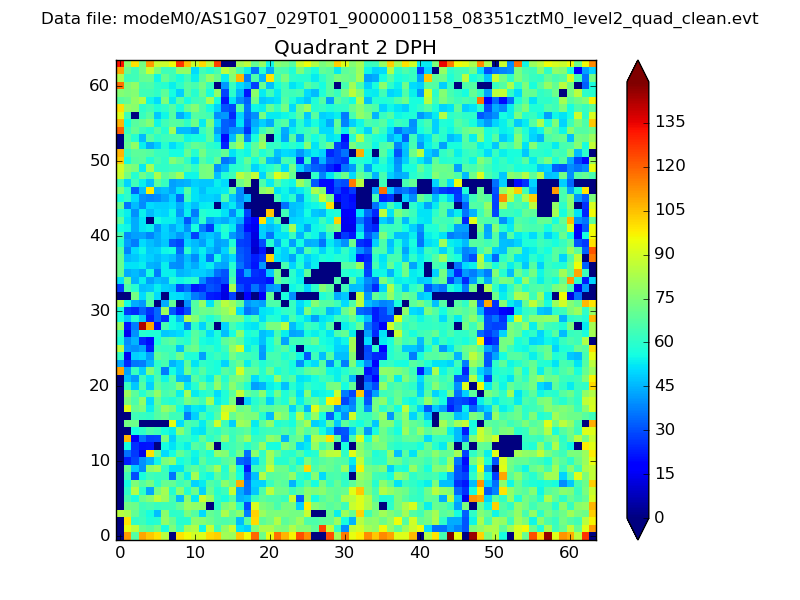
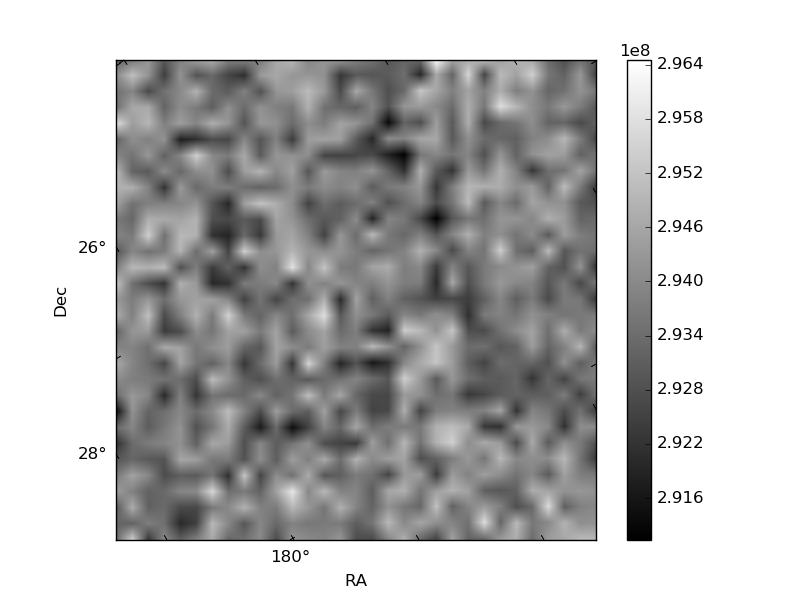
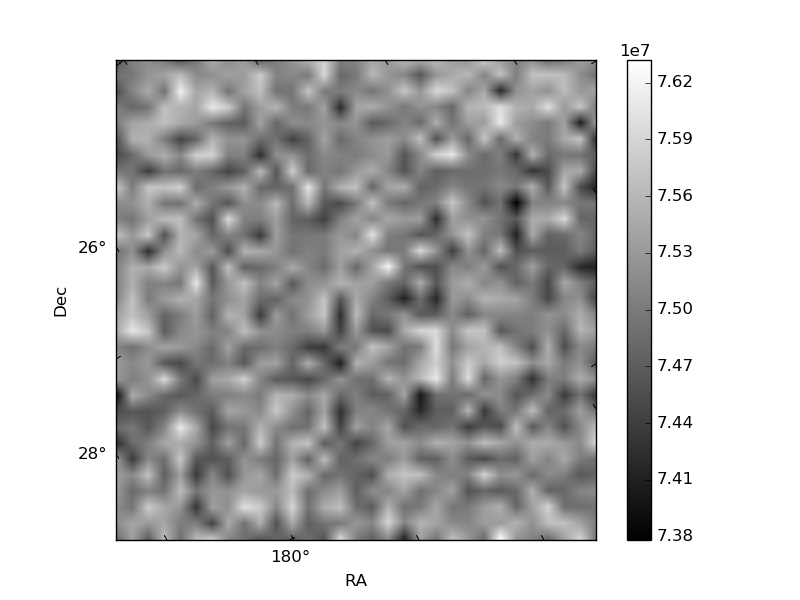
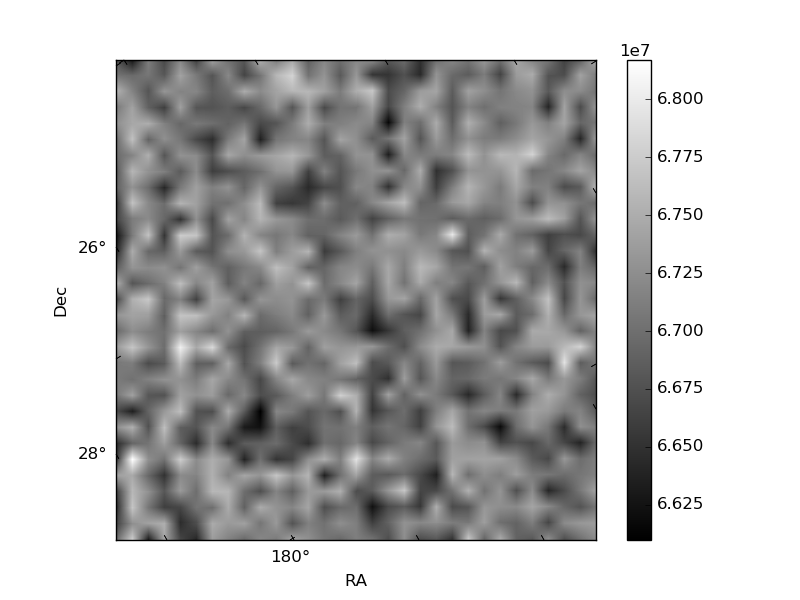
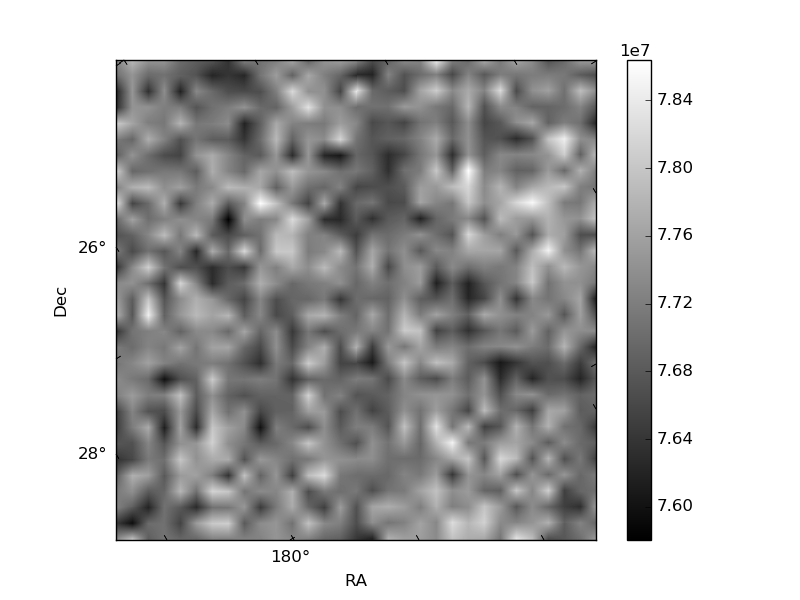
Histogram calculated using DETX and DETY for each event in the final _common_clean file
| Quadrant A | 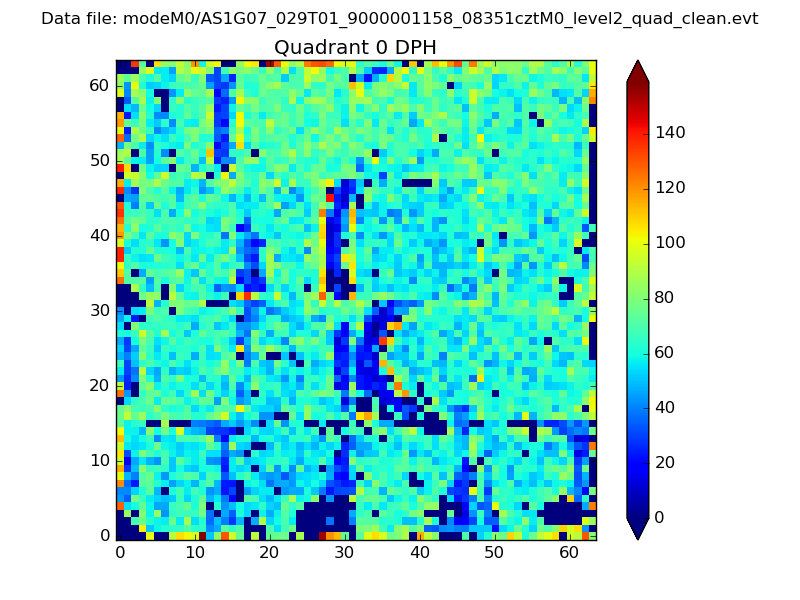 |
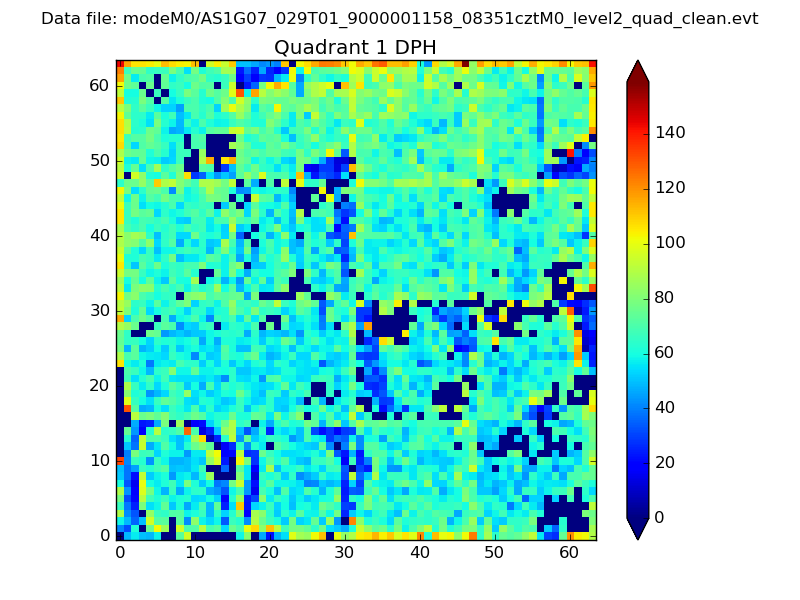 |
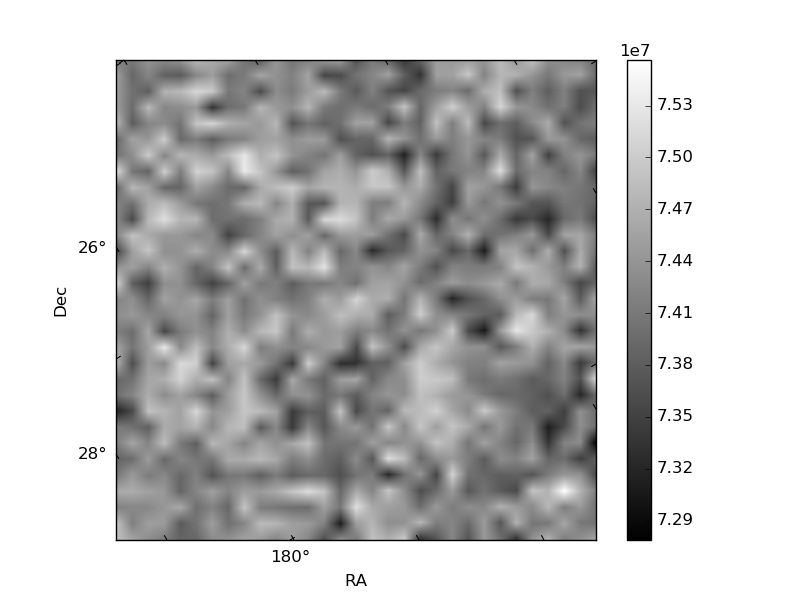
Quadrant B |
|---|---|---|---|
| Quadrant D | 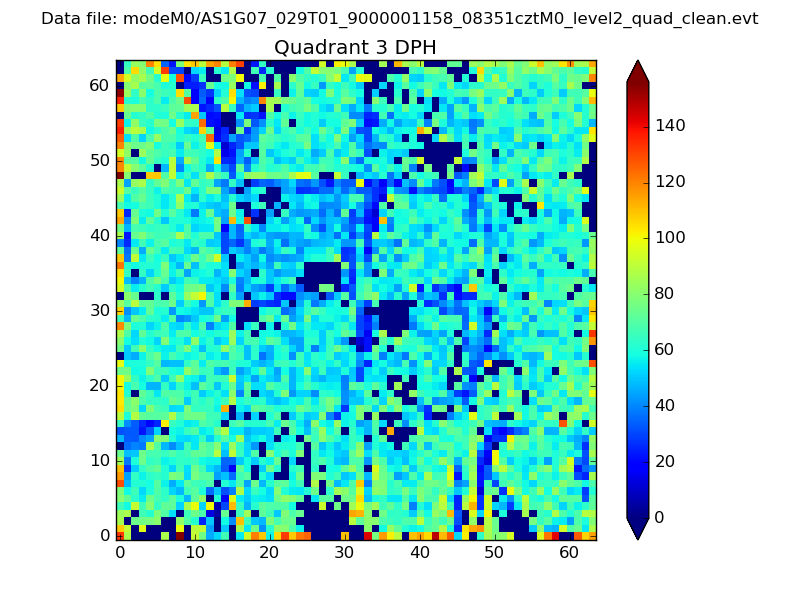 |
 |
Quadrant C |
| Plot type | Count rate plots | Images |
|---|---|---|
| Comparison with Poisson distribution Blue bars denote a histogram of data divided into 1 sec bins. Red curve is a Poisson curve with rate = median count rate of data. |
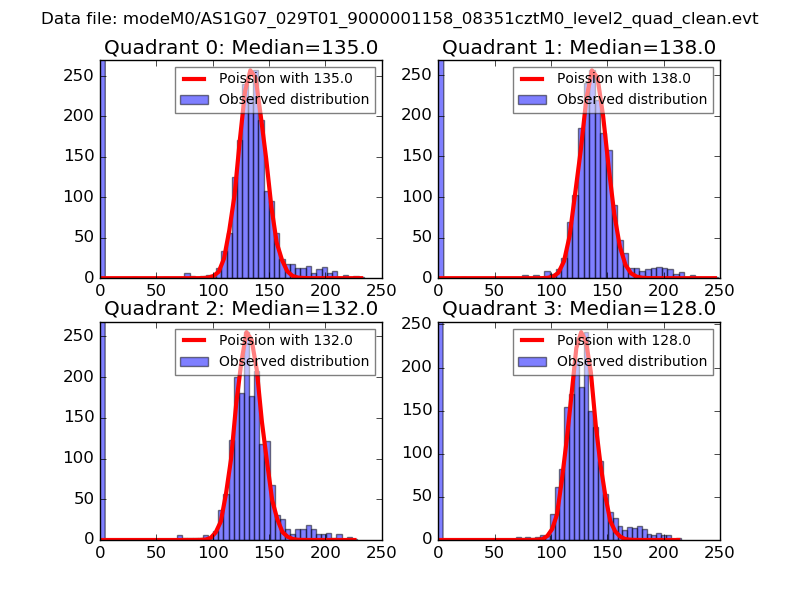 |
 |
| Quadrant-wise count rates Data is divided into 100 sec bins |
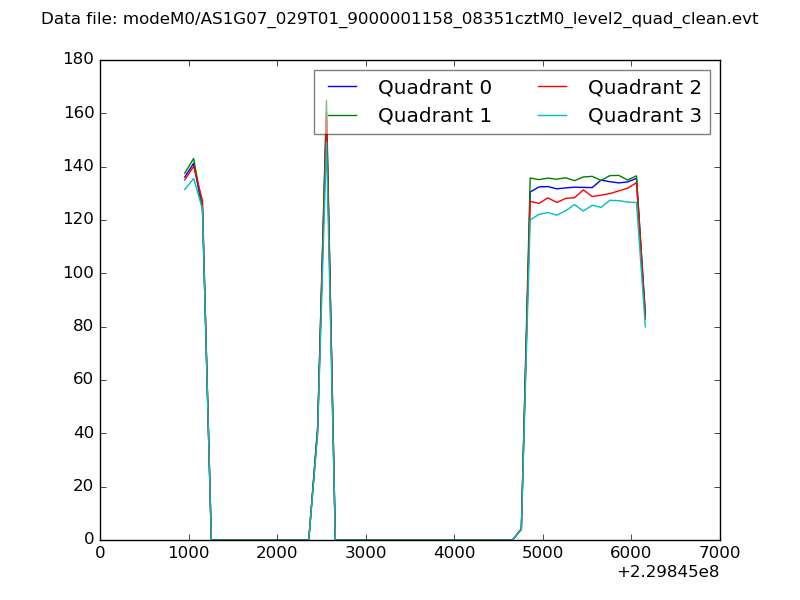 |
|
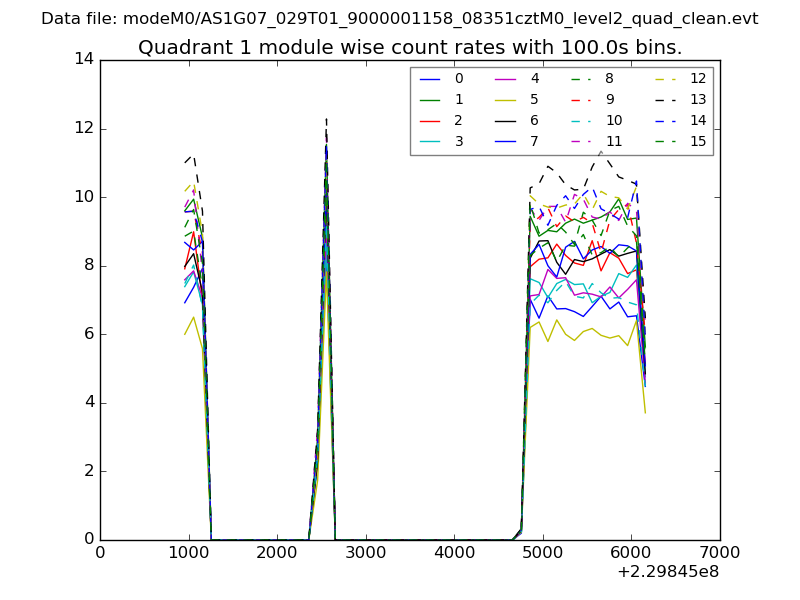
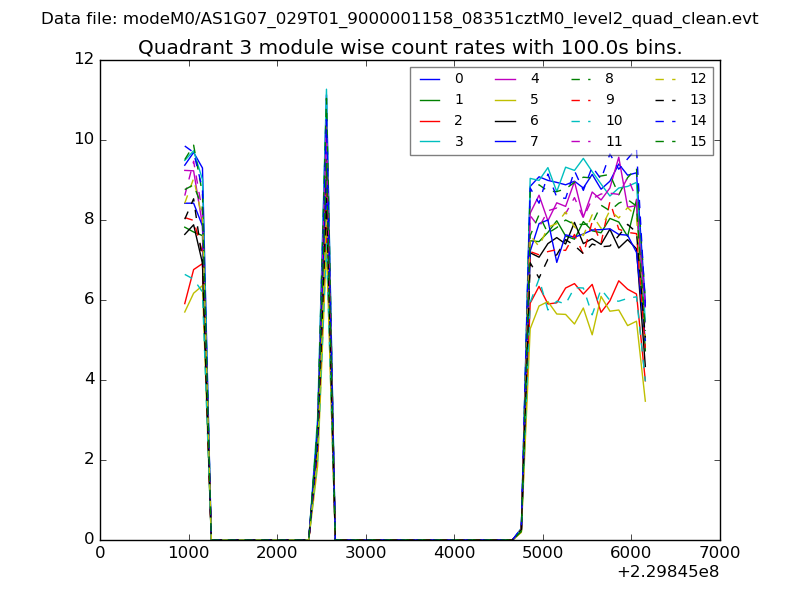
| Module-wise count rates for Quadrant A Data is divided into 100 sec bins |
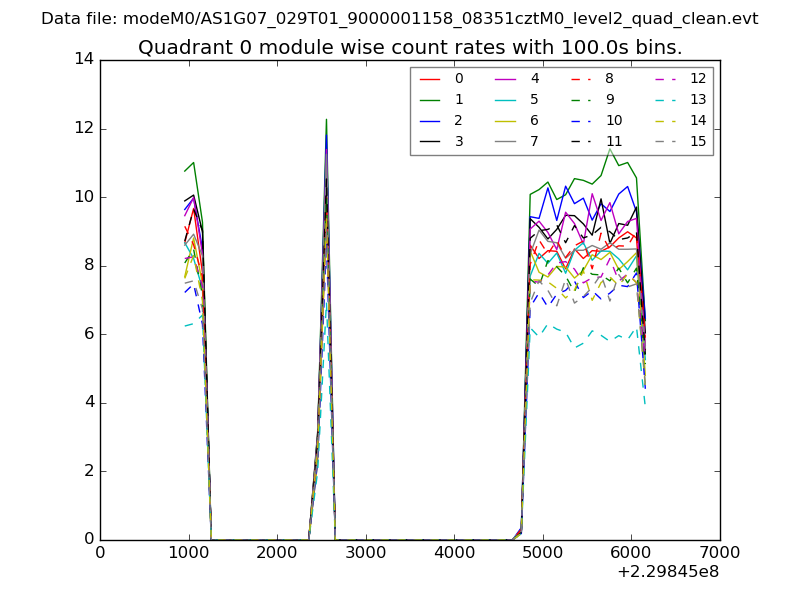 |
 |
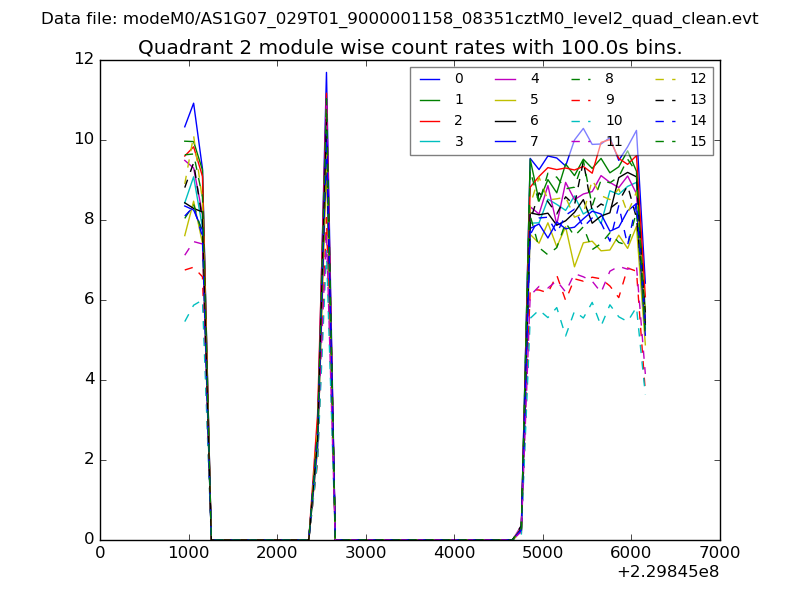
| Module-wise count rates for Quadrant B Data is divided into 100 sec bins |
 |
 |
| Module-wise count rates for Quadrant C Data is divided into 100 sec bins |
 |
 |
| Module-wise count rates for Quadrant D Data is divided into 100 sec bins |
 |
 |
| Parameter | Plot |
|---|---|
| CZT HV Monitor |  |
| D_VDD | 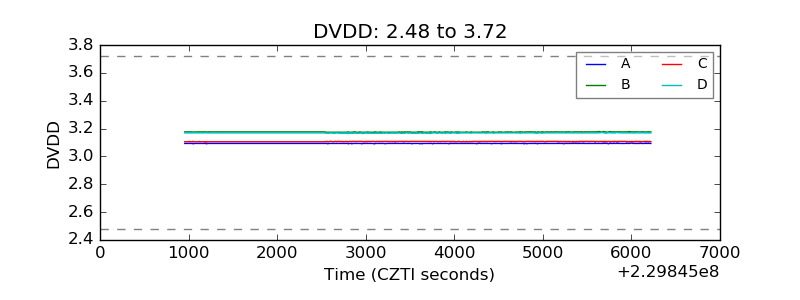 |
| Temperature 1 |  |
| Veto HV Monitor | 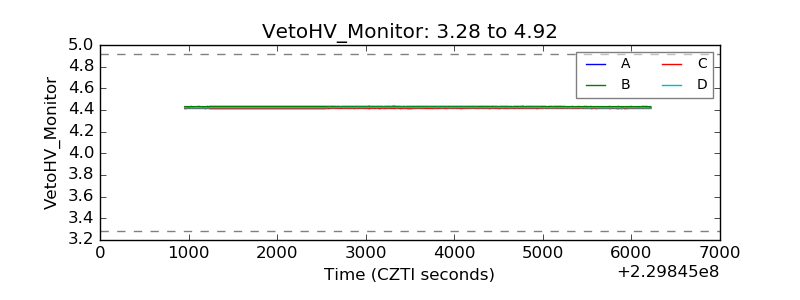 |
| Veto LLD |  |
| Alpha Counter | 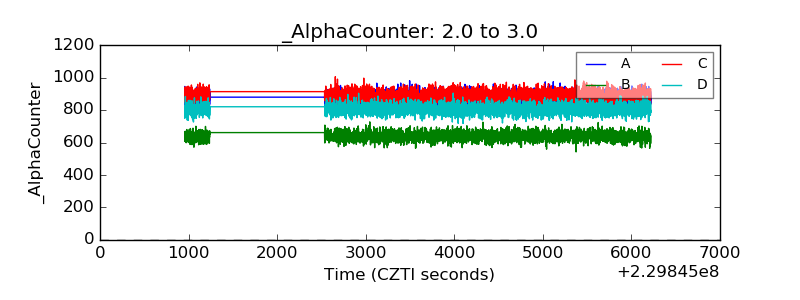 |
| _CPM_Rate | 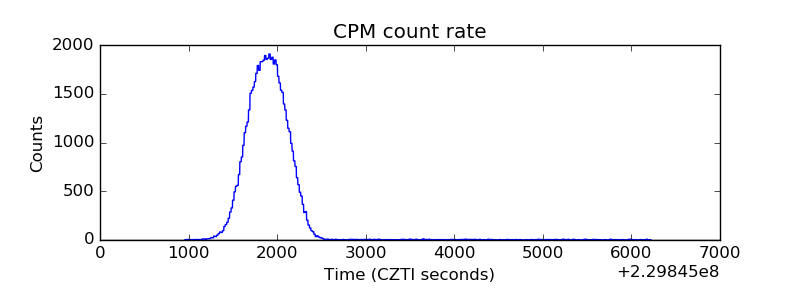 |
| CZT Counter | 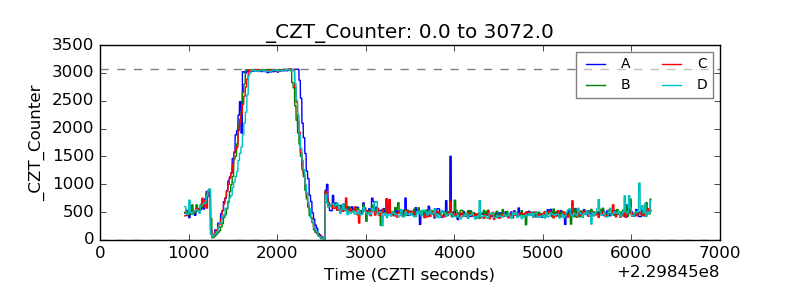 |
| +2.5 Volts monitor |  |
| +5 Volts monitor |  |
| _ROLL_ROT | 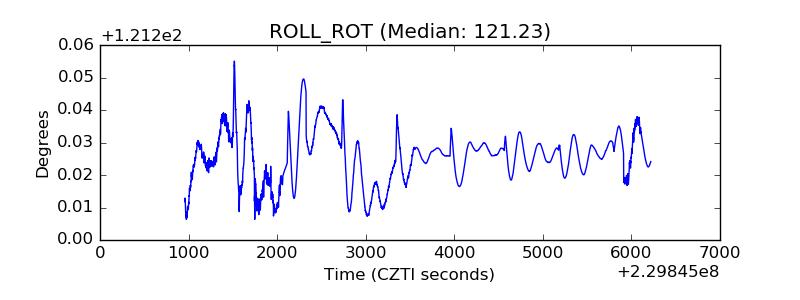 |
| _Roll_DEC | 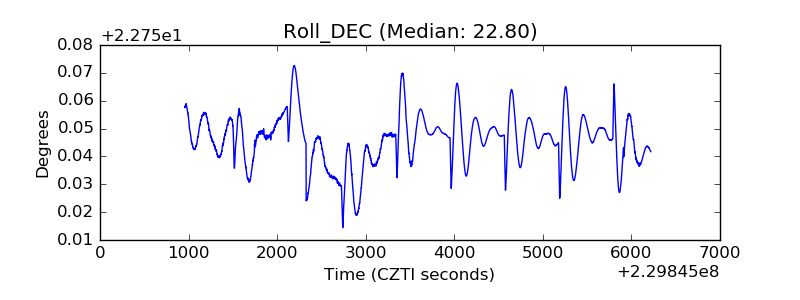 |
| _Roll_RA | 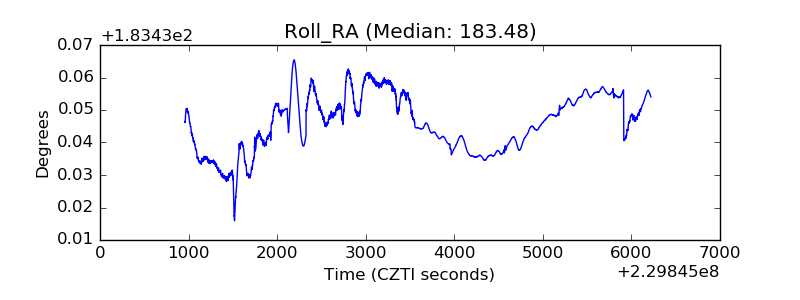 |
| Veto Counter | 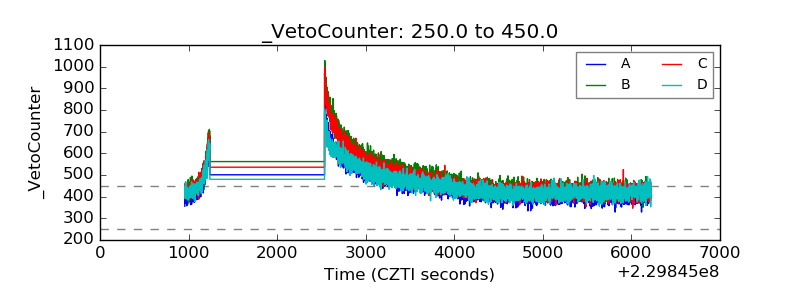 |