| Param | Original file | Final file |
|---|---|---|
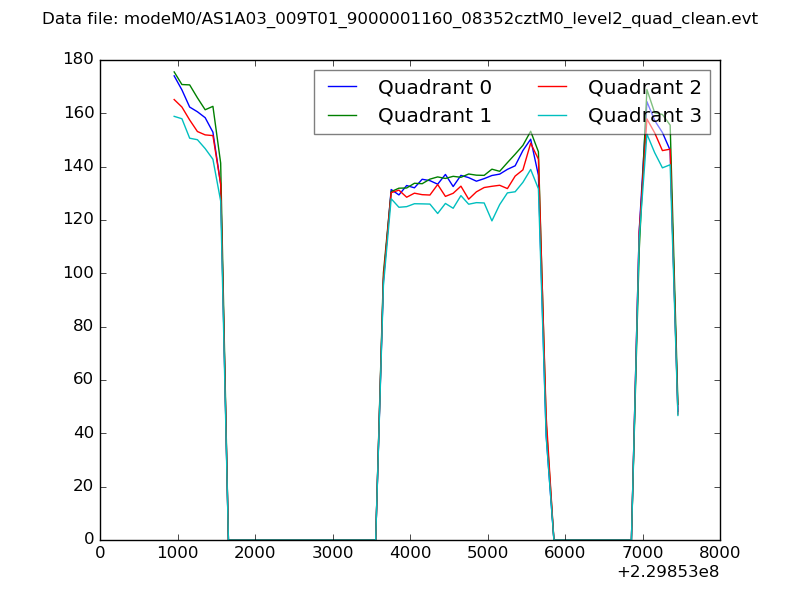
| Filename | modeM0/AS1A03_009T01_9000001160_08352cztM0_level2.evt | modeM0/AS1A03_009T01_9000001160_08352cztM0_level2_quad_clean.evt |
| Size (bytes) | 421,882,560 | 75,873,600 |
| Size | 402.3 MB | 72.4 MB |
| Events in quadrant A | 3,055,666 | 475,973 |
| Events in quadrant B | 3,199,797 | 485,799 |
| Events in quadrant C | 2,962,860 | 464,416 |
| Events in quadrant D | 3,143,538 | 445,353 |
| Mode SS | |||
|---|---|---|---|
| Quadrant | BADHDUFLAG | Total packets | Discarded packets |
| A | 0 | 126 | 0 |
| B | 0 | 126 | 0 |
| C | 0 | 126 | 0 |
| D | 0 | 126 | 0 |
| Mode M0 | |||
|---|---|---|---|
| Quadrant | BADHDUFLAG | Total packets | Discarded packets |
| A | 0 | 12716 | 2 |
| B | 0 | 13081 | 1 |
| C | 0 | 12607 | 1 |
| D | 0 | 13227 | 1 |
| Mode M9 | |||
|---|---|---|---|
| Quadrant | BADHDUFLAG | Total packets | Discarded packets |
| A | 0 | 11 | 0 |
| B | 0 | 11 | 0 |
| C | 0 | 11 | 0 |
| D | 0 | 11 | 0 |
| Quadrant | Total seconds | Saturated seconds | Saturation percentage |
|---|---|---|---|
| A | 6092 | 151 | 2.478661% |
| B | 6092 | 143 | 2.347341% |
| C | 6092 | 116 | 1.904137% |
| D | 6092 | 159 | 2.609980% |
Noise dominated data is calculated using 1-second bins in cleaned event files. If a bin has >2000 counts, and if more than 50% of those come from <1% of pixels, then it is considered to be noise-dominated and hence unusable.
| Quadrant | # 1 sec bins | Bins with >0 counts | Bins with >2000 counts | High rate bins dominated by noise | Noise dominated (total time) | Noise dominated (detector-on time) | Marked lightcurve |
|---|---|---|---|---|---|---|---|
| A | 7282 | 6092 | 4 | 4 | 0.05% | 0.07% | 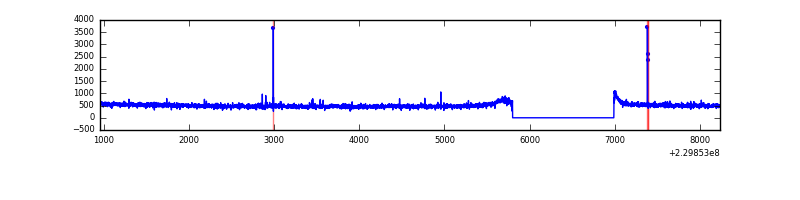 |
| B | 7282 | 6092 | 2 | 2 | 0.03% | 0.03% | 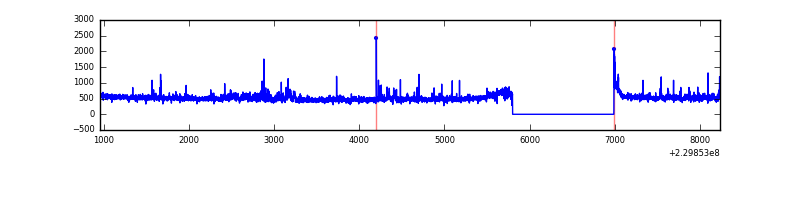 |
| C | 7282 | 6093 | 0 | 0 | 0.00% | 0.00% | 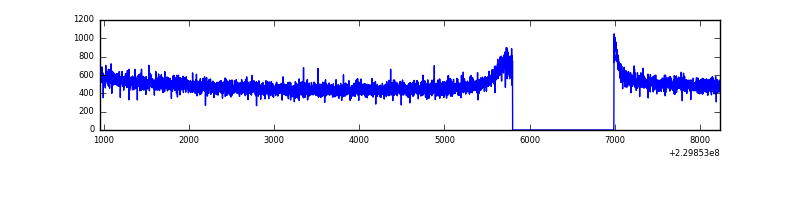 |
| D | 7282 | 6092 | 24 | 24 | 0.33% | 0.39% | 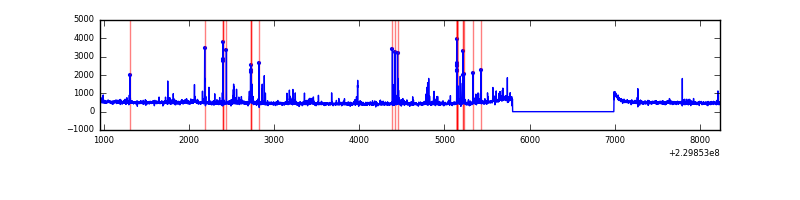 |
Top three noisy pixels from each quadrant. If the there are fewer than three noisy pixels in the level2.evt file, extra rows are filled as -1
| Pixel properties | Quadrant properties | ||||||
|---|---|---|---|---|---|---|---|
| Quadrant | DetID | PixID | Counts | Sigma | Mean | Median | Sigma |
| A | 14 | 111 | 16035 | 96.45 | 782 | 766 | 158.3 |
| A | 15 | 236 | 9664 | 56.21 | 782 | 766 | 158.3 |
| A | 1 | 162 | 8224 | 47.11 | 782 | 766 | 158.3 |
| B | 0 | 214 | 97950 | 666.12 | 779 | 763 | 145.9 |
| B | 4 | 81 | 23044 | 152.71 | 779 | 763 | 145.9 |
| B | 4 | 80 | 18230 | 119.72 | 779 | 763 | 145.9 |
| C | 13 | 61 | 5781 | 28.94 | 759 | 762 | 173.5 |
| C | 3 | 202 | 1926 | 6.71 | 759 | 762 | 173.5 |
| C | 3 | 203 | 1653 | 5.14 | 759 | 762 | 173.5 |
| D | 7 | 71 | 105612 | 561.15 | 755 | 735 | 186.9 |
| D | 2 | 14 | 62822 | 332.2 | 755 | 735 | 186.9 |
| D | 12 | 233 | 59737 | 315.69 | 755 | 735 | 186.9 |
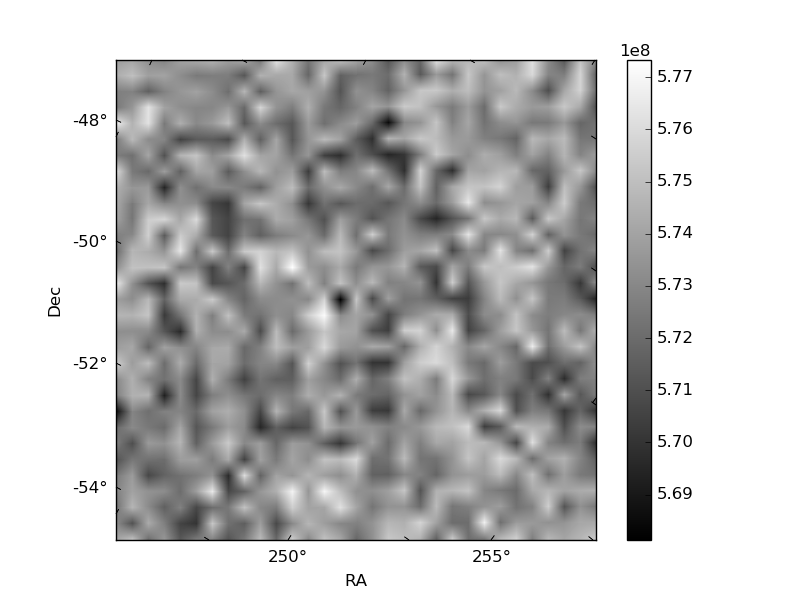
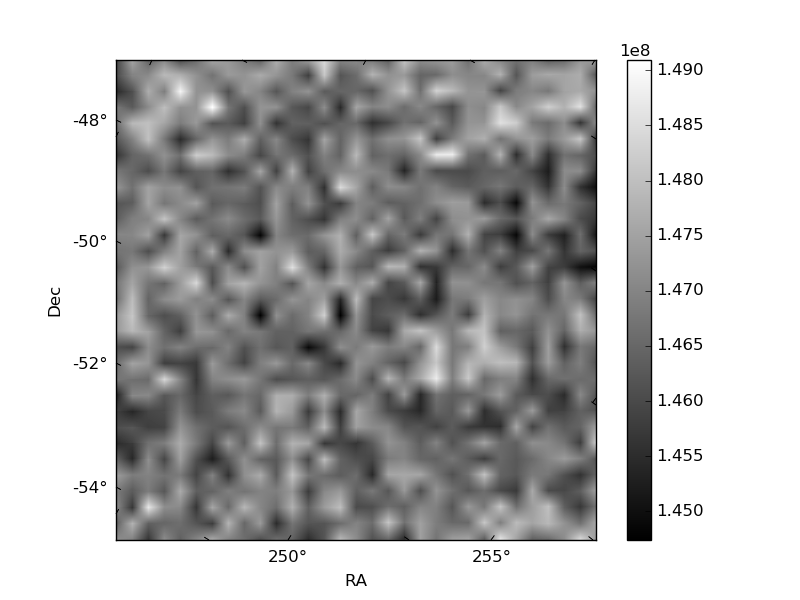
Histogram calculated using DETX and DETY for each event in the final _common_clean file
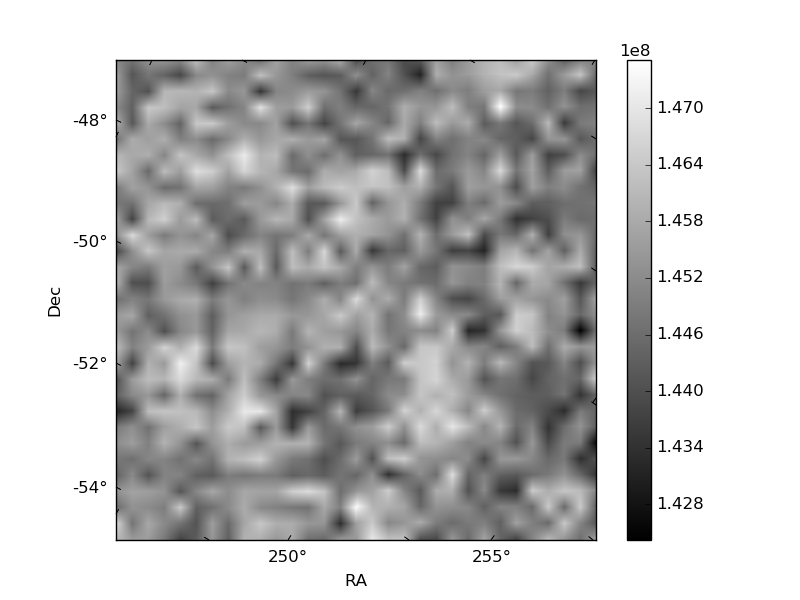
| Quadrant A | 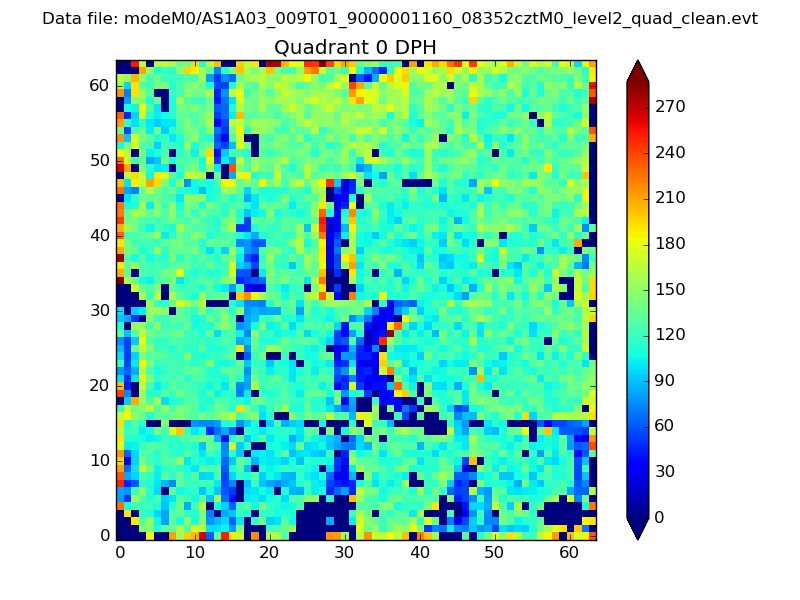 |
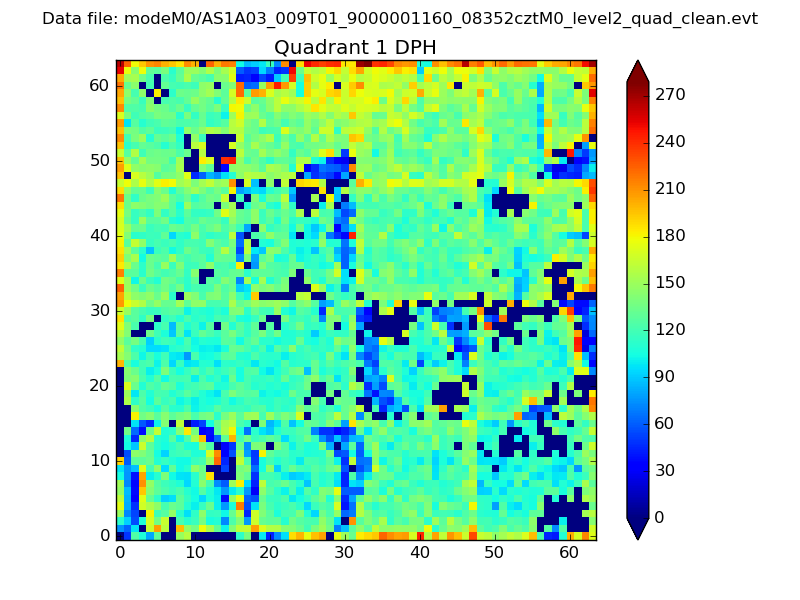 |
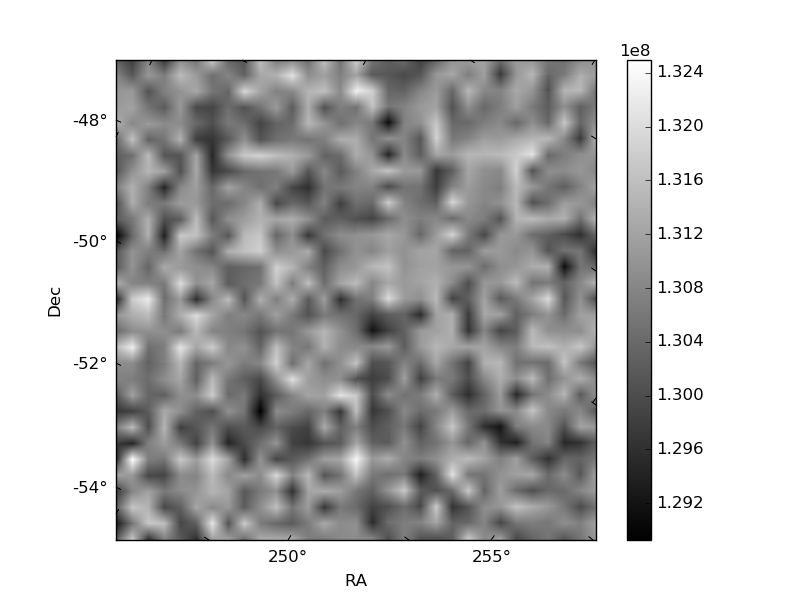
Quadrant B |
|---|---|---|---|
| Quadrant D | 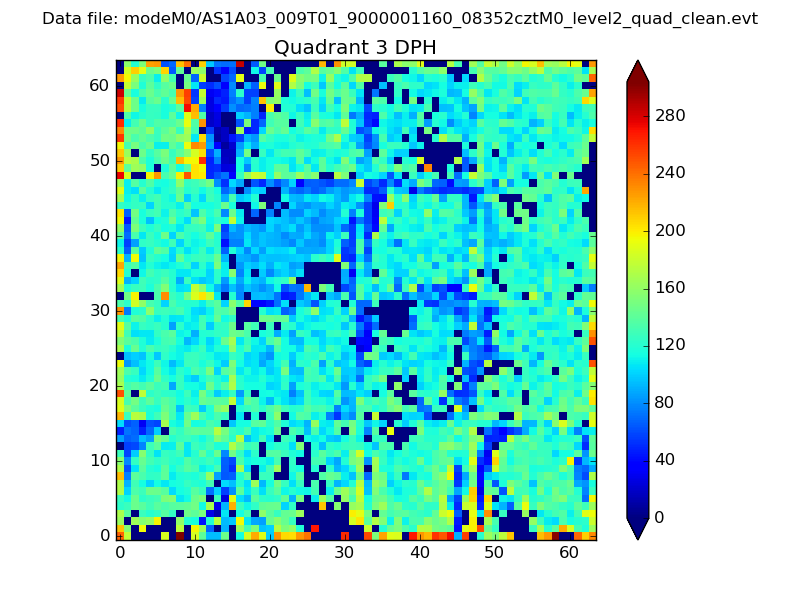 |
 |
Quadrant C |
| Plot type | Count rate plots | Images |
|---|---|---|
| Comparison with Poisson distribution Blue bars denote a histogram of data divided into 1 sec bins. Red curve is a Poisson curve with rate = median count rate of data. |
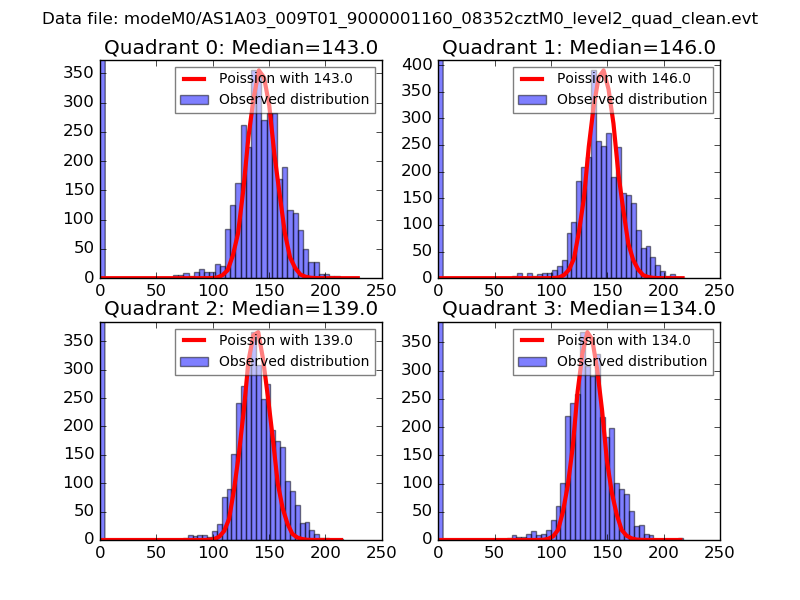 |
 |
| Quadrant-wise count rates Data is divided into 100 sec bins |
 |
|
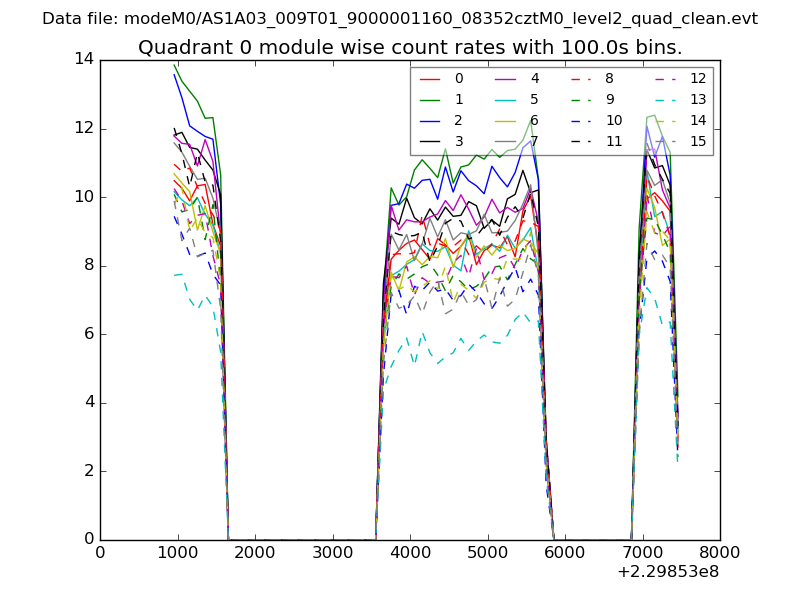
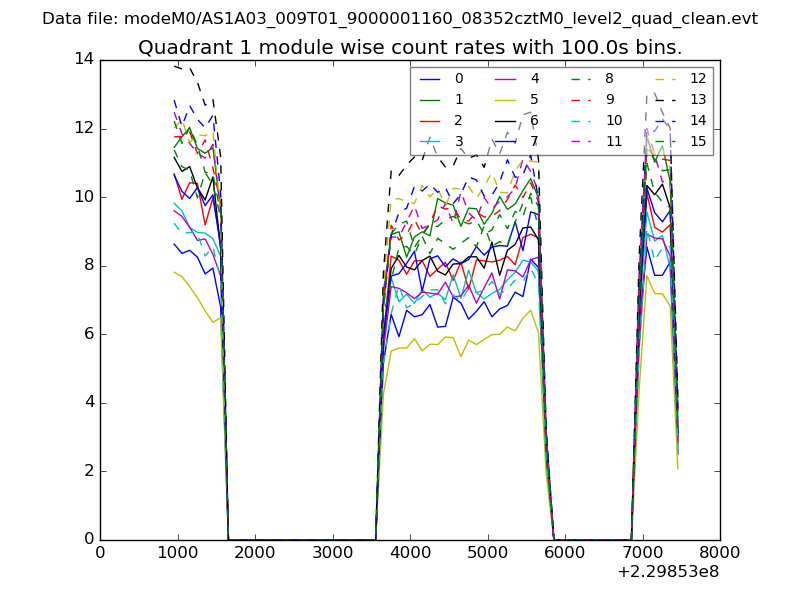
| Module-wise count rates for Quadrant A Data is divided into 100 sec bins |
 |
 |
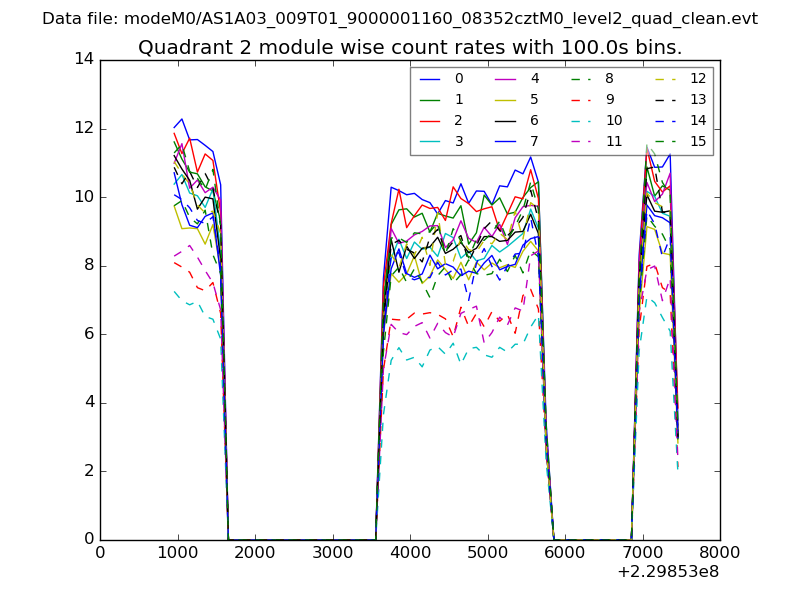
| Module-wise count rates for Quadrant B Data is divided into 100 sec bins |
 |
 |
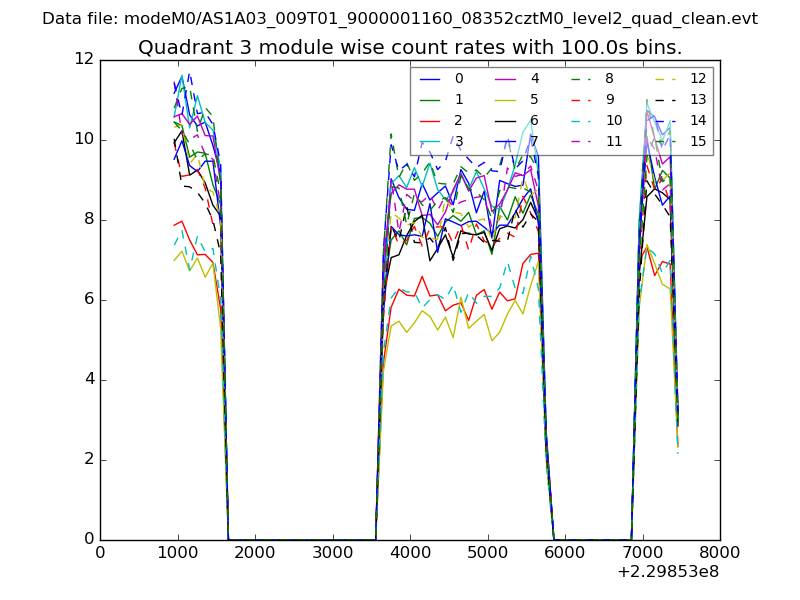
| Module-wise count rates for Quadrant C Data is divided into 100 sec bins |
 |
 |
| Module-wise count rates for Quadrant D Data is divided into 100 sec bins |
 |
 |
| Parameter | Plot |
|---|---|
| CZT HV Monitor | 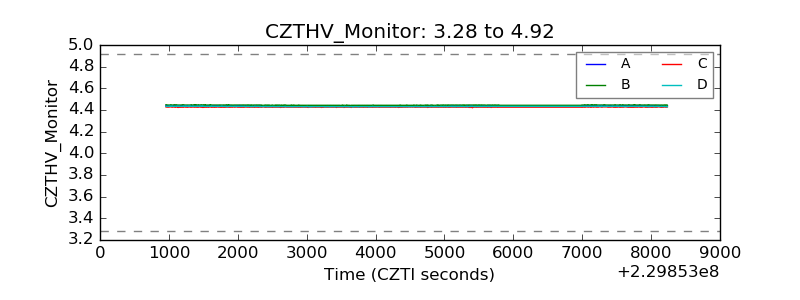 |
| D_VDD | 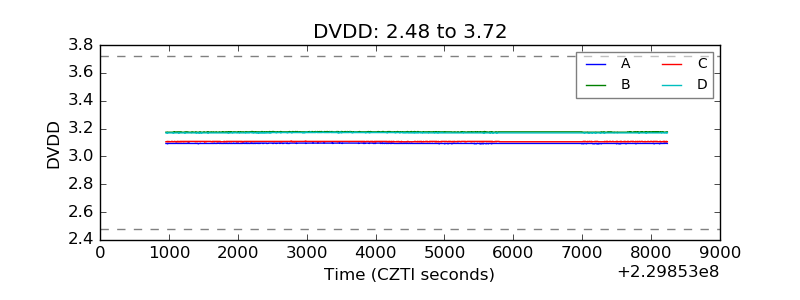 |
| Temperature 1 | 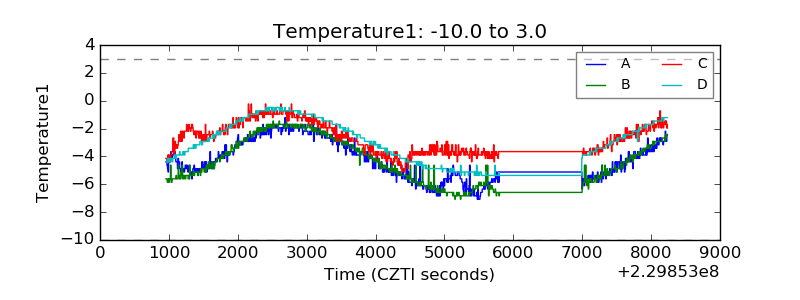 |
| Veto HV Monitor | 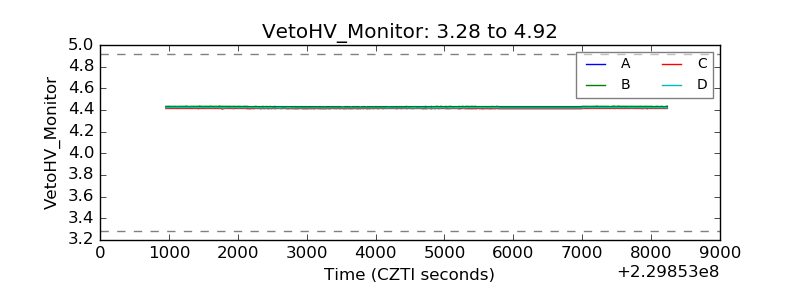 |
| Veto LLD | 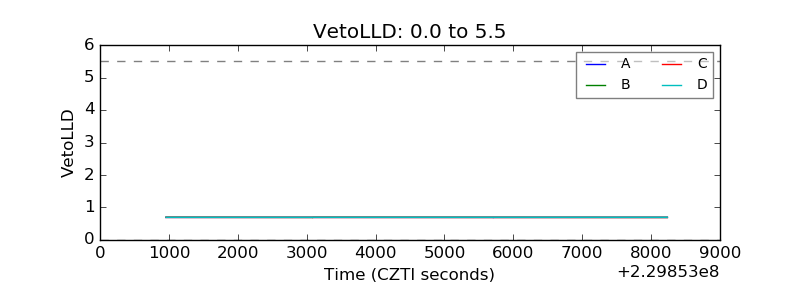 |
| Alpha Counter | 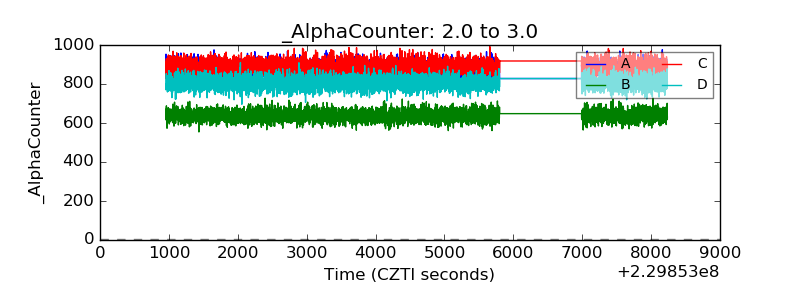 |
| _CPM_Rate | 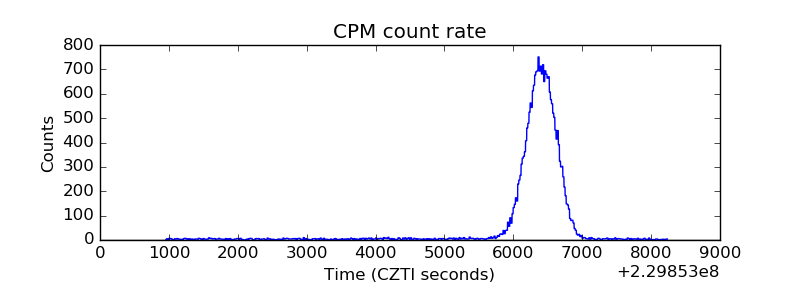 |
| CZT Counter |  |
| +2.5 Volts monitor | 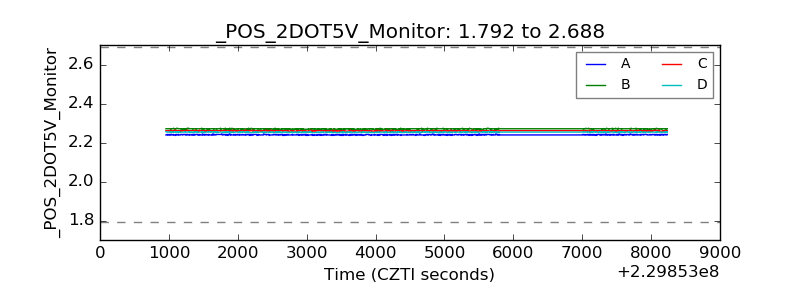 |
| +5 Volts monitor |  |
| _ROLL_ROT | 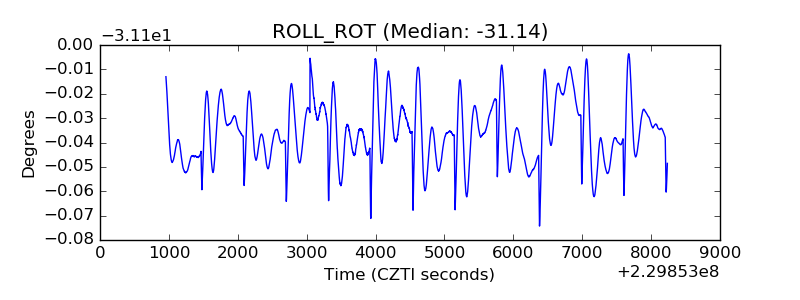 |
| _Roll_DEC | 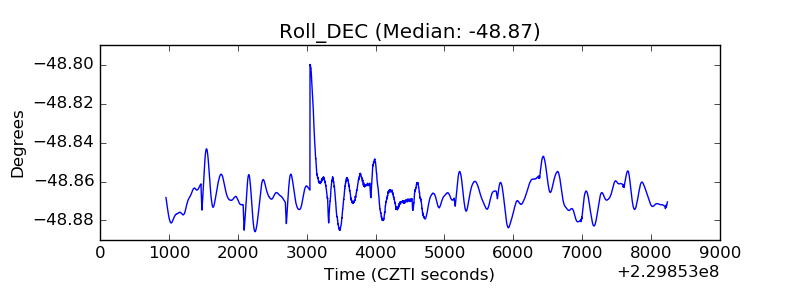 |
| _Roll_RA | 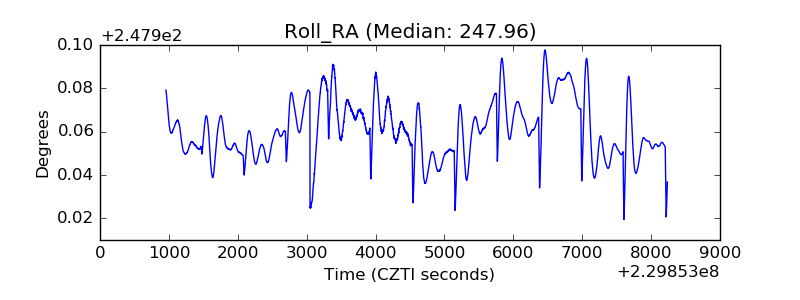 |
| Veto Counter | 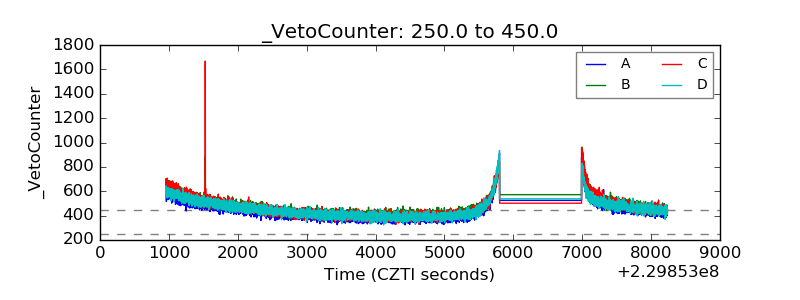 |