| Param | Original file | Final file |
|---|---|---|
| Filename | modeM0/AS1A03_009T01_9000001160_08354cztM0_level2.evt | modeM0/AS1A03_009T01_9000001160_08354cztM0_level2_quad_clean.evt |
| Size (bytes) | 605,355,840 | 72,276,480 |
| Size | 577.3 MB | 68.9 MB |
| Events in quadrant A | 4,310,071 | 445,217 |
| Events in quadrant B | 3,621,057 | 457,637 |
| Events in quadrant C | 3,330,513 | 439,676 |
| Events in quadrant D | 6,582,958 | 343,686 |
| Mode SS | |||
|---|---|---|---|
| Quadrant | BADHDUFLAG | Total packets | Discarded packets |
| A | 0 | 146 | 0 |
| B | 0 | 146 | 0 |
| C | 0 | 146 | 0 |
| D | 0 | 146 | 0 |
| Mode M0 | |||
|---|---|---|---|
| Quadrant | BADHDUFLAG | Total packets | Discarded packets |
| A | 0 | 17594 | 3 |
| B | 0 | 15345 | 2 |
| C | 0 | 14876 | 2 |
| D | 0 | 24329 | 2 |
| Mode M9 | |||
|---|---|---|---|
| Quadrant | BADHDUFLAG | Total packets | Discarded packets |
| A | 0 | 10 | 0 |
| B | 0 | 10 | 0 |
| C | 0 | 10 | 0 |
| D | 0 | 11 | 0 |
| Quadrant | Total seconds | Saturated seconds | Saturation percentage |
|---|---|---|---|
| A | 7204 | 342 | 4.747363% |
| B | 7204 | 145 | 2.012771% |
| C | 7204 | 94 | 1.304831% |
| D | 7204 | 1191 | 16.532482% |
Noise dominated data is calculated using 1-second bins in cleaned event files. If a bin has >2000 counts, and if more than 50% of those come from <1% of pixels, then it is considered to be noise-dominated and hence unusable.
| Quadrant | # 1 sec bins | Bins with >0 counts | Bins with >2000 counts | High rate bins dominated by noise | Noise dominated (total time) | Noise dominated (detector-on time) | Marked lightcurve |
|---|---|---|---|---|---|---|---|
| A | 7879 | 7204 | 122 | 122 | 1.55% | 1.69% | 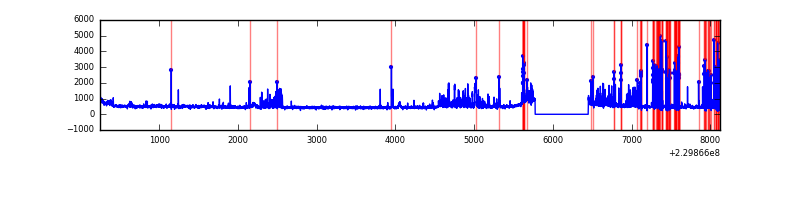 |
| B | 7879 | 7205 | 3 | 3 | 0.04% | 0.04% | 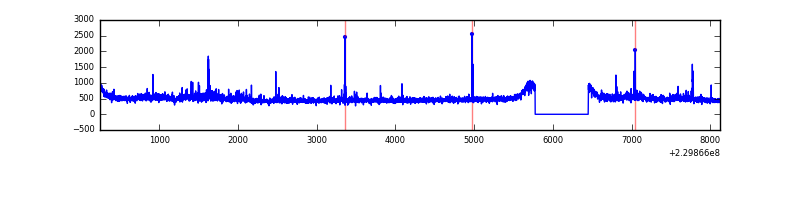 |
| C | 7879 | 7205 | 0 | 0 | 0.00% | 0.00% | 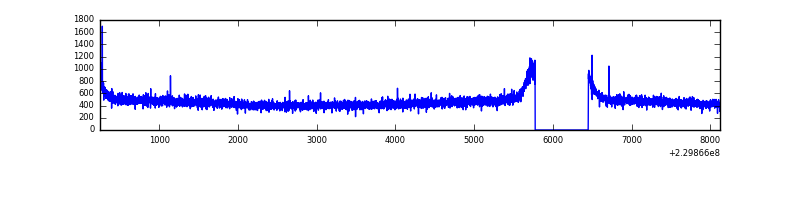 |
| D | 7879 | 7205 | 961 | 961 | 12.20% | 13.34% | 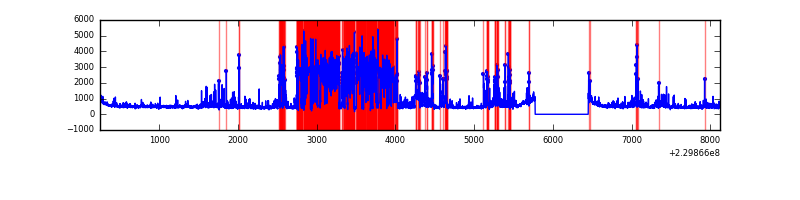 |
Top three noisy pixels from each quadrant. If the there are fewer than three noisy pixels in the level2.evt file, extra rows are filled as -1
| Pixel properties | Quadrant properties | ||||||
|---|---|---|---|---|---|---|---|
| Quadrant | DetID | PixID | Counts | Sigma | Mean | Median | Sigma |
| A | 15 | 239 | 793646 | 4494.41 | 863 | 845 | 176.4 |
| A | 15 | 236 | 157172 | 886.22 | 863 | 845 | 176.4 |
| A | 1 | 162 | 16466 | 88.56 | 863 | 845 | 176.4 |
| B | 0 | 214 | 143981 | 859.13 | 878 | 855 | 166.6 |
| B | 4 | 173 | 18890 | 108.25 | 878 | 855 | 166.6 |
| B | 12 | 111 | 17796 | 101.69 | 878 | 855 | 166.6 |
| C | 13 | 61 | 6506 | 28.58 | 851 | 856 | 197.7 |
| C | 8 | 128 | 5304 | 22.5 | 851 | 856 | 197.7 |
| C | 8 | 112 | 2925 | 10.46 | 851 | 856 | 197.7 |
| D | 1 | 52 | 2750573 | 13542.39 | 786 | 766 | 203.1 |
| D | 2 | 152 | 302036 | 1483.71 | 786 | 766 | 203.1 |
| D | 2 | 14 | 294875 | 1448.44 | 786 | 766 | 203.1 |
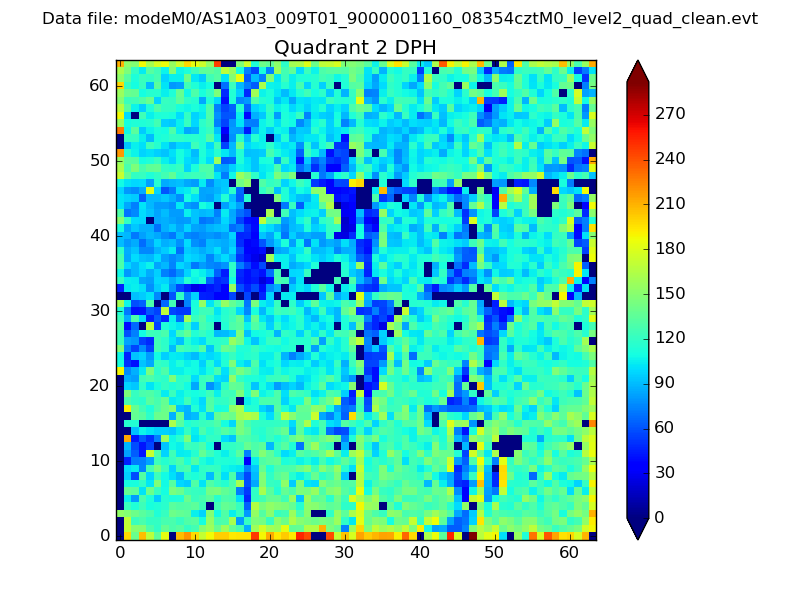
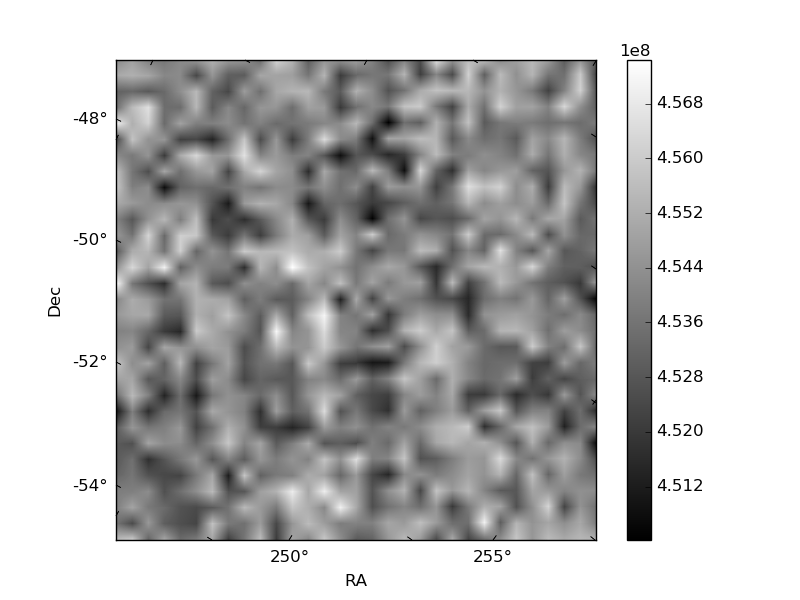
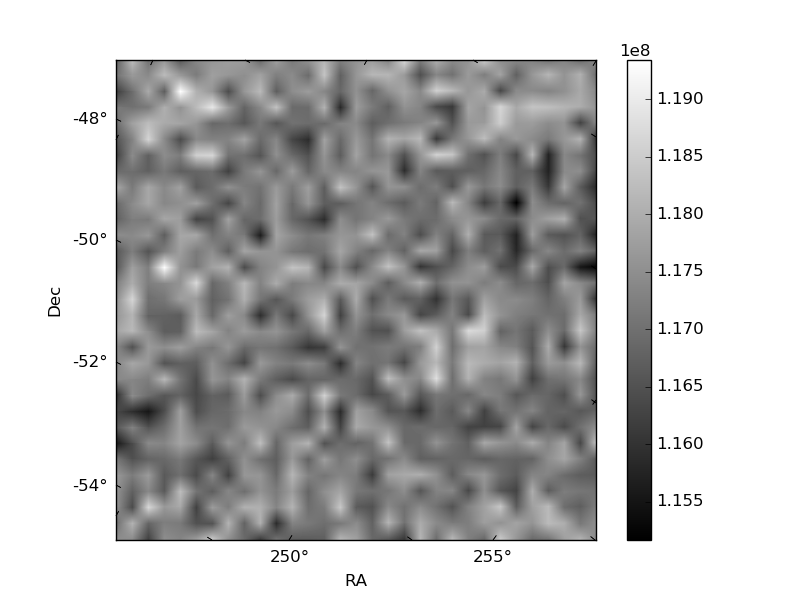
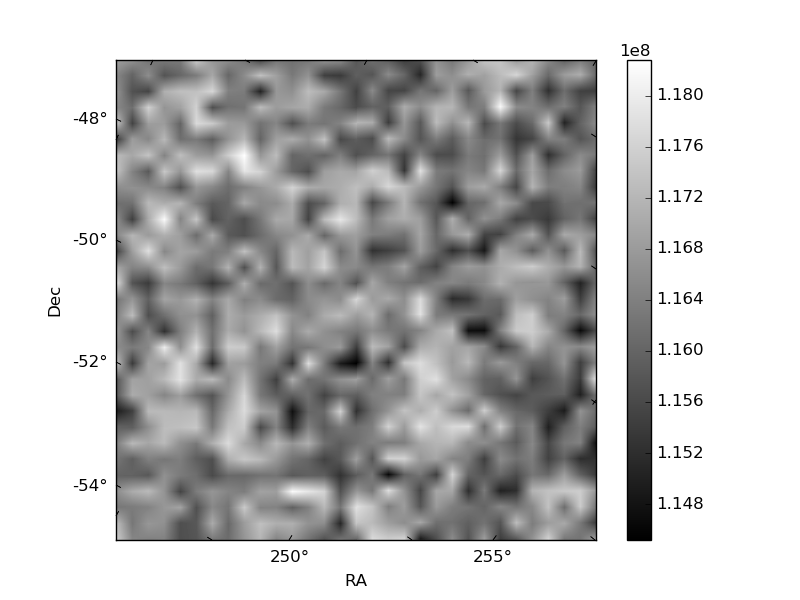
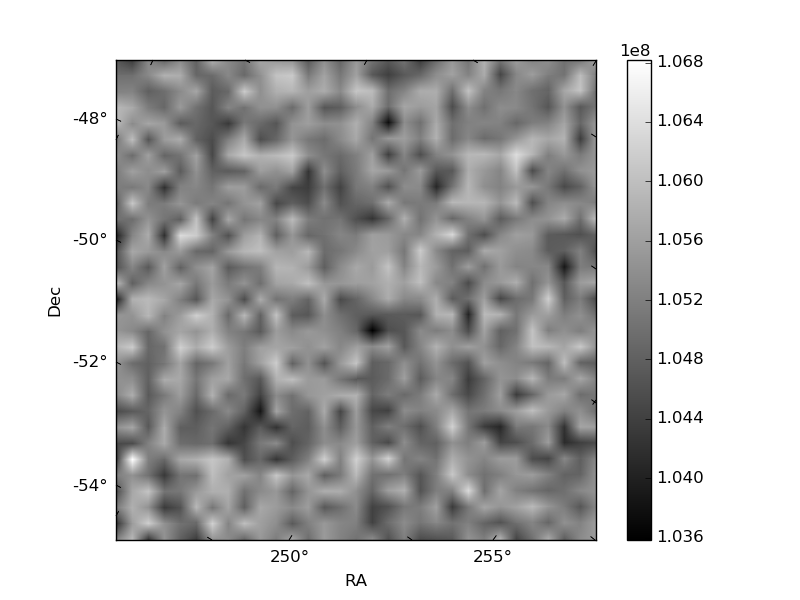
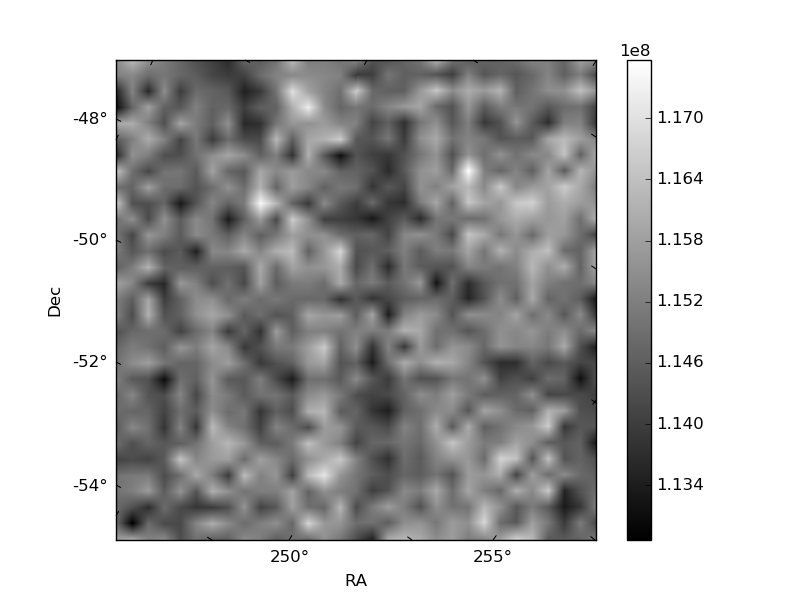
Histogram calculated using DETX and DETY for each event in the final _common_clean file
| Quadrant A | 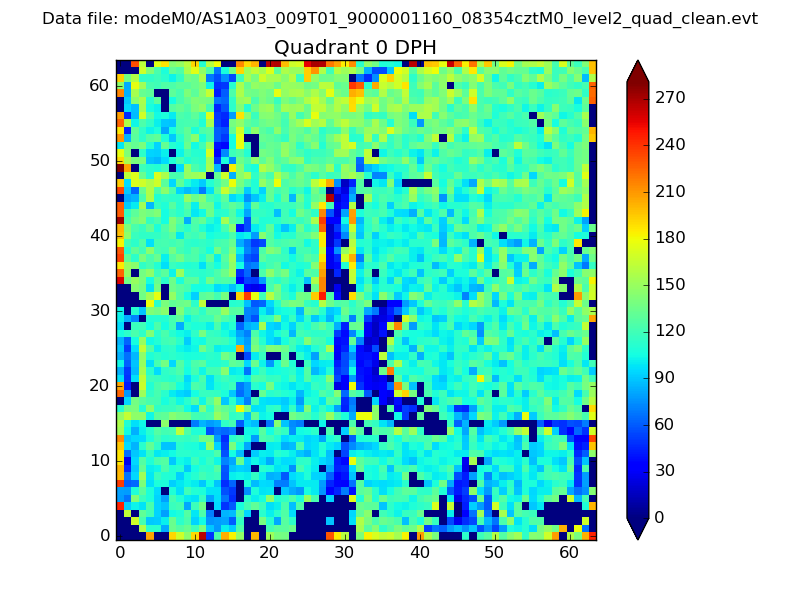 |
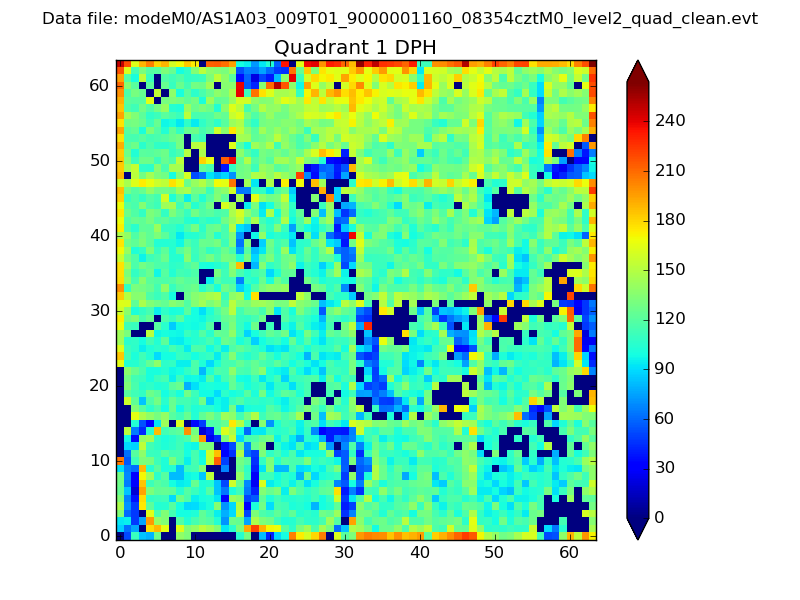 |
Quadrant B |
|---|---|---|---|
| Quadrant D | 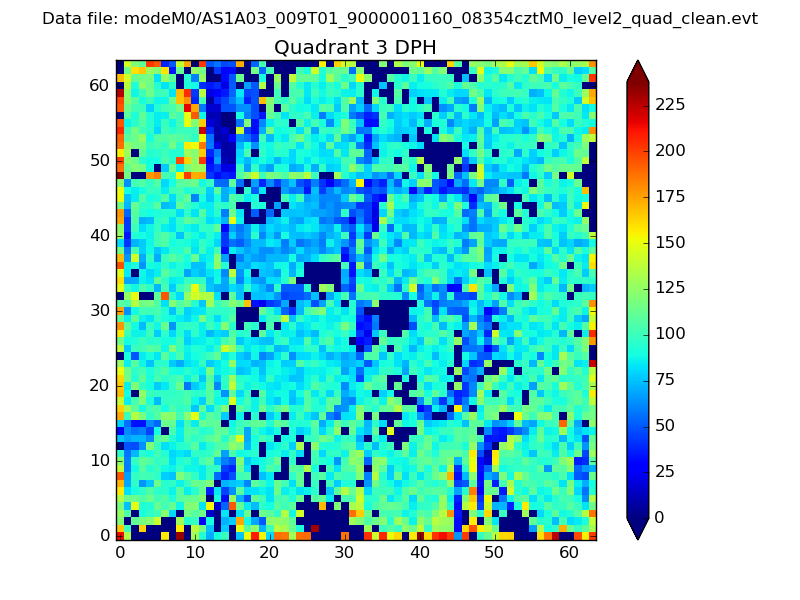 |
 |
Quadrant C |
| Plot type | Count rate plots | Images |
|---|---|---|
| Comparison with Poisson distribution Blue bars denote a histogram of data divided into 1 sec bins. Red curve is a Poisson curve with rate = median count rate of data. |
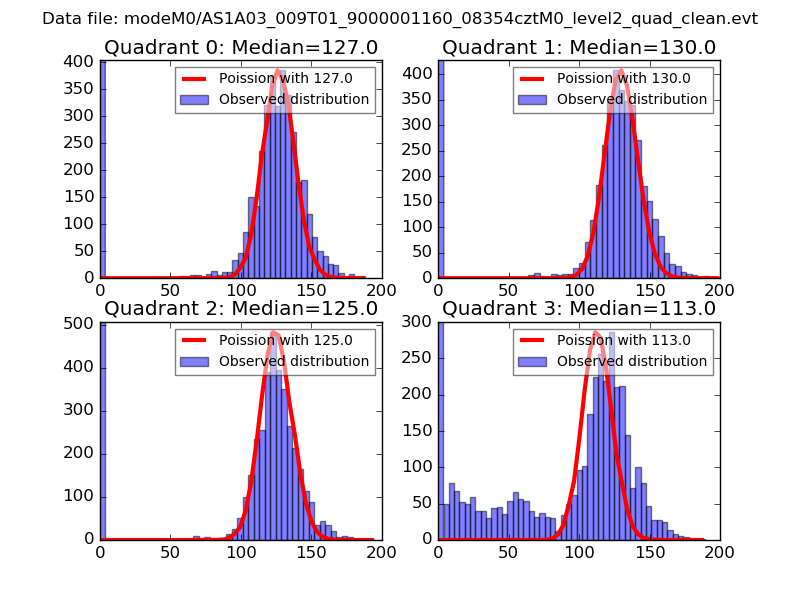 |
 |
| Quadrant-wise count rates Data is divided into 100 sec bins |
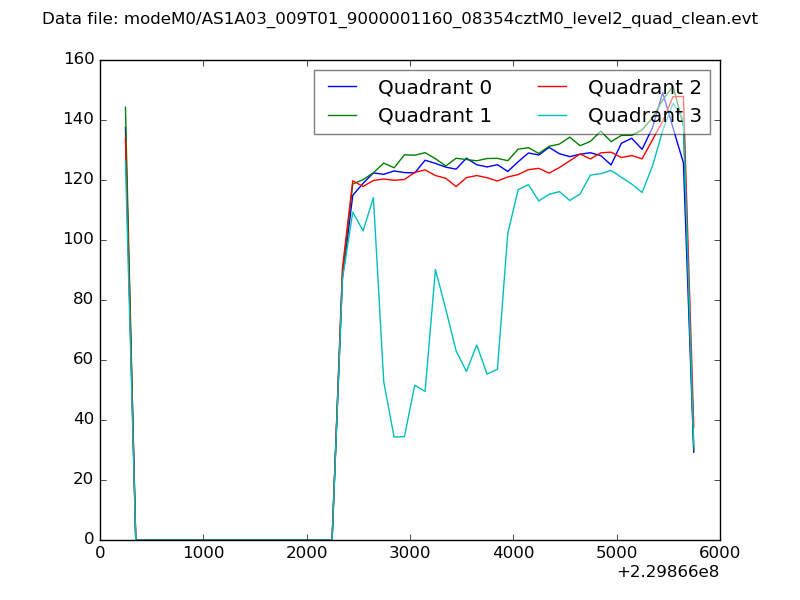 |
|
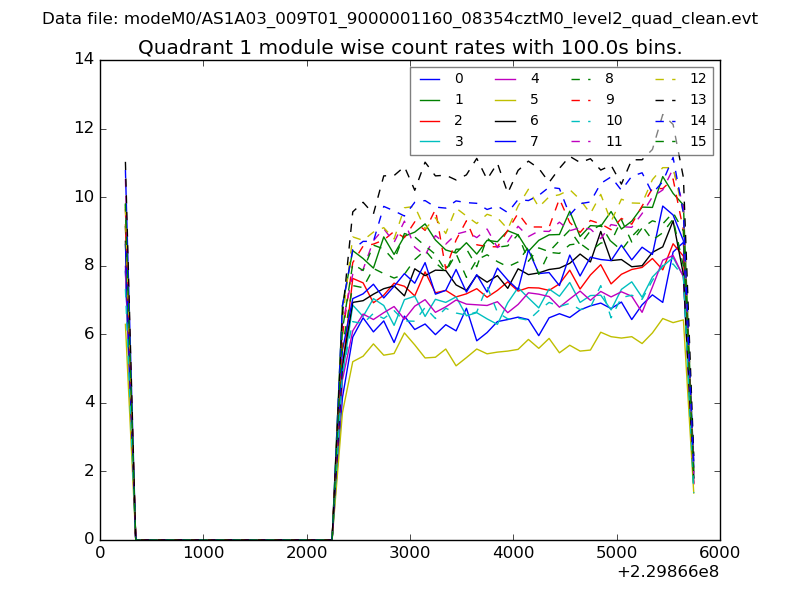
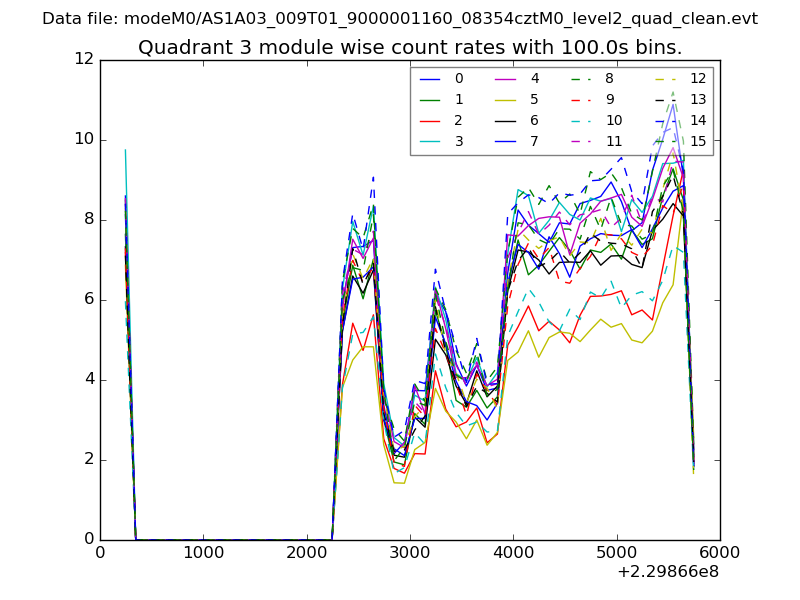
| Module-wise count rates for Quadrant A Data is divided into 100 sec bins |
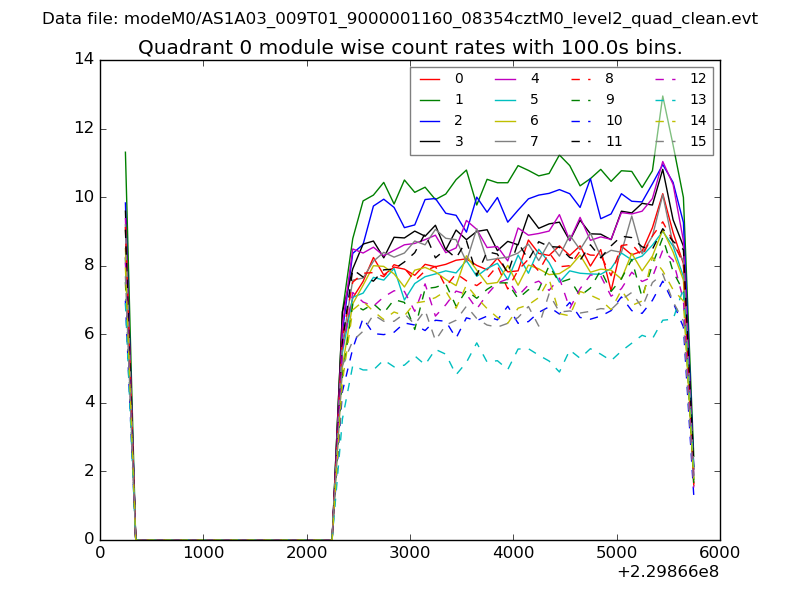 |
 |
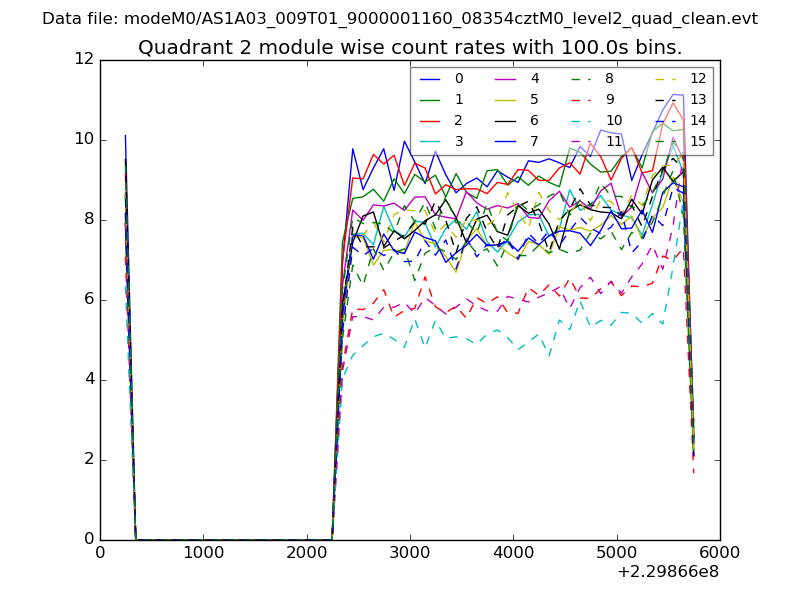
| Module-wise count rates for Quadrant B Data is divided into 100 sec bins |
 |
 |
| Module-wise count rates for Quadrant C Data is divided into 100 sec bins |
 |
 |
| Module-wise count rates for Quadrant D Data is divided into 100 sec bins |
 |
 |
| Parameter | Plot |
|---|---|
| CZT HV Monitor | 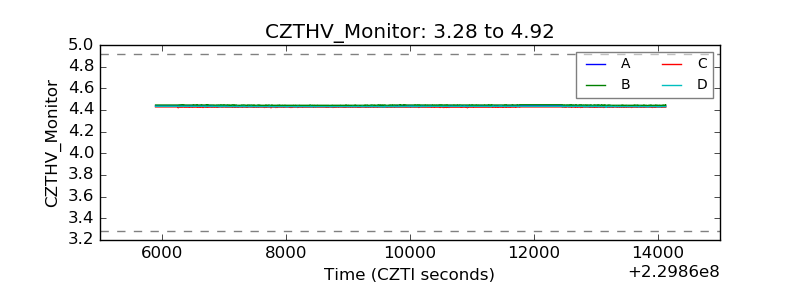 |
| D_VDD | 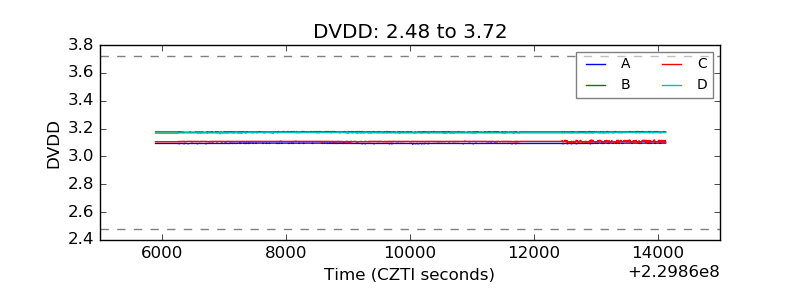 |
| Temperature 1 | 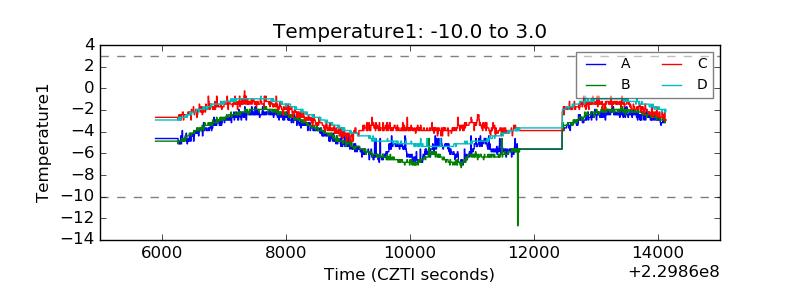 |
| Veto HV Monitor | 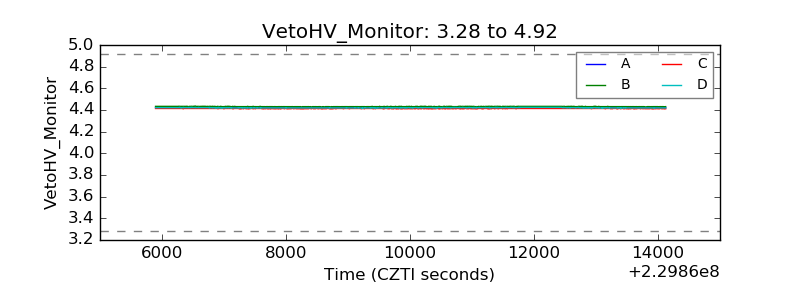 |
| Veto LLD | 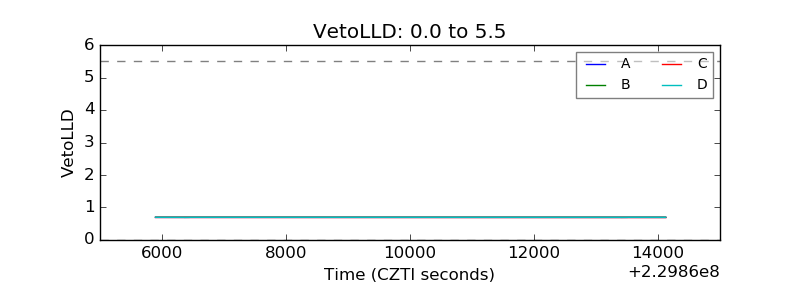 |
| Alpha Counter | 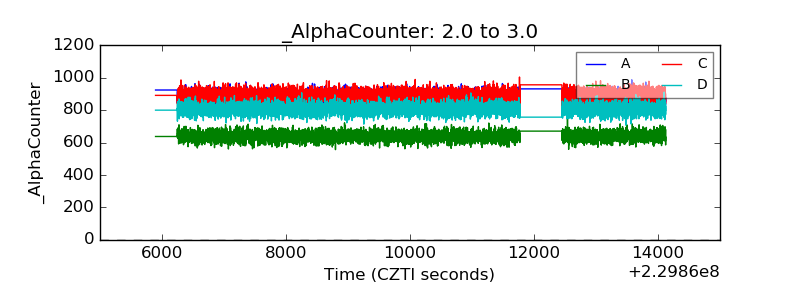 |
| _CPM_Rate | 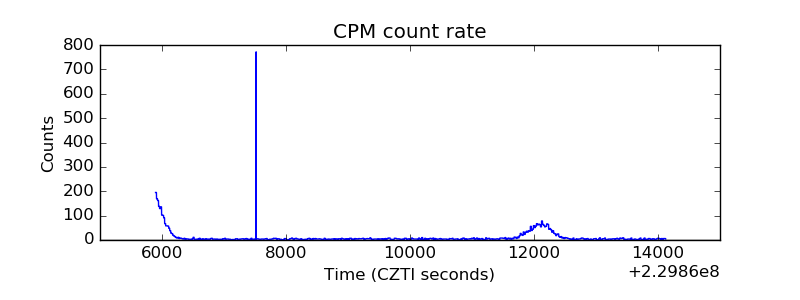 |
| CZT Counter | 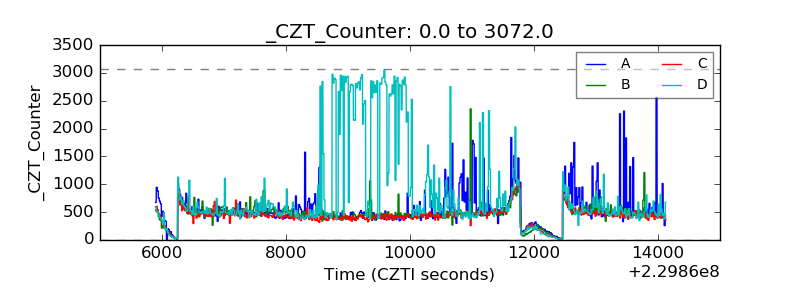 |
| +2.5 Volts monitor | 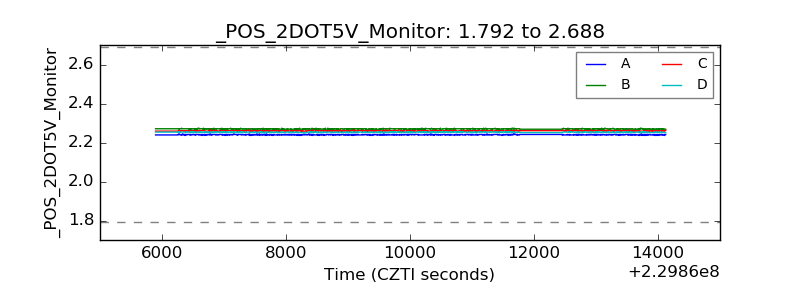 |
| +5 Volts monitor | 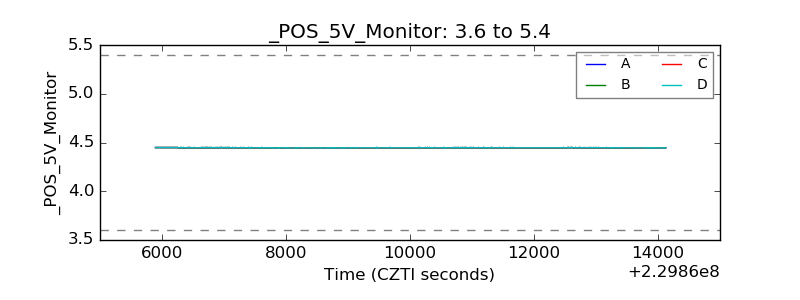 |
| _ROLL_ROT | 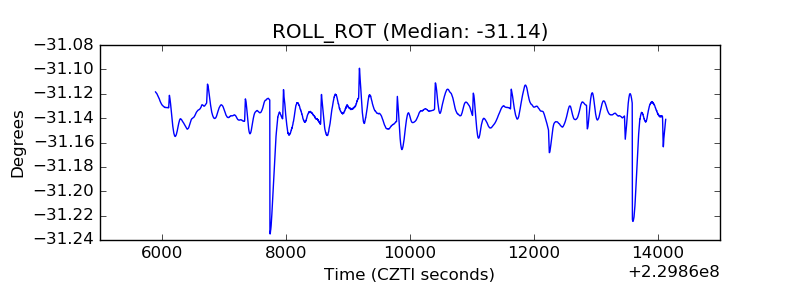 |
| _Roll_DEC | 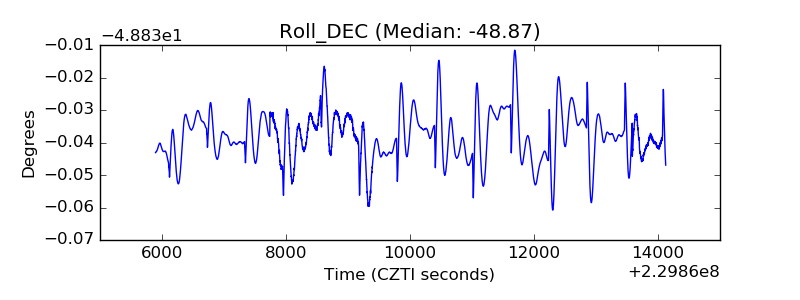 |
| _Roll_RA | 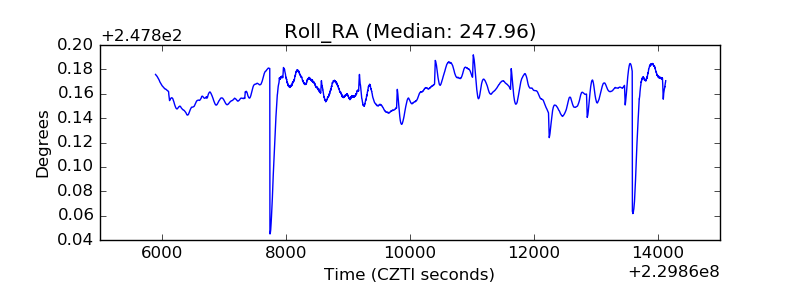 |
| Veto Counter | 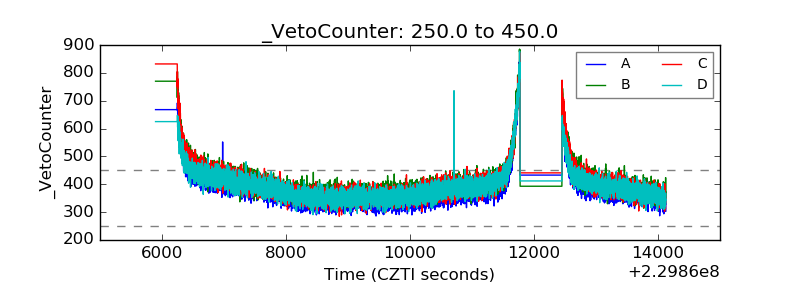 |