| Param | Original file | Final file |
|---|---|---|
| Filename | modeM0/AS1A03_009T01_9000001160_08355cztM0_level2.evt | modeM0/AS1A03_009T01_9000001160_08355cztM0_level2_quad_clean.evt |
| Size (bytes) | 127,097,280 | 11,450,880 |
| Size | 121.2 MB | 10.9 MB |
| Events in quadrant A | 1,197,074 | 53,893 |
| Events in quadrant B | 840,597 | 54,973 |
| Events in quadrant C | 765,817 | 54,651 |
| Events in quadrant D | 922,992 | 52,987 |
| Mode SS | |||
|---|---|---|---|
| Quadrant | BADHDUFLAG | Total packets | Discarded packets |
| A | 0 | 34 | 0 |
| B | 0 | 34 | 0 |
| C | 0 | 34 | 0 |
| D | 0 | 34 | 0 |
| Mode M0 | |||
|---|---|---|---|
| Quadrant | BADHDUFLAG | Total packets | Discarded packets |
| A | 0 | 4745 | 0 |
| B | 0 | 3667 | 0 |
| C | 0 | 3544 | 0 |
| D | 0 | 3978 | 0 |
| Quadrant | Total seconds | Saturated seconds | Saturation percentage |
|---|---|---|---|
| A | 1772 | 135 | 7.618510% |
| B | 1772 | 3 | 0.169300% |
| C | 1772 | 1 | 0.056433% |
| D | 1772 | 15 | 0.846501% |
Noise dominated data is calculated using 1-second bins in cleaned event files. If a bin has >2000 counts, and if more than 50% of those come from <1% of pixels, then it is considered to be noise-dominated and hence unusable.
| Quadrant | # 1 sec bins | Bins with >0 counts | Bins with >2000 counts | High rate bins dominated by noise | Noise dominated (total time) | Noise dominated (detector-on time) | Marked lightcurve |
|---|---|---|---|---|---|---|---|
| A | 1772 | 1772 | 109 | 109 | 6.15% | 6.15% | 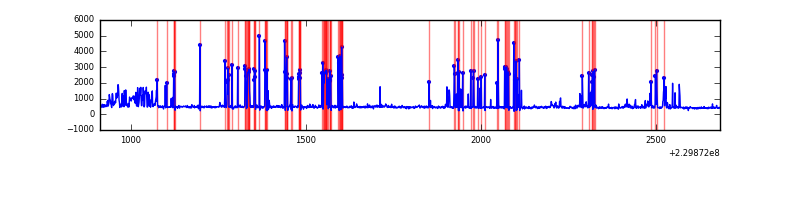 |
| B | 1772 | 1772 | 1 | 1 | 0.06% | 0.06% | 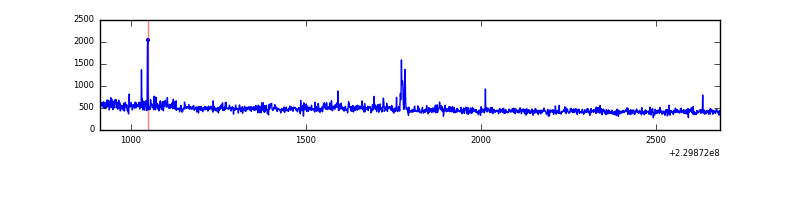 |
| C | 1772 | 1772 | 0 | 0 | 0.00% | 0.00% | 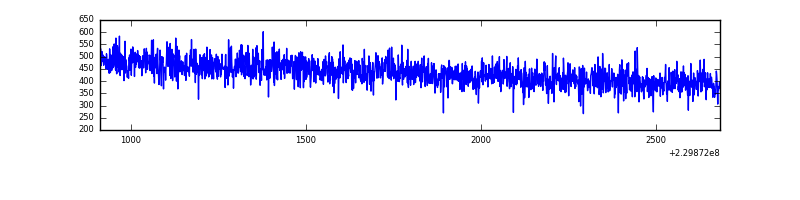 |
| D | 1772 | 1772 | 8 | 8 | 0.45% | 0.45% | 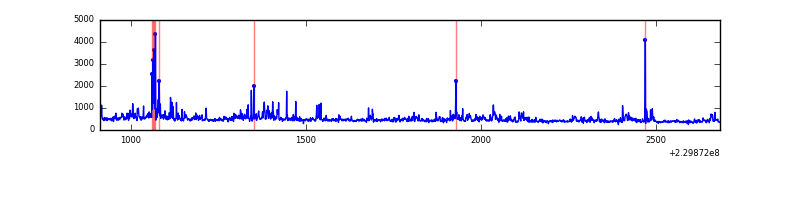 |
Top three noisy pixels from each quadrant. If the there are fewer than three noisy pixels in the level2.evt file, extra rows are filled as -1
| Pixel properties | Quadrant properties | ||||||
|---|---|---|---|---|---|---|---|
| Quadrant | DetID | PixID | Counts | Sigma | Mean | Median | Sigma |
| A | 15 | 239 | 431576 | 10410.23 | 194 | 189 | 41.4 |
| A | 13 | 251 | 6537 | 153.19 | 194 | 189 | 41.4 |
| A | 1 | 162 | 3657 | 83.69 | 194 | 189 | 41.4 |
| B | 0 | 214 | 45014 | 1103.81 | 202 | 198 | 40.6 |
| B | 10 | 246 | 4052 | 94.92 | 202 | 198 | 40.6 |
| B | 12 | 111 | 3809 | 88.94 | 202 | 198 | 40.6 |
| C | 8 | 128 | 4232 | 86.81 | 194 | 194 | 46.5 |
| C | 8 | 112 | 1970 | 38.18 | 194 | 194 | 46.5 |
| C | 8 | 144 | 1613 | 30.51 | 194 | 194 | 46.5 |
| D | 2 | 152 | 101990 | 1889.2 | 193 | 188 | 53.9 |
| D | 7 | 71 | 31502 | 581.11 | 193 | 188 | 53.9 |
| D | 13 | 105 | 28510 | 525.59 | 193 | 188 | 53.9 |
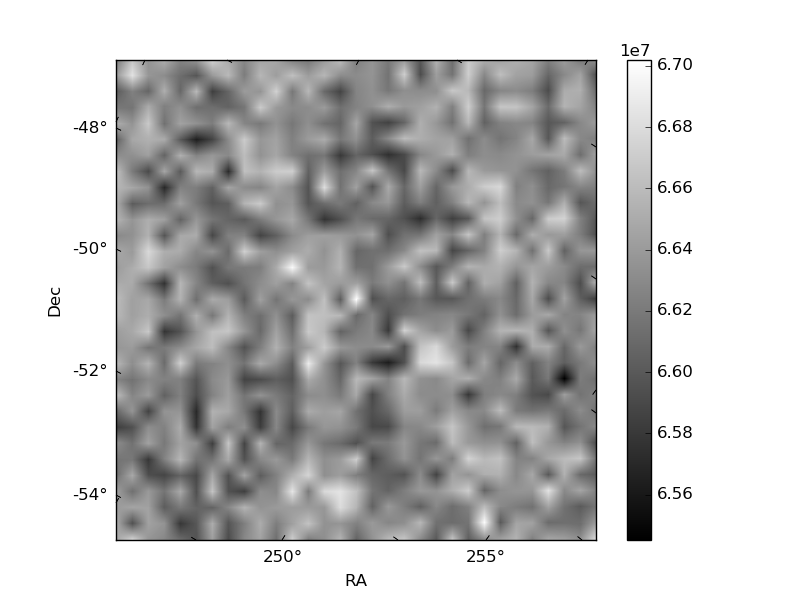
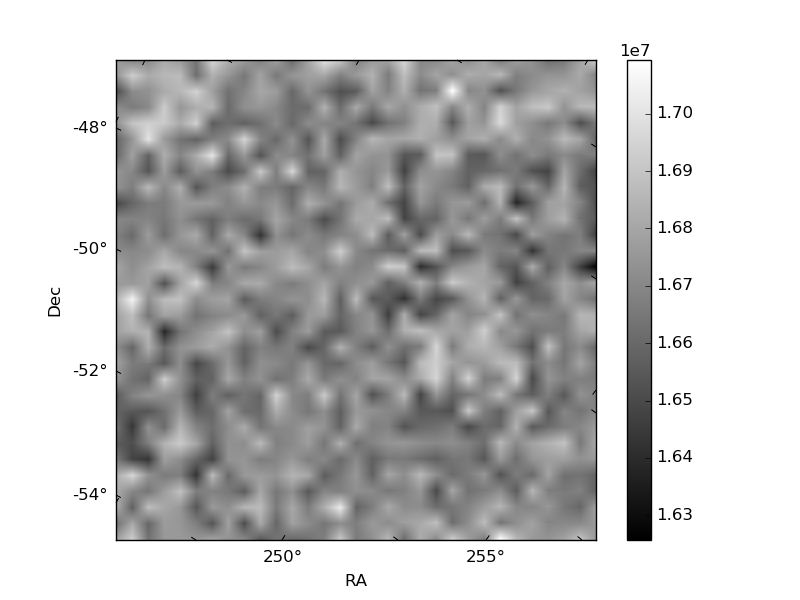
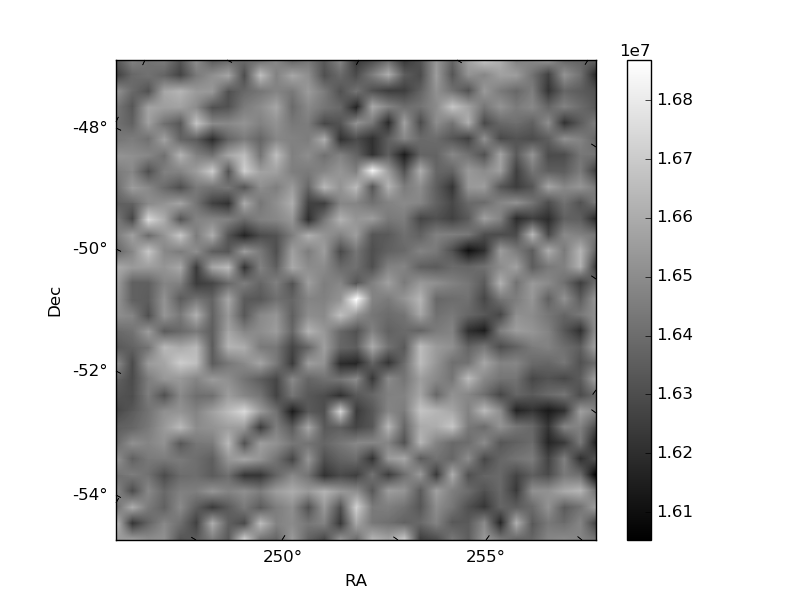
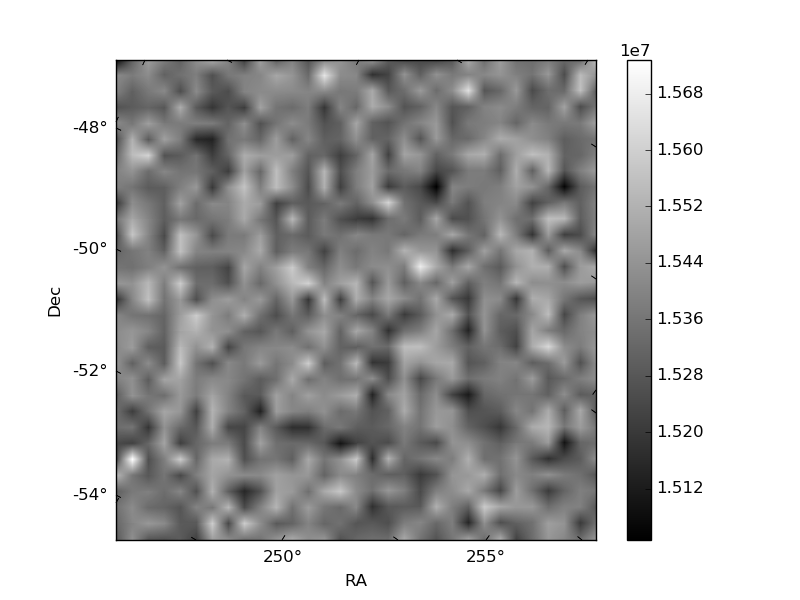
Histogram calculated using DETX and DETY for each event in the final _common_clean file
| Quadrant A | 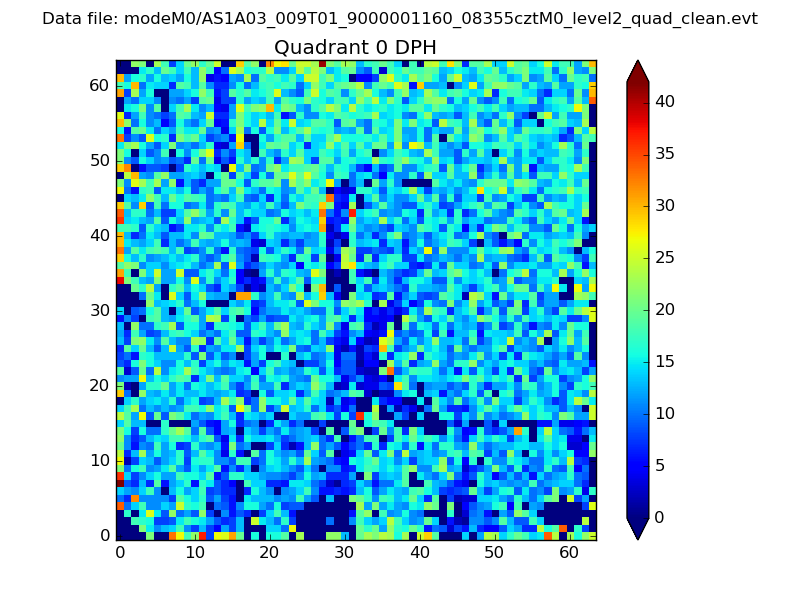 |
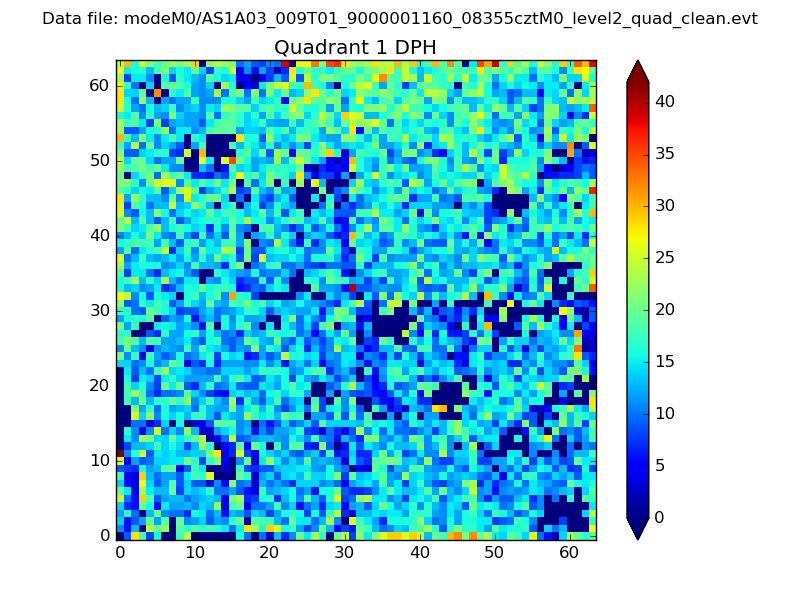 |
Quadrant B |
|---|---|---|---|
| Quadrant D | 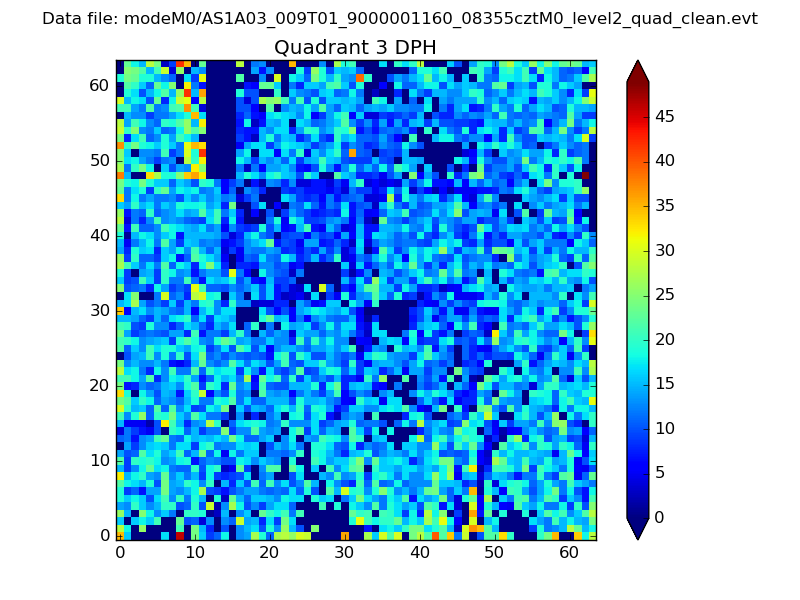 |
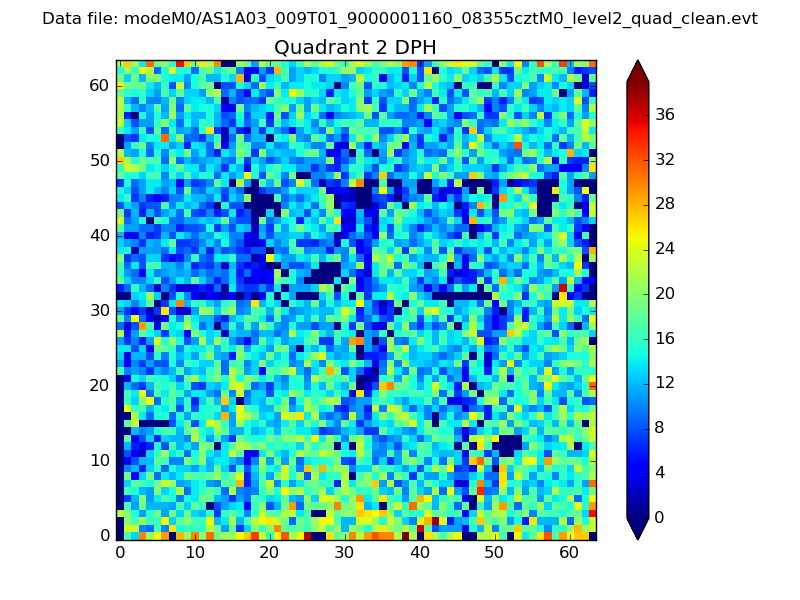 |
Quadrant C |
| Plot type | Count rate plots | Images |
|---|---|---|
| Comparison with Poisson distribution Blue bars denote a histogram of data divided into 1 sec bins. Red curve is a Poisson curve with rate = median count rate of data. |
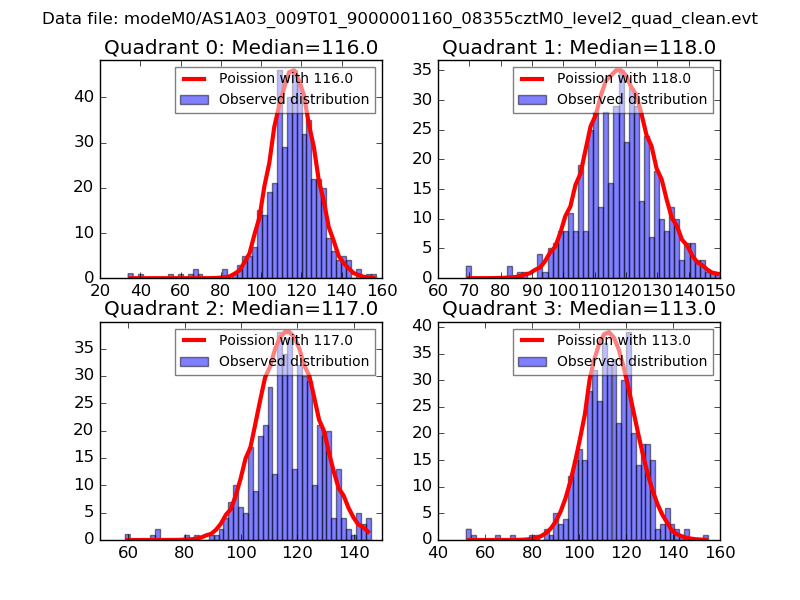 |
 |
| Quadrant-wise count rates Data is divided into 100 sec bins |
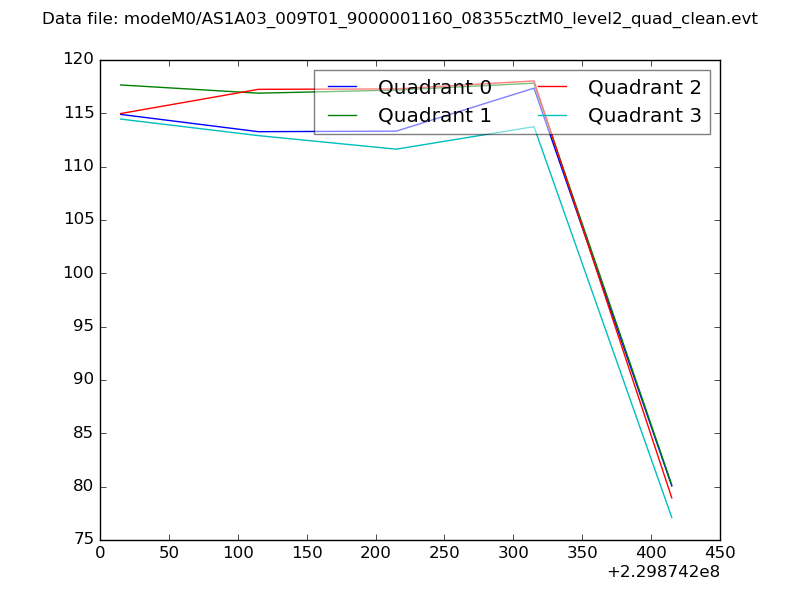 |
|
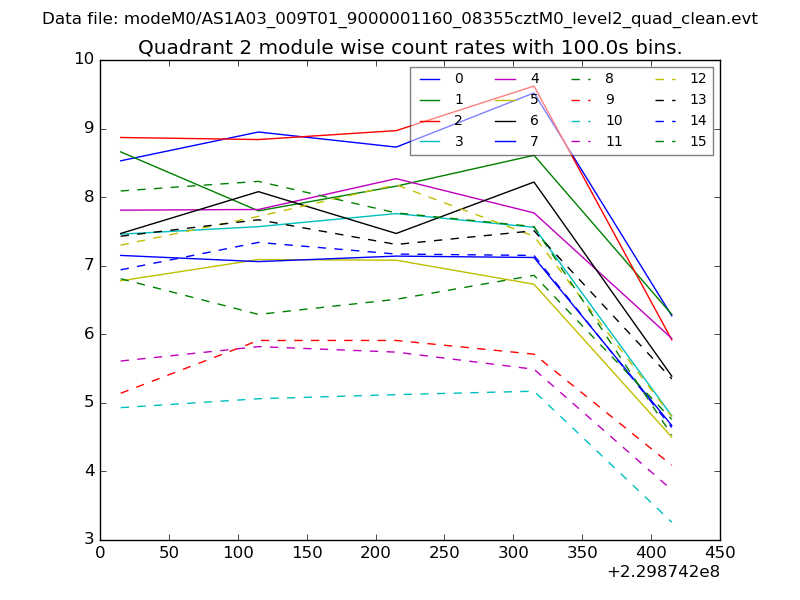
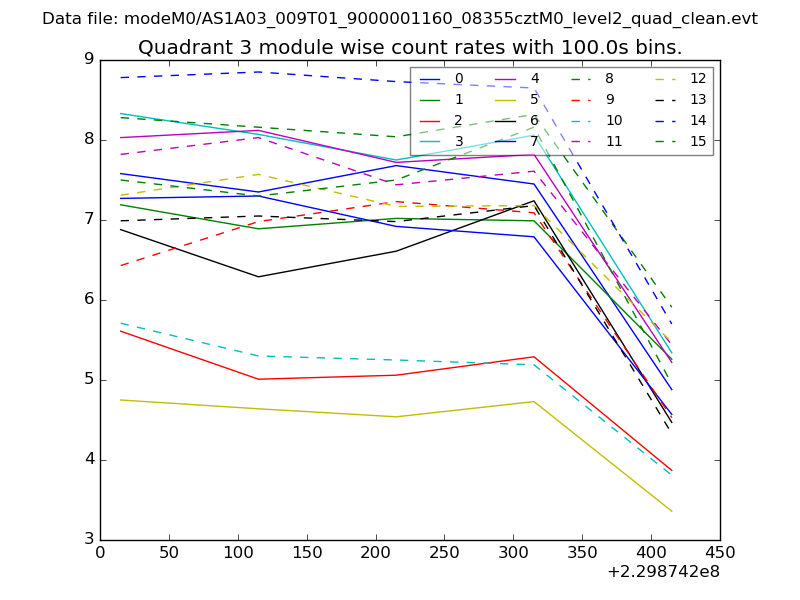
| Module-wise count rates for Quadrant A Data is divided into 100 sec bins |
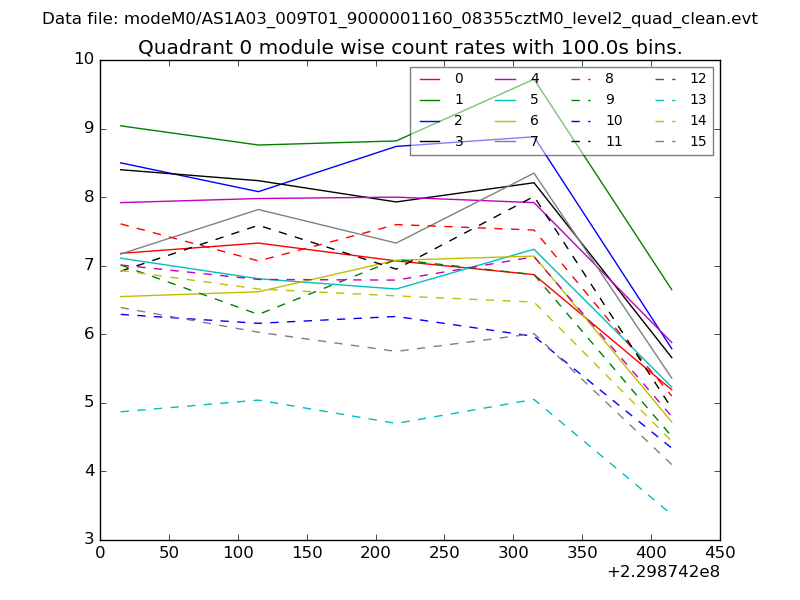 |
 |
| Module-wise count rates for Quadrant B Data is divided into 100 sec bins |
 |
 |
| Module-wise count rates for Quadrant C Data is divided into 100 sec bins |
 |
 |
| Module-wise count rates for Quadrant D Data is divided into 100 sec bins |
 |
 |
| Parameter | Plot |
|---|---|
| CZT HV Monitor | 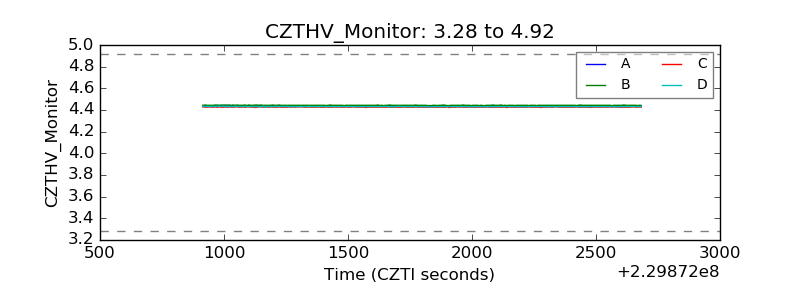 |
| D_VDD | 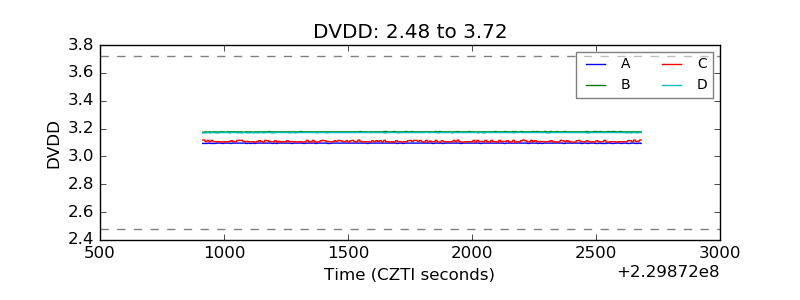 |
| Temperature 1 | 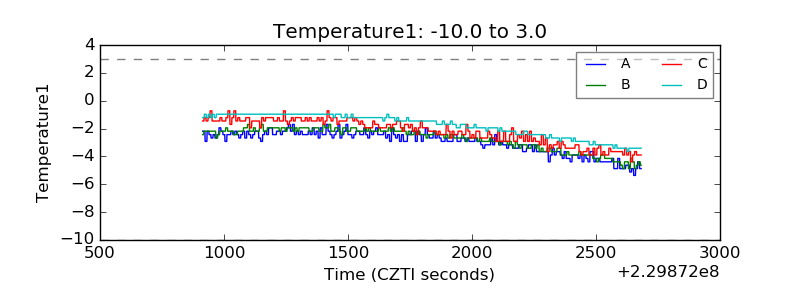 |
| Veto HV Monitor |  |
| Veto LLD | 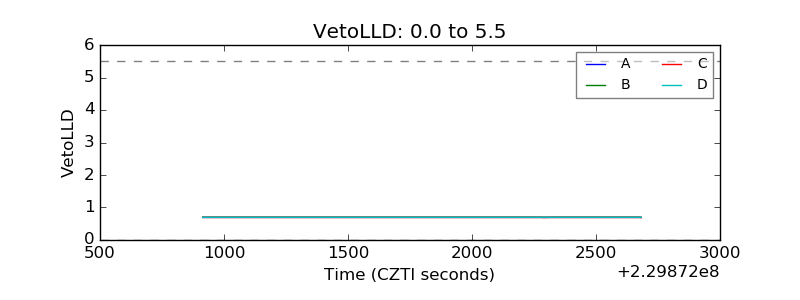 |
| Alpha Counter | 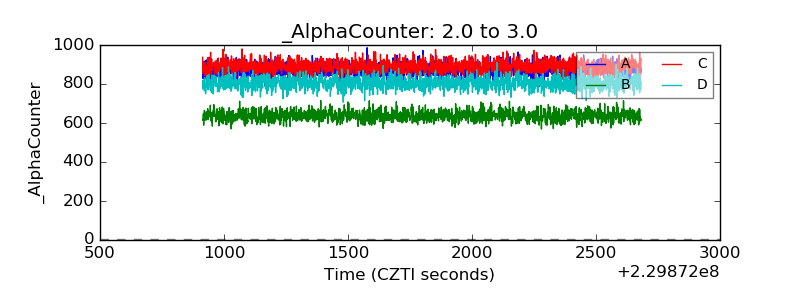 |
| _CPM_Rate | 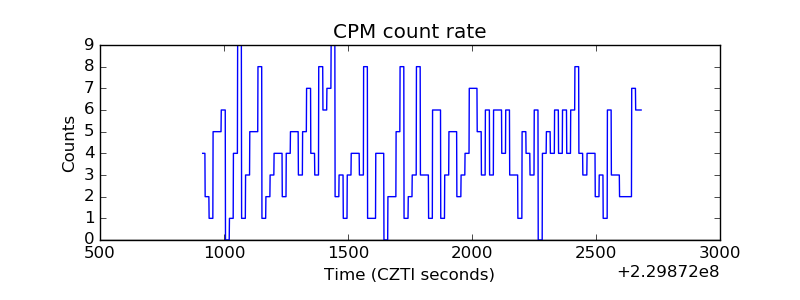 |
| CZT Counter | 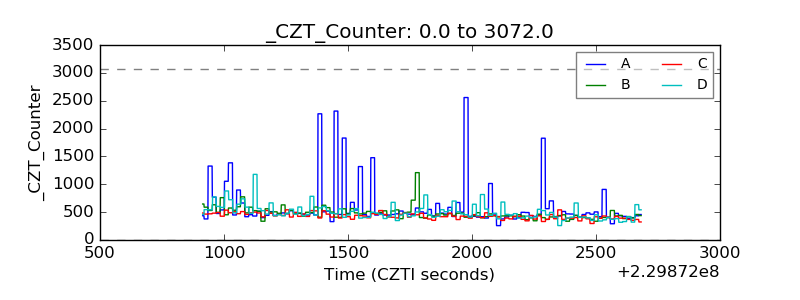 |
| +2.5 Volts monitor |  |
| +5 Volts monitor |  |
| _ROLL_ROT | 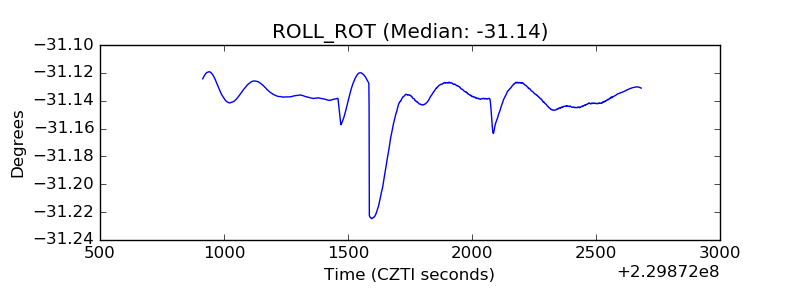 |
| _Roll_DEC | 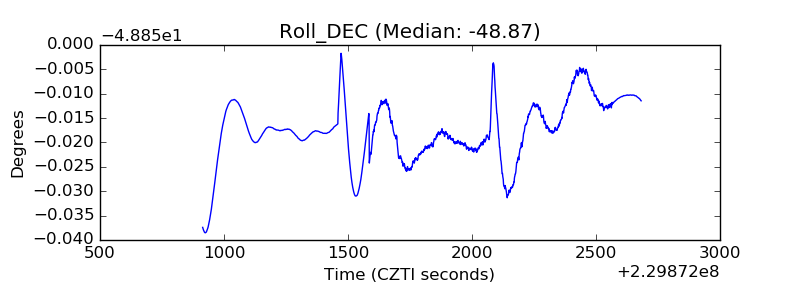 |
| _Roll_RA | 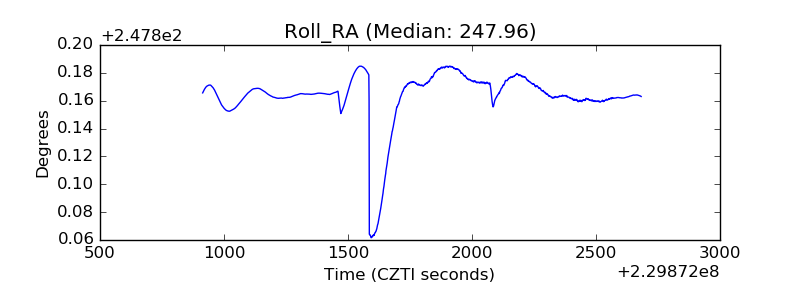 |
| Veto Counter | 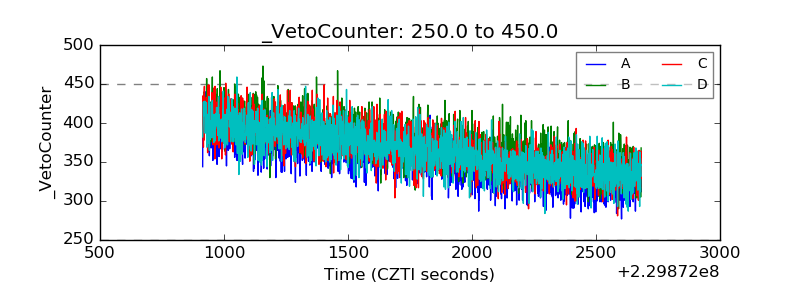 |