| Param | Original file | Final file |
|---|---|---|
| Filename | modeM0/AS1G07_046T01_9000001162_08355cztM0_level2.evt | modeM0/AS1G07_046T01_9000001162_08355cztM0_level2_quad_clean.evt |
| Size (bytes) | 336,153,600 | 59,618,880 |
| Size | 320.6 MB | 56.9 MB |
| Events in quadrant A | 2,649,635 | 370,231 |
| Events in quadrant B | 2,440,363 | 375,056 |
| Events in quadrant C | 2,240,206 | 375,457 |
| Events in quadrant D | 2,537,950 | 362,550 |
| Mode M0 | |||
|---|---|---|---|
| Quadrant | BADHDUFLAG | Total packets | Discarded packets |
| A | 0 | 10847 | 3 |
| B | 0 | 10260 | 2 |
| C | 0 | 9754 | 2 |
| D | 0 | 10707 | 2 |
| Mode M9 | |||
|---|---|---|---|
| Quadrant | BADHDUFLAG | Total packets | Discarded packets |
| A | 0 | 1 | 0 |
| B | 0 | 1 | 0 |
| C | 0 | 1 | 0 |
| D | 0 | 1 | 0 |
| Mode SS | |||
|---|---|---|---|
| Quadrant | BADHDUFLAG | Total packets | Discarded packets |
| A | 0 | 94 | 0 |
| B | 0 | 94 | 0 |
| C | 0 | 94 | 0 |
| D | 0 | 94 | 0 |
| Quadrant | Total seconds | Saturated seconds | Saturation percentage |
|---|---|---|---|
| A | 4574 | 270 | 5.902930% |
| B | 4574 | 212 | 4.634893% |
| C | 4574 | 169 | 3.694797% |
| D | 4574 | 210 | 4.591167% |
Noise dominated data is calculated using 1-second bins in cleaned event files. If a bin has >2000 counts, and if more than 50% of those come from <1% of pixels, then it is considered to be noise-dominated and hence unusable.
| Quadrant | # 1 sec bins | Bins with >0 counts | Bins with >2000 counts | High rate bins dominated by noise | Noise dominated (total time) | Noise dominated (detector-on time) | Marked lightcurve |
|---|---|---|---|---|---|---|---|
| A | 4749 | 4576 | 52 | 52 | 1.09% | 1.14% |  |
| B | 4749 | 4576 | 10 | 10 | 0.21% | 0.22% |  |
| C | 4749 | 4576 | 0 | 0 | 0.00% | 0.00% |  |
| D | 4749 | 4576 | 16 | 16 | 0.34% | 0.35% |  |
Top three noisy pixels from each quadrant. If the there are fewer than three noisy pixels in the level2.evt file, extra rows are filled as -1
| Pixel properties | Quadrant properties | ||||||
|---|---|---|---|---|---|---|---|
| Quadrant | DetID | PixID | Counts | Sigma | Mean | Median | Sigma |
| A | 15 | 239 | 241364 | 1987.87 | 580 | 566 | 121.1 |
| A | 15 | 236 | 122664 | 1007.96 | 580 | 566 | 121.1 |
| A | 14 | 111 | 23398 | 188.49 | 580 | 566 | 121.1 |
| B | 0 | 214 | 76077 | 648.76 | 584 | 570 | 116.4 |
| B | 10 | 16 | 30009 | 252.94 | 584 | 570 | 116.4 |
| B | 4 | 81 | 26828 | 225.61 | 584 | 570 | 116.4 |
| C | 8 | 128 | 6314 | 42.2 | 571 | 572 | 136.1 |
| C | 13 | 61 | 4300 | 27.4 | 571 | 572 | 136.1 |
| C | 8 | 112 | 3493 | 21.47 | 571 | 572 | 136.1 |
| D | 2 | 152 | 251089 | 1755.82 | 567 | 551 | 142.7 |
| D | 2 | 14 | 53238 | 369.24 | 567 | 551 | 142.7 |
| D | 7 | 71 | 33680 | 232.17 | 567 | 551 | 142.7 |
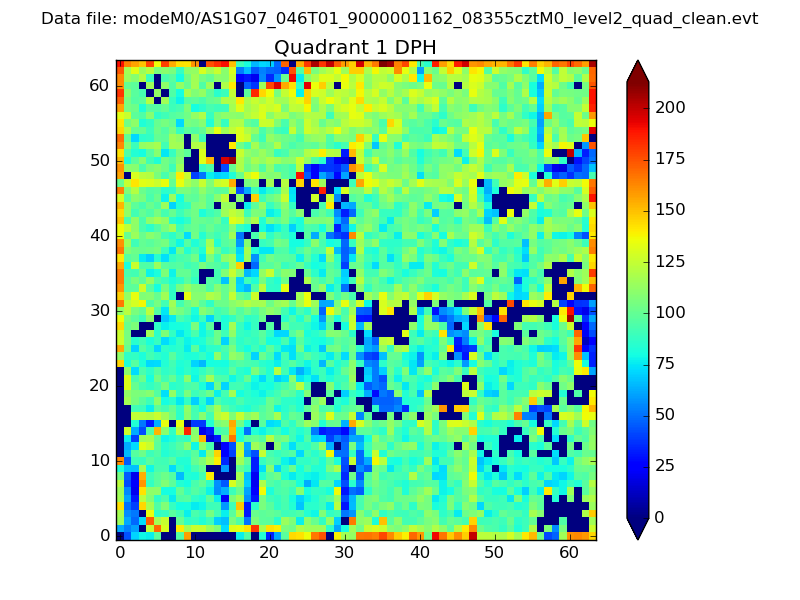
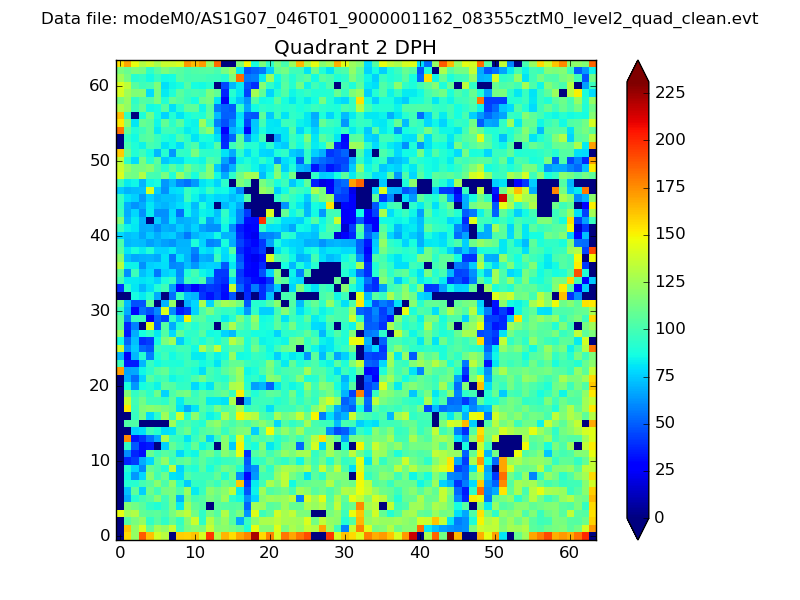
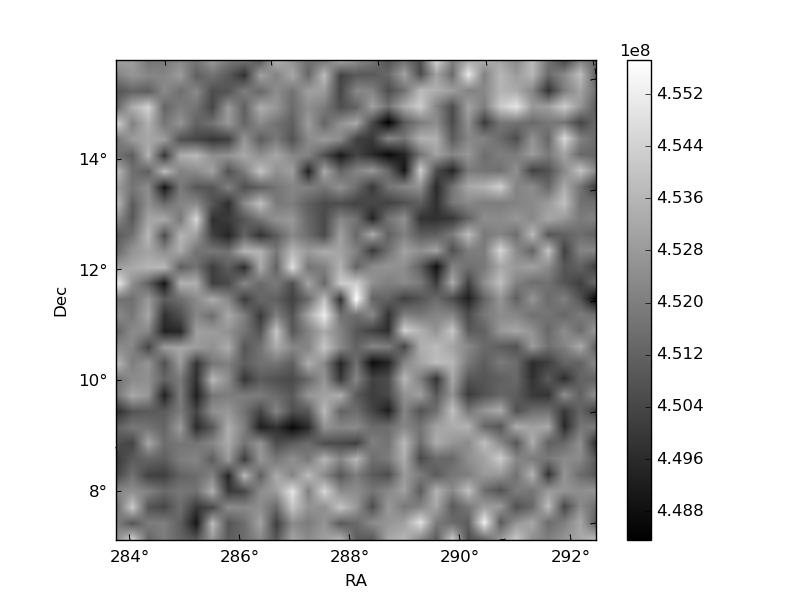
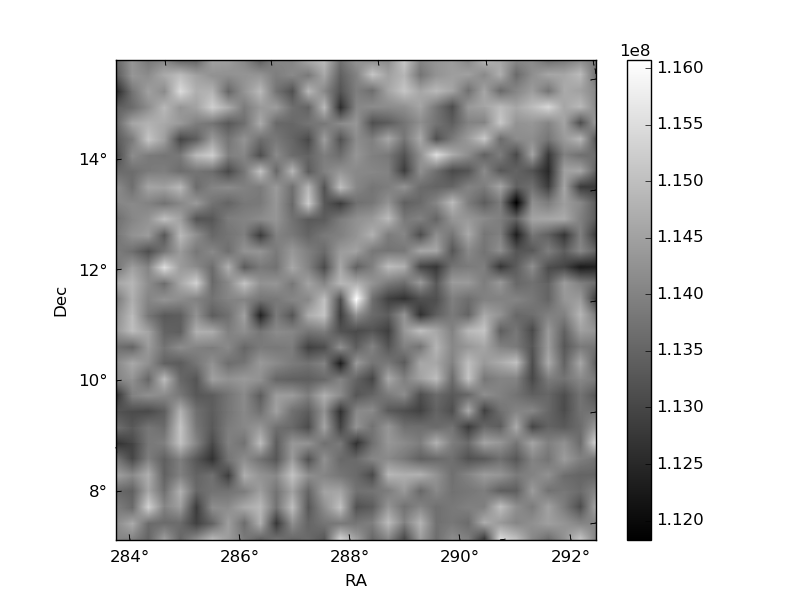
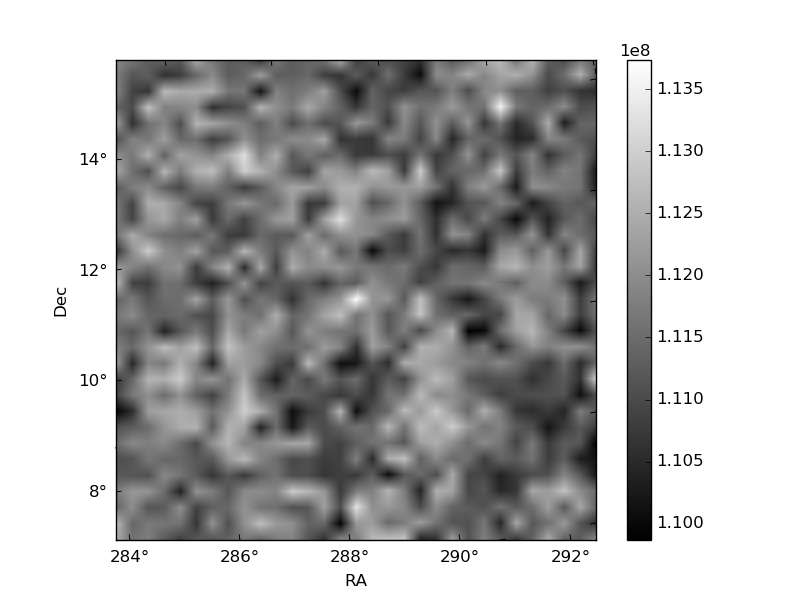
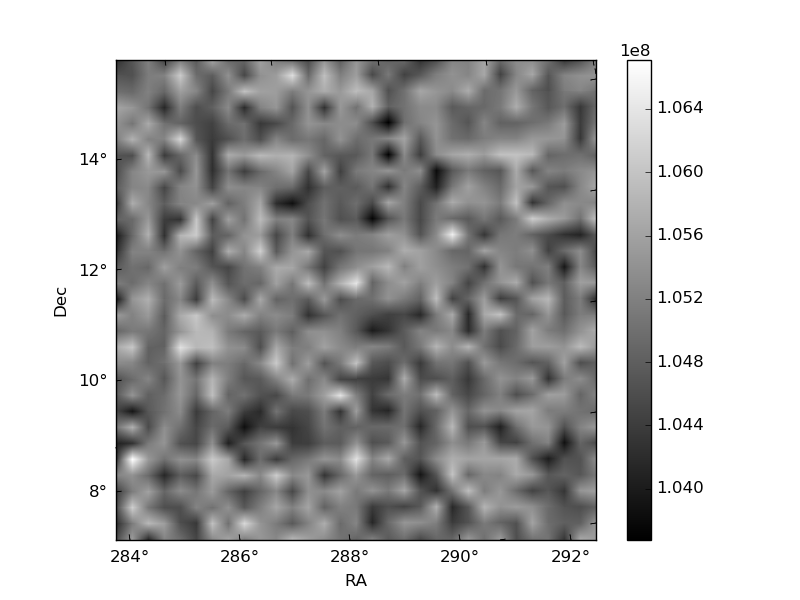
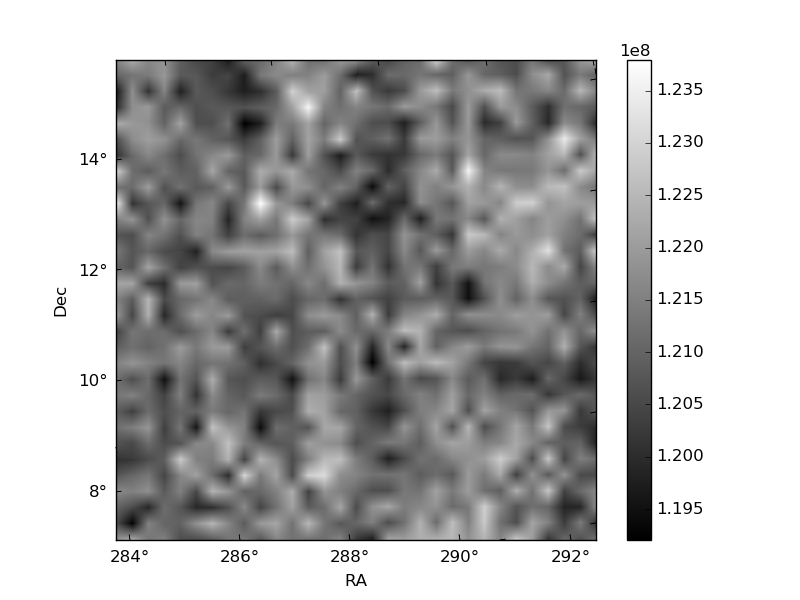
Histogram calculated using DETX and DETY for each event in the final _common_clean file
| Quadrant A |  |
 |
Quadrant B |
|---|---|---|---|
| Quadrant D | 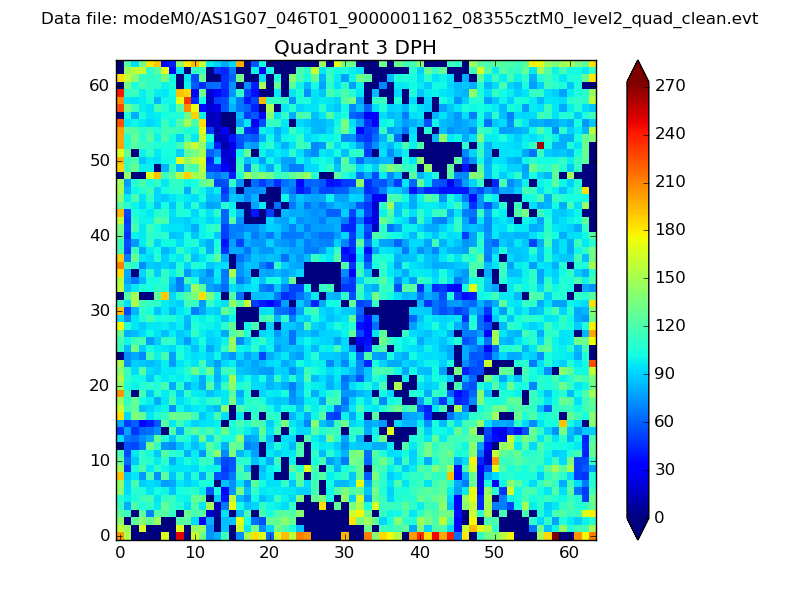 |
 |
Quadrant C |
| Plot type | Count rate plots | Images |
|---|---|---|
| Comparison with Poisson distribution Blue bars denote a histogram of data divided into 1 sec bins. Red curve is a Poisson curve with rate = median count rate of data. |
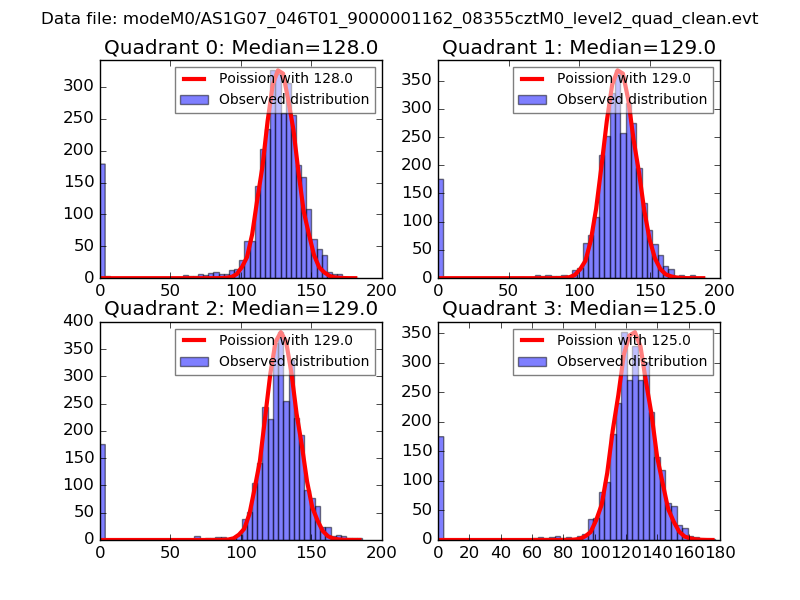 |
 |
| Quadrant-wise count rates Data is divided into 100 sec bins |
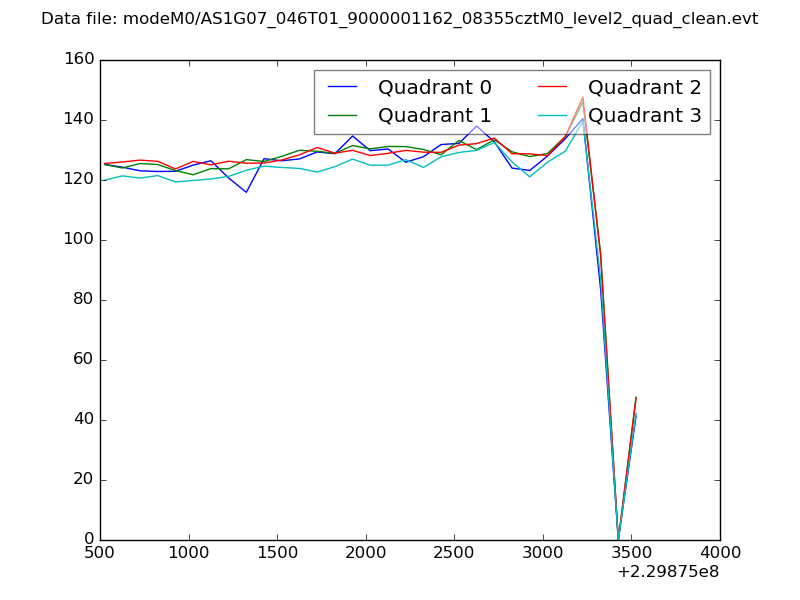 |
|
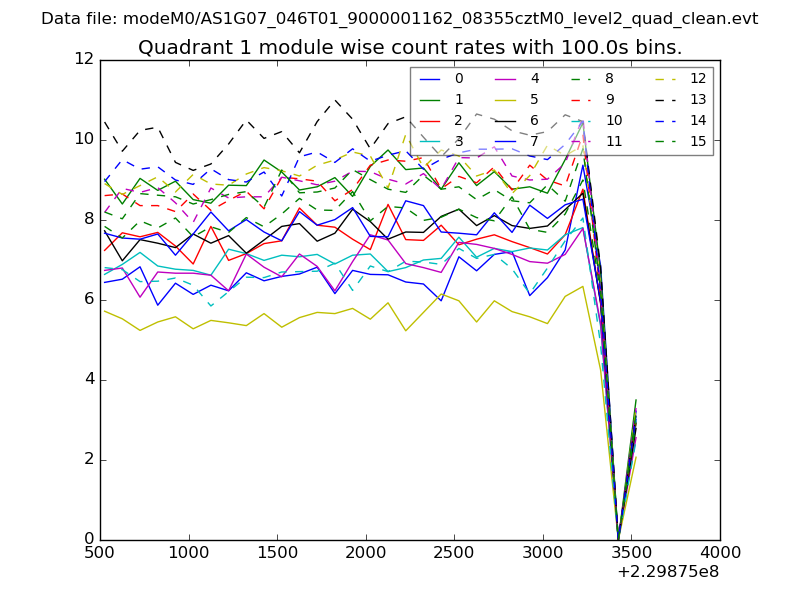
| Module-wise count rates for Quadrant A Data is divided into 100 sec bins |
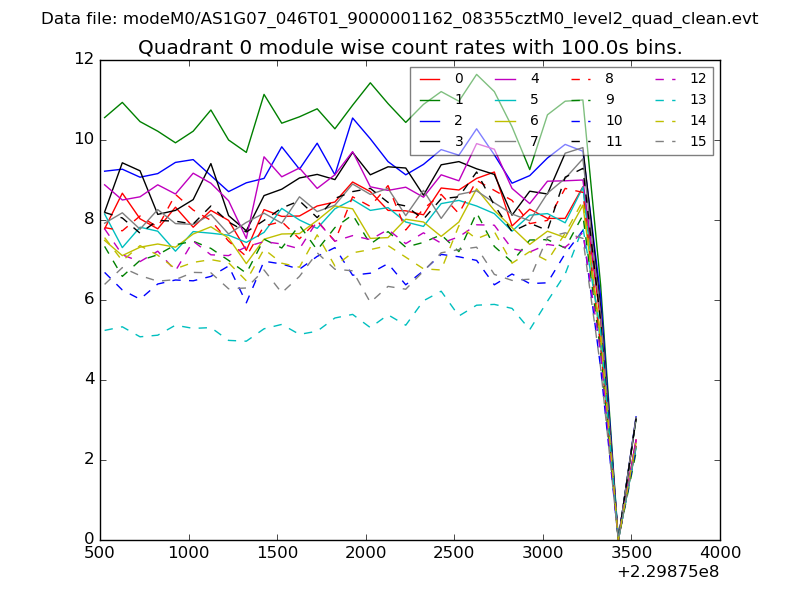 |
 |
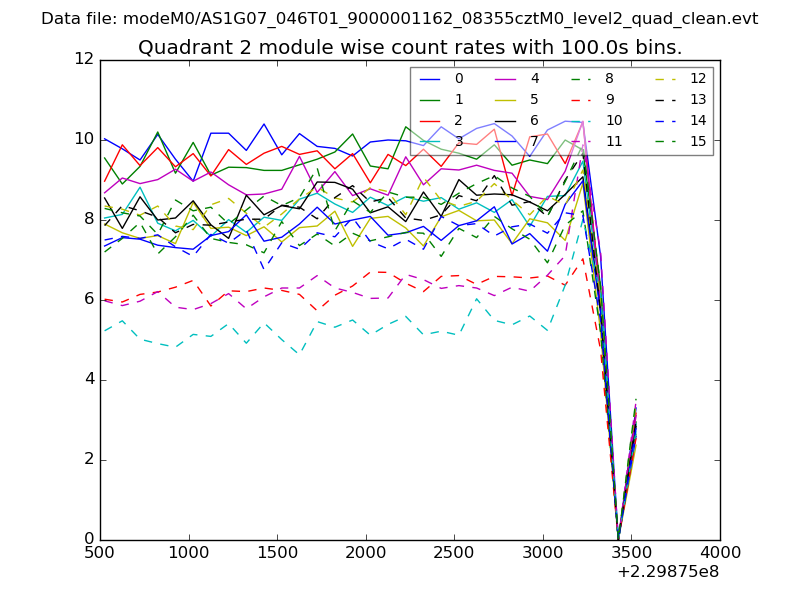
| Module-wise count rates for Quadrant B Data is divided into 100 sec bins |
 |
 |
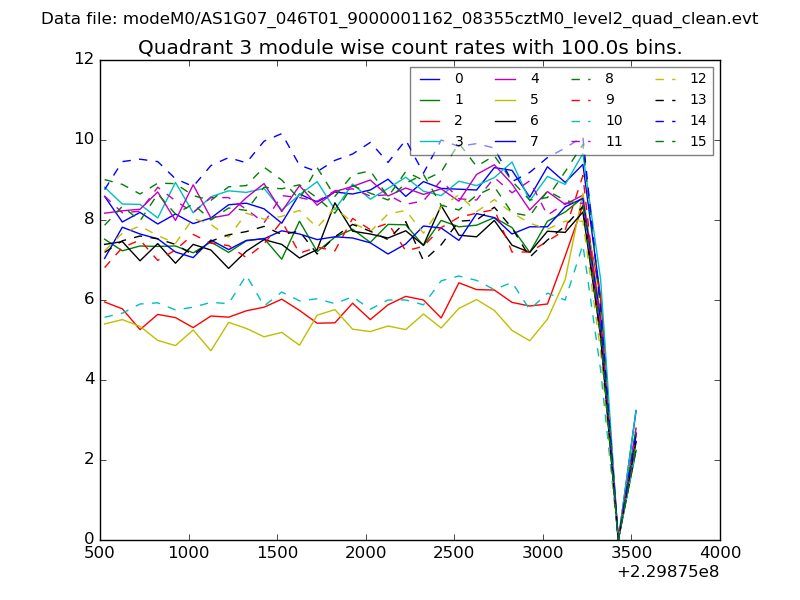
| Module-wise count rates for Quadrant C Data is divided into 100 sec bins |
 |
 |
| Module-wise count rates for Quadrant D Data is divided into 100 sec bins |
 |
 |
| Parameter | Plot |
|---|---|
| CZT HV Monitor | 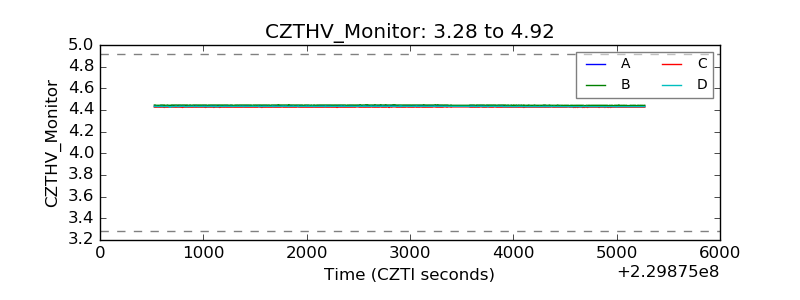 |
| D_VDD | 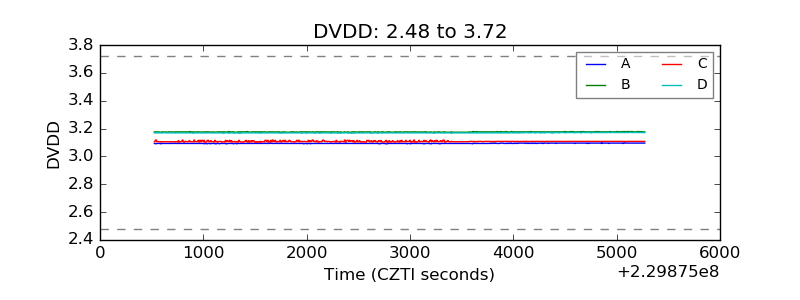 |
| Temperature 1 | 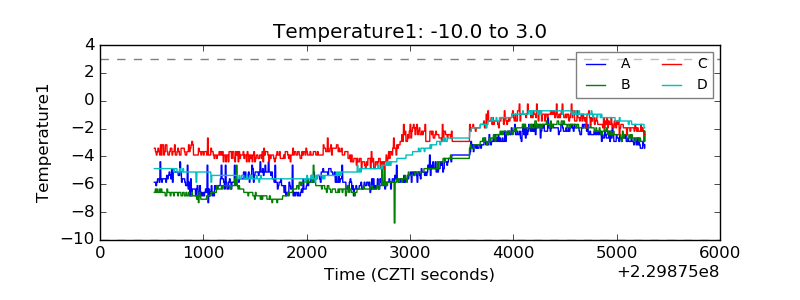 |
| Veto HV Monitor | 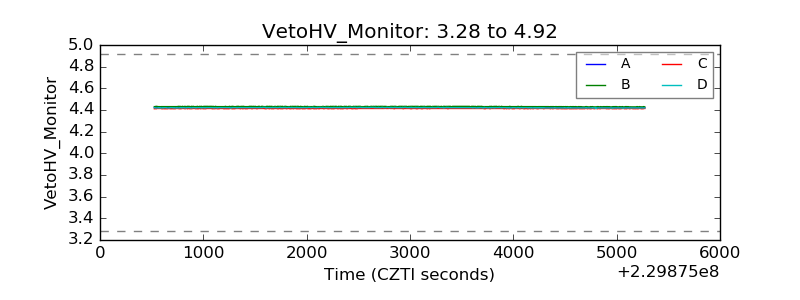 |
| Veto LLD |  |
| Alpha Counter | 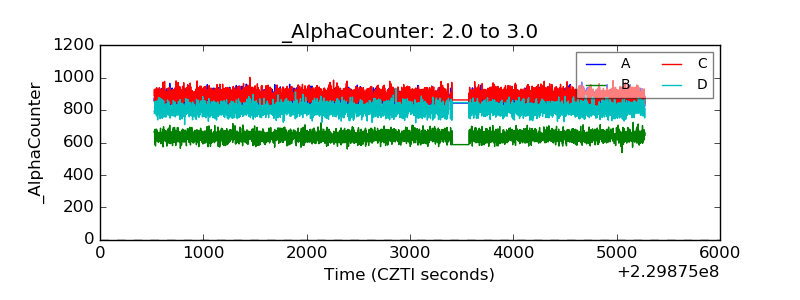 |
| _CPM_Rate | 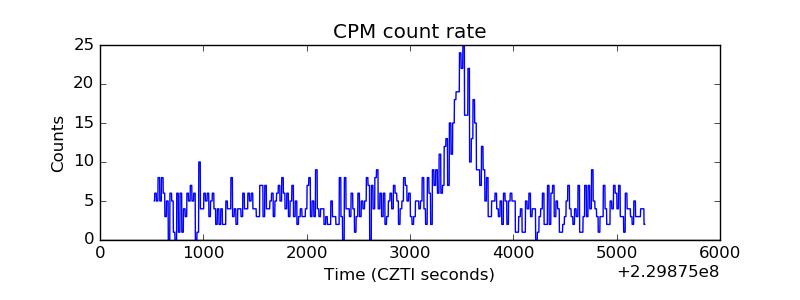 |
| CZT Counter | 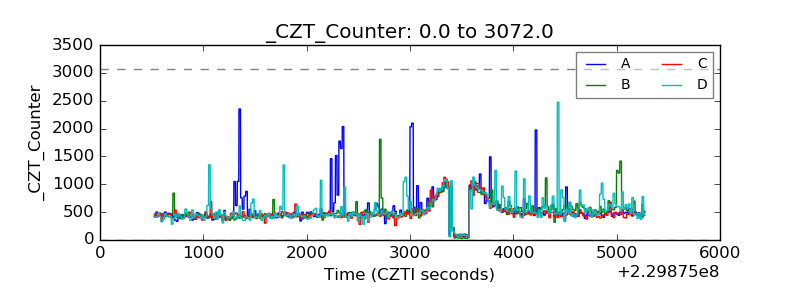 |
| +2.5 Volts monitor |  |
| +5 Volts monitor |  |
| _ROLL_ROT | 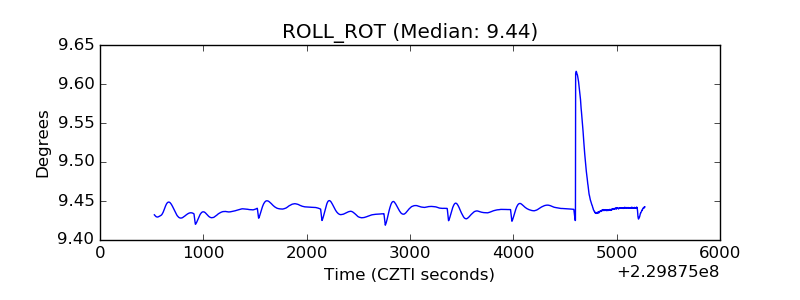 |
| _Roll_DEC | 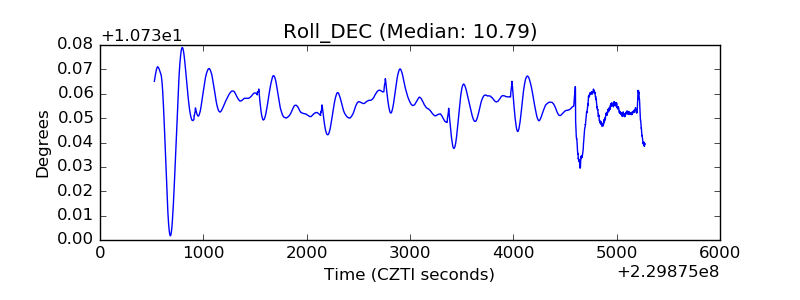 |
| _Roll_RA | 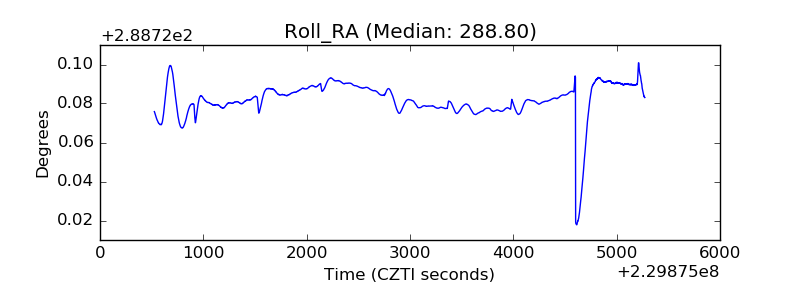 |
| Veto Counter | 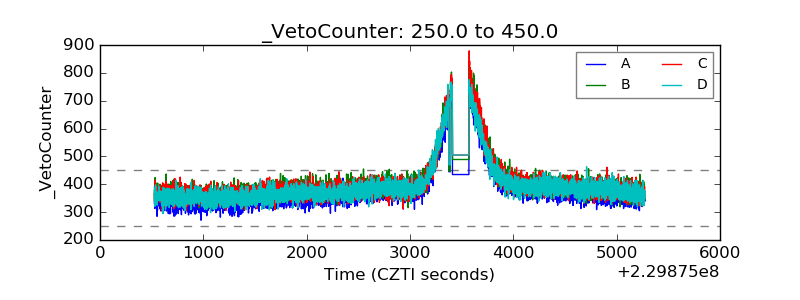 |