| Param | Original file | Final file |
|---|---|---|
| Filename | modeM0/AS1G07_046T01_9000001162_08356cztM0_level2.evt | modeM0/AS1G07_046T01_9000001162_08356cztM0_level2_quad_clean.evt |
| Size (bytes) | 567,731,520 | 77,302,080 |
| Size | 541.4 MB | 73.7 MB |
| Events in quadrant A | 4,133,402 | 454,731 |
| Events in quadrant B | 4,125,470 | 453,315 |
| Events in quadrant C | 3,693,883 | 453,683 |
| Events in quadrant D | 4,711,624 | 436,437 |
| Mode M0 | |||
|---|---|---|---|
| Quadrant | BADHDUFLAG | Total packets | Discarded packets |
| A | 0 | 17387 | 3 |
| B | 0 | 17288 | 2 |
| C | 0 | 16292 | 2 |
| D | 0 | 19281 | 2 |
| Mode M9 | |||
|---|---|---|---|
| Quadrant | BADHDUFLAG | Total packets | Discarded packets |
| A | 0 | 1 | 0 |
| B | 0 | 1 | 0 |
| C | 0 | 1 | 0 |
| D | 0 | 1 | 0 |
| Mode SS | |||
|---|---|---|---|
| Quadrant | BADHDUFLAG | Total packets | Discarded packets |
| A | 0 | 160 | 0 |
| B | 0 | 160 | 0 |
| C | 0 | 160 | 0 |
| D | 0 | 160 | 0 |
| Quadrant | Total seconds | Saturated seconds | Saturation percentage |
|---|---|---|---|
| A | 7794 | 277 | 3.554016% |
| B | 7794 | 238 | 3.053631% |
| C | 7794 | 183 | 2.347960% |
| D | 7794 | 386 | 4.952528% |
Noise dominated data is calculated using 1-second bins in cleaned event files. If a bin has >2000 counts, and if more than 50% of those come from <1% of pixels, then it is considered to be noise-dominated and hence unusable.
| Quadrant | # 1 sec bins | Bins with >0 counts | Bins with >2000 counts | High rate bins dominated by noise | Noise dominated (total time) | Noise dominated (detector-on time) | Marked lightcurve |
|---|---|---|---|---|---|---|---|
| A | 7929 | 7796 | 33 | 33 | 0.42% | 0.42% | 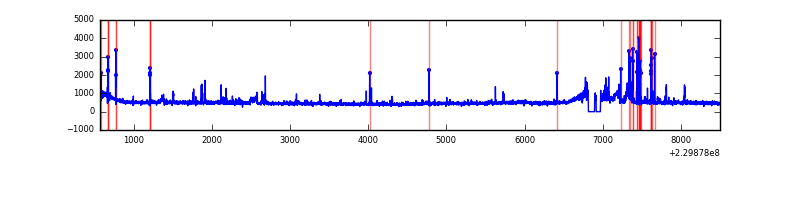 |
| B | 7929 | 7796 | 6 | 6 | 0.08% | 0.08% | 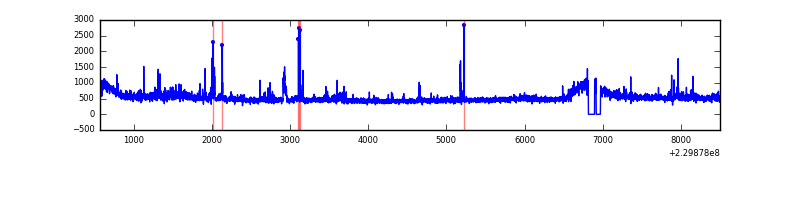 |
| C | 7929 | 7796 | 0 | 0 | 0.00% | 0.00% | 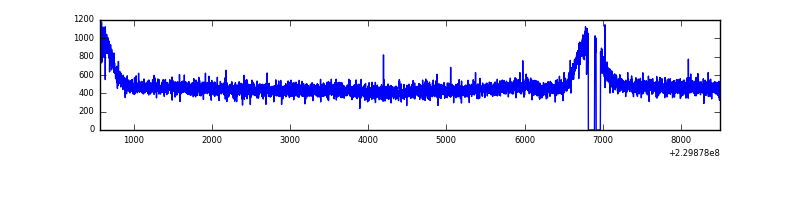 |
| D | 7929 | 7796 | 140 | 140 | 1.77% | 1.80% | 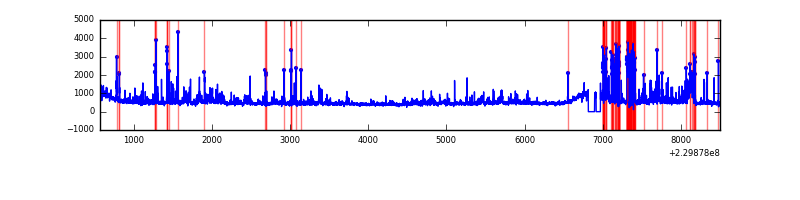 |
Top three noisy pixels from each quadrant. If the there are fewer than three noisy pixels in the level2.evt file, extra rows are filled as -1
| Pixel properties | Quadrant properties | ||||||
|---|---|---|---|---|---|---|---|
| Quadrant | DetID | PixID | Counts | Sigma | Mean | Median | Sigma |
| A | 15 | 239 | 271241 | 1353.03 | 971 | 950 | 199.8 |
| A | 14 | 111 | 59666 | 293.92 | 971 | 950 | 199.8 |
| A | 15 | 223 | 33991 | 165.4 | 971 | 950 | 199.8 |
| B | 0 | 214 | 117206 | 611.08 | 975 | 952 | 190.2 |
| B | 10 | 16 | 76713 | 398.23 | 975 | 952 | 190.2 |
| B | 4 | 173 | 37842 | 193.91 | 975 | 952 | 190.2 |
| C | 13 | 61 | 7292 | 28.57 | 947 | 951 | 221.9 |
| C | 3 | 202 | 2258 | 5.89 | 947 | 951 | 221.9 |
| C | -1 | -1 | -1 | -1.0 | 947 | 951 | 221.9 |
| D | 13 | 105 | 514743 | 2129.98 | 933 | 907 | 241.2 |
| D | 2 | 152 | 350928 | 1450.92 | 933 | 907 | 241.2 |
| D | 7 | 71 | 90575 | 371.7 | 933 | 907 | 241.2 |
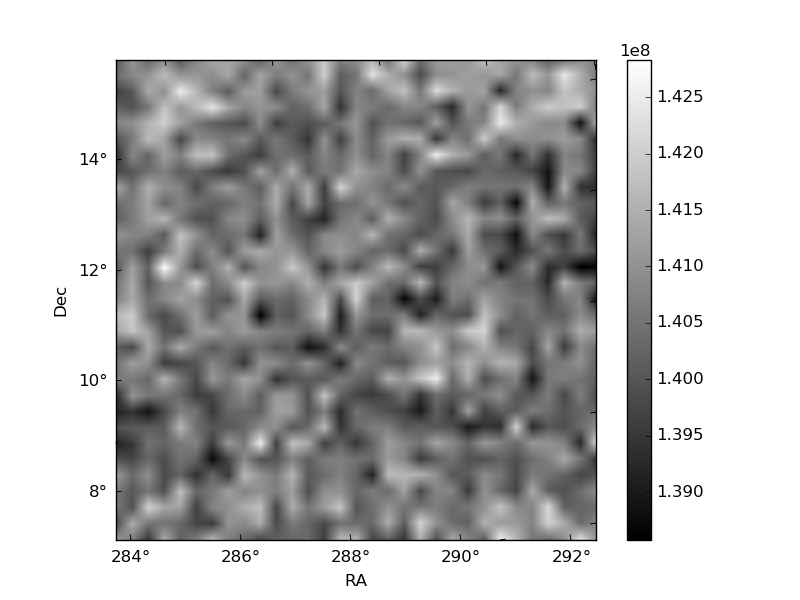
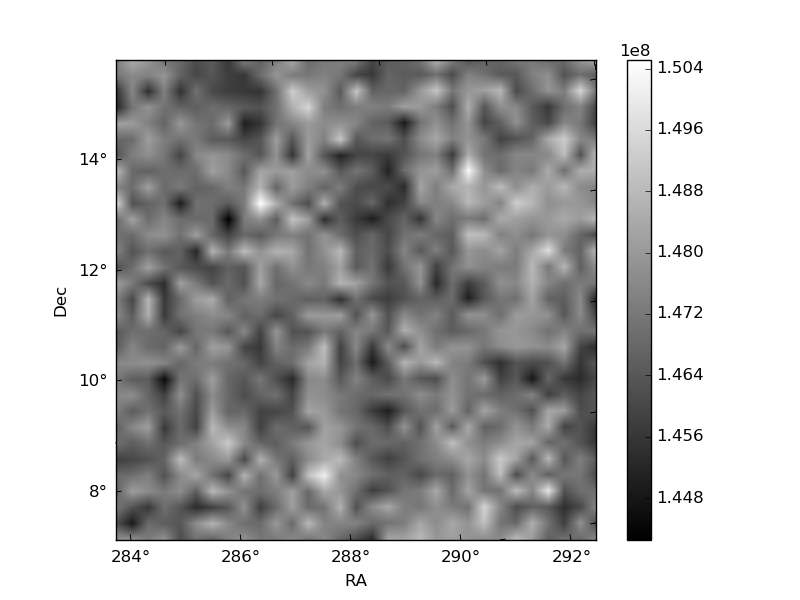
Histogram calculated using DETX and DETY for each event in the final _common_clean file
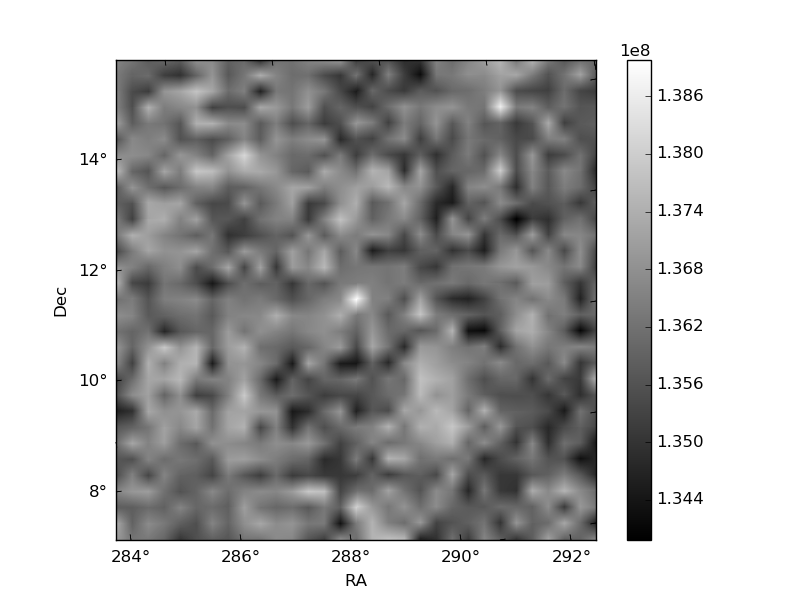
| Quadrant A | 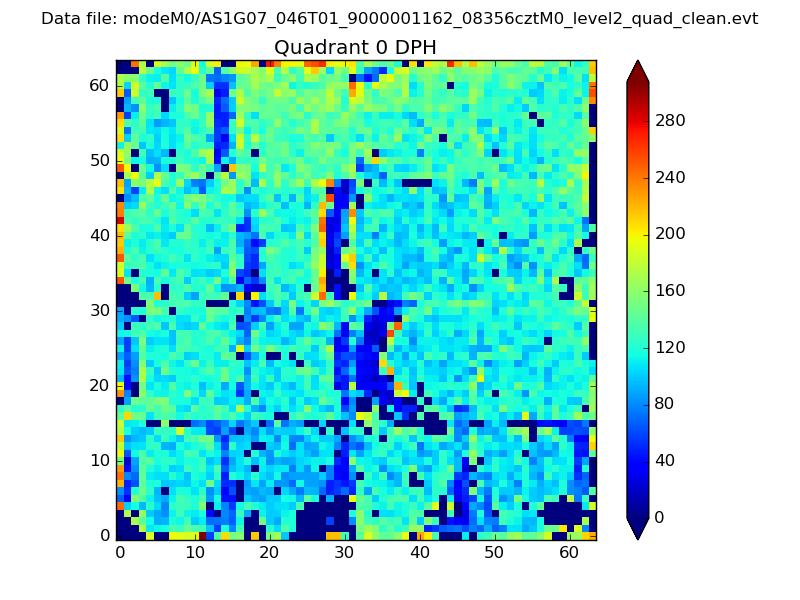 |
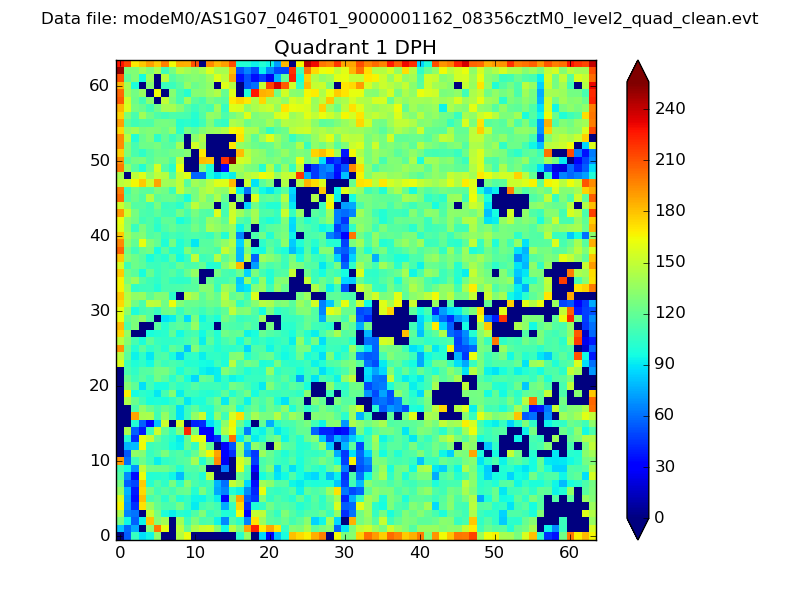 |
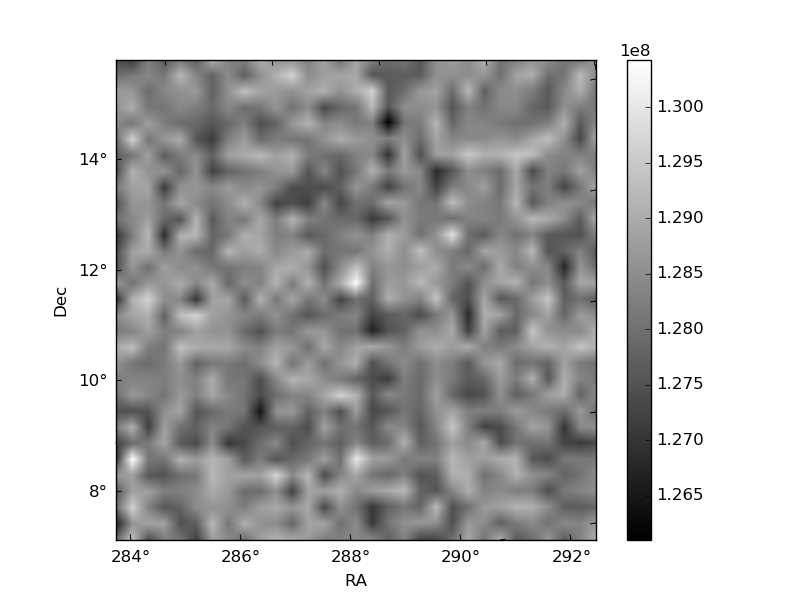
Quadrant B |
|---|---|---|---|
| Quadrant D | 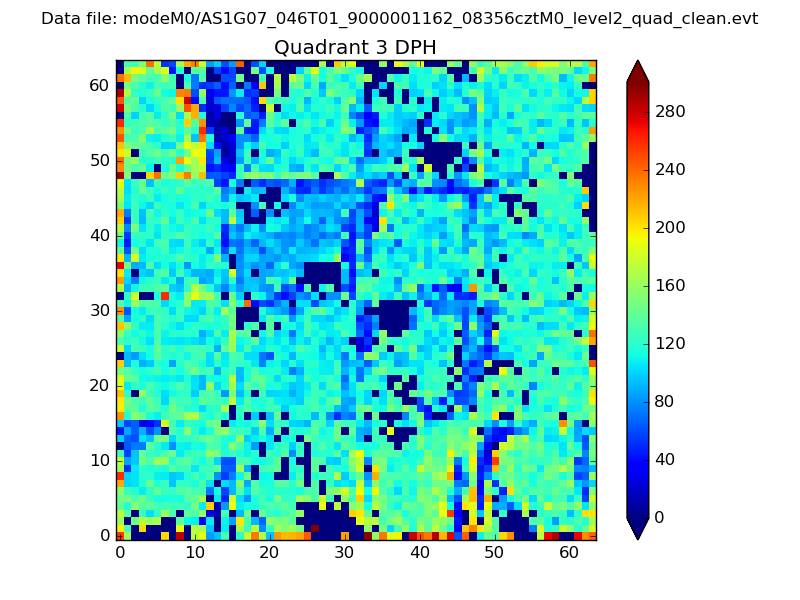 |
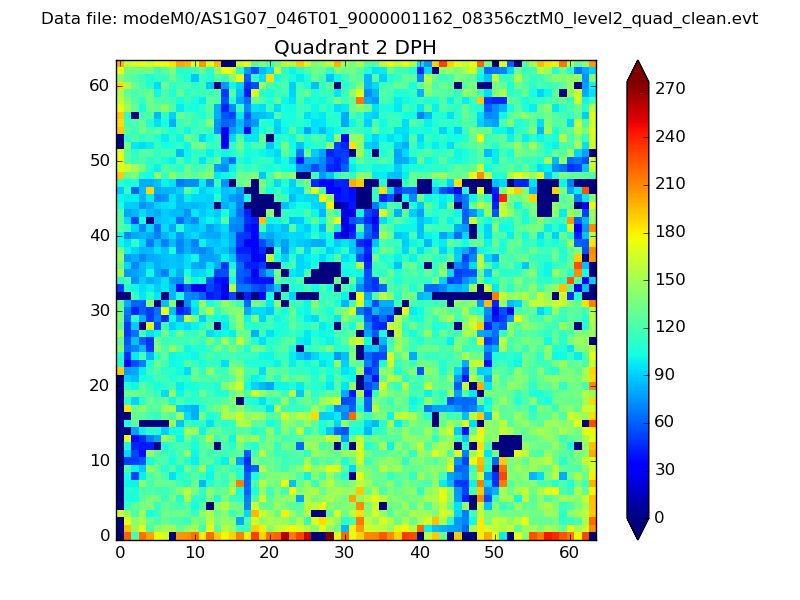 |
Quadrant C |
| Plot type | Count rate plots | Images |
|---|---|---|
| Comparison with Poisson distribution Blue bars denote a histogram of data divided into 1 sec bins. Red curve is a Poisson curve with rate = median count rate of data. |
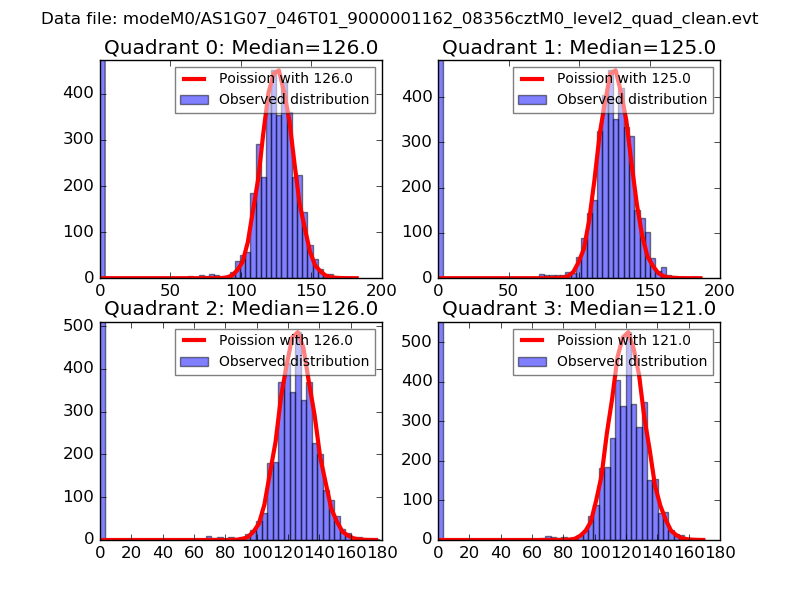 |
 |
| Quadrant-wise count rates Data is divided into 100 sec bins |
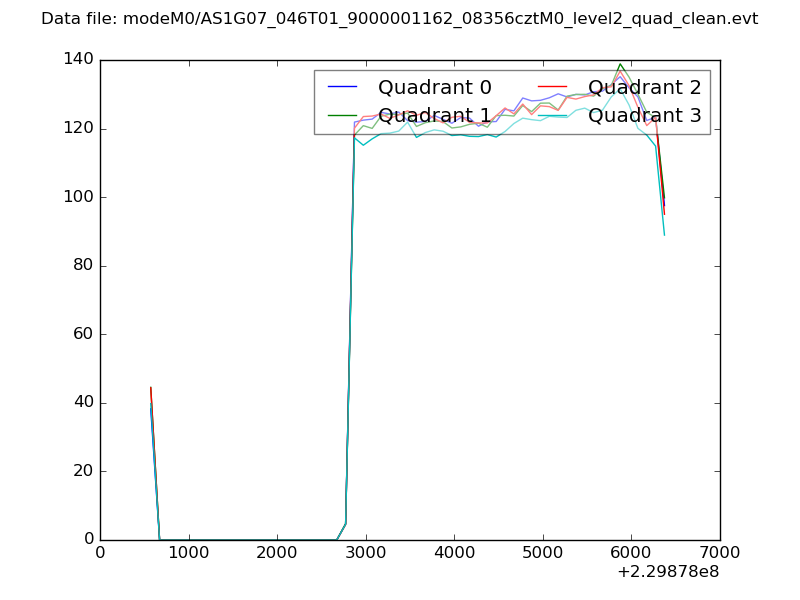 |
|
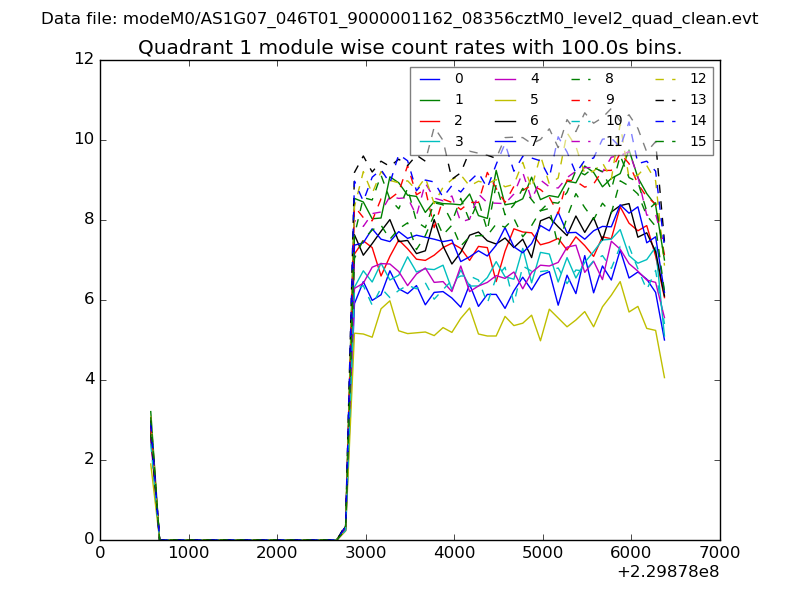
| Module-wise count rates for Quadrant A Data is divided into 100 sec bins |
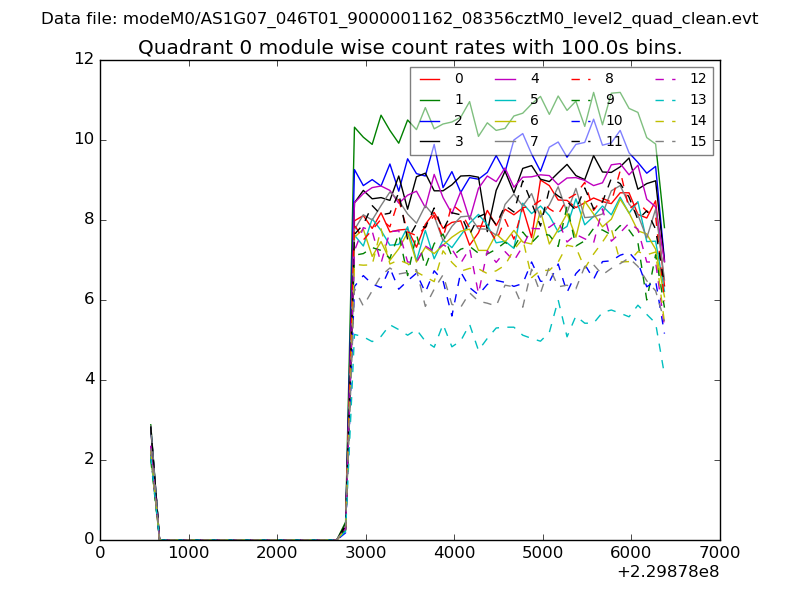 |
 |
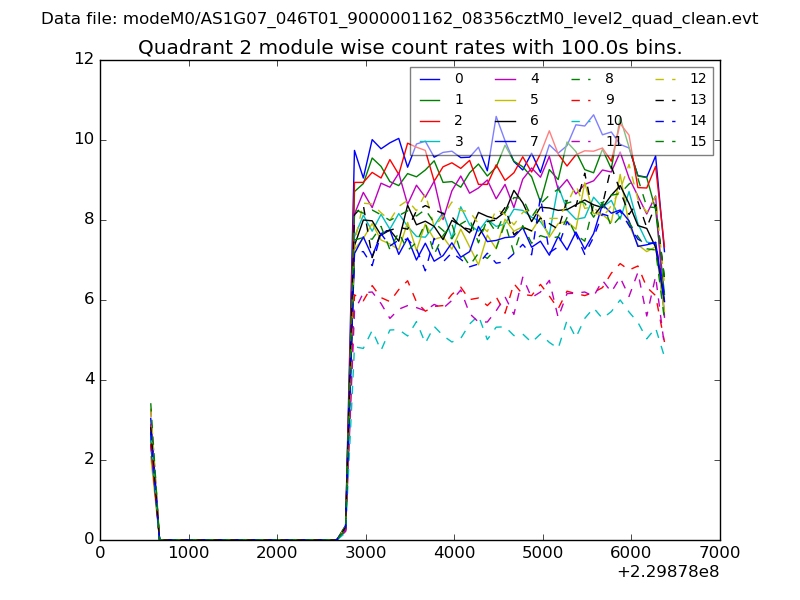
| Module-wise count rates for Quadrant B Data is divided into 100 sec bins |
 |
 |
| Module-wise count rates for Quadrant C Data is divided into 100 sec bins |
 |
 |
| Module-wise count rates for Quadrant D Data is divided into 100 sec bins |
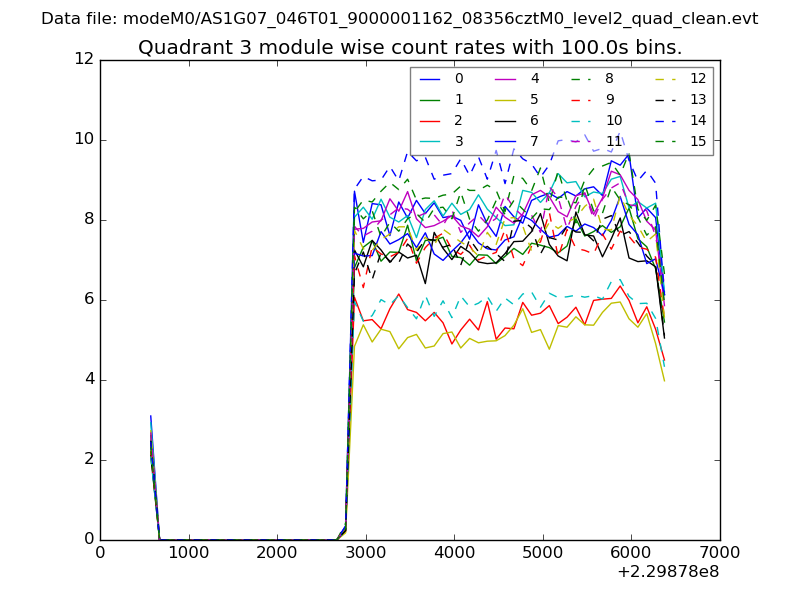 |
 |
| Parameter | Plot |
|---|---|
| CZT HV Monitor | 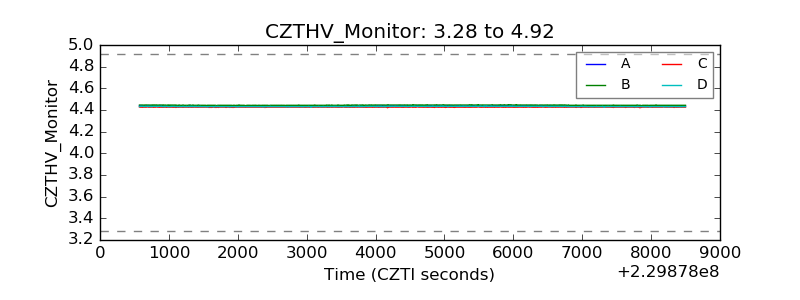 |
| D_VDD | 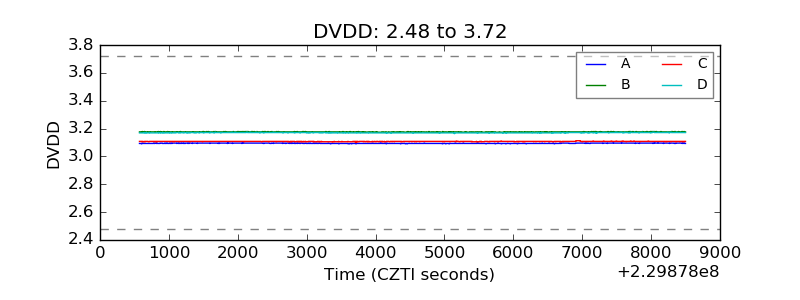 |
| Temperature 1 | 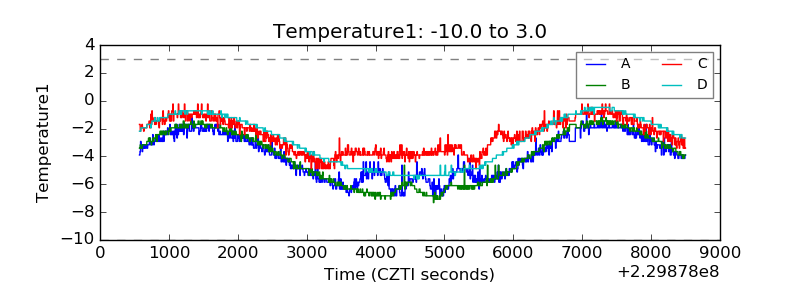 |
| Veto HV Monitor |  |
| Veto LLD | 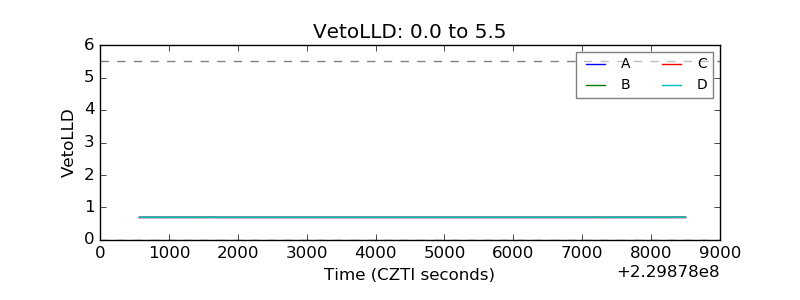 |
| Alpha Counter | 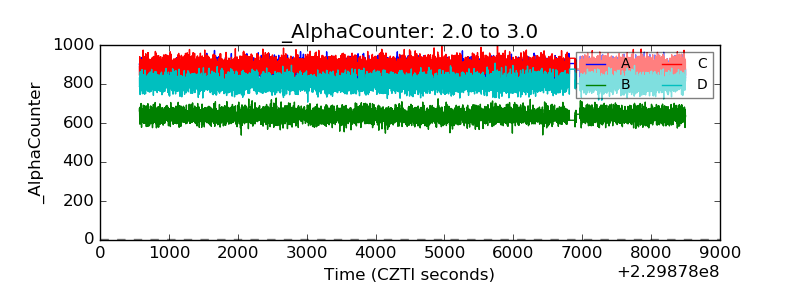 |
| _CPM_Rate | 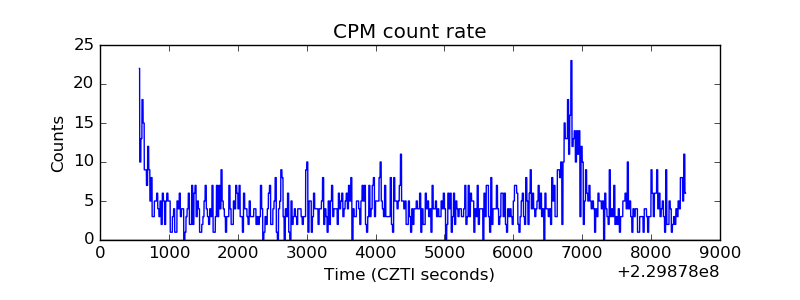 |
| CZT Counter | 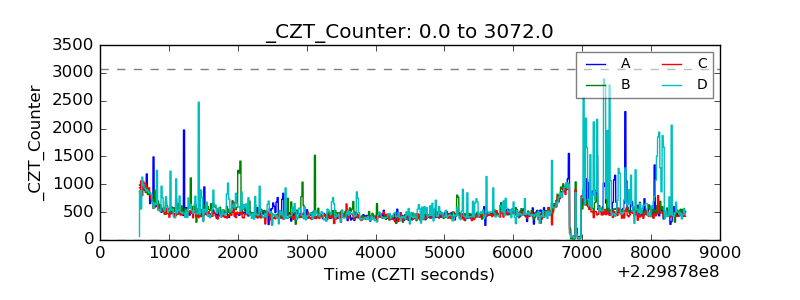 |
| +2.5 Volts monitor |  |
| +5 Volts monitor |  |
| _ROLL_ROT | 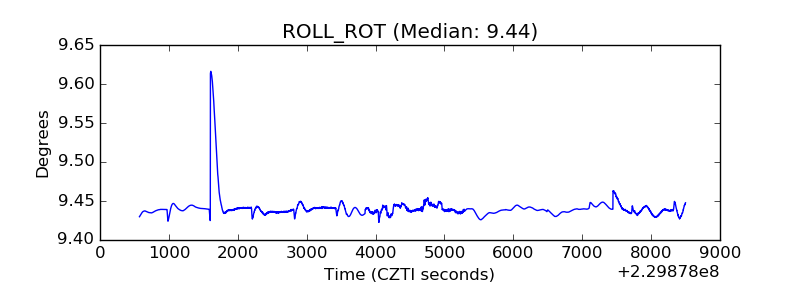 |
| _Roll_DEC | 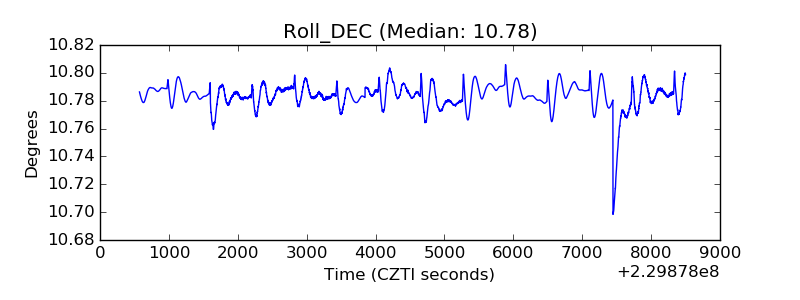 |
| _Roll_RA |  |
| Veto Counter | 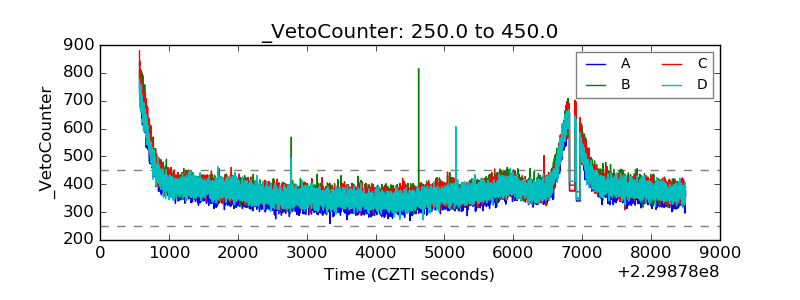 |