| Param | Original file | Final file |
|---|---|---|
| Filename | modeM0/AS1G07_046T01_9000001162_08357cztM0_level2.evt | modeM0/AS1G07_046T01_9000001162_08357cztM0_level2_quad_clean.evt |
| Size (bytes) | 569,399,040 | 79,689,600 |
| Size | 543.0 MB | 76.0 MB |
| Events in quadrant A | 3,967,715 | 478,326 |
| Events in quadrant B | 4,030,088 | 472,804 |
| Events in quadrant C | 3,577,593 | 475,120 |
| Events in quadrant D | 5,151,517 | 456,338 |
| Mode M0 | |||
|---|---|---|---|
| Quadrant | BADHDUFLAG | Total packets | Discarded packets |
| A | 0 | 16821 | 14 |
| B | 0 | 16751 | 6 |
| C | 0 | 15754 | 4 |
| D | 0 | 20610 | 2 |
| Mode M9 | |||
|---|---|---|---|
| Quadrant | BADHDUFLAG | Total packets | Discarded packets |
| A | 0 | 5 | 0 |
| B | 0 | 5 | 0 |
| C | 0 | 5 | 0 |
| D | 0 | 5 | 0 |
| Mode SS | |||
|---|---|---|---|
| Quadrant | BADHDUFLAG | Total packets | Discarded packets |
| A | 0 | 156 | 0 |
| B | 0 | 156 | 0 |
| C | 0 | 156 | 0 |
| D | 0 | 156 | 0 |
| Quadrant | Total seconds | Saturated seconds | Saturation percentage |
|---|---|---|---|
| A | 7625 | 208 | 2.727869% |
| B | 7626 | 212 | 2.779963% |
| C | 7627 | 130 | 1.704471% |
| D | 7628 | 378 | 4.955427% |
Noise dominated data is calculated using 1-second bins in cleaned event files. If a bin has >2000 counts, and if more than 50% of those come from <1% of pixels, then it is considered to be noise-dominated and hence unusable.
| Quadrant | # 1 sec bins | Bins with >0 counts | Bins with >2000 counts | High rate bins dominated by noise | Noise dominated (total time) | Noise dominated (detector-on time) | Marked lightcurve |
|---|---|---|---|---|---|---|---|
| A | 8113 | 7631 | 35 | 35 | 0.43% | 0.46% | 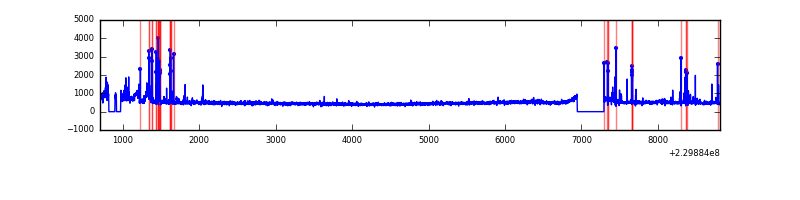 |
| B | 8113 | 7631 | 29 | 29 | 0.36% | 0.38% | 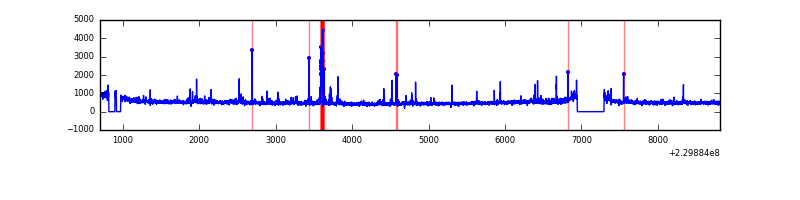 |
| C | 8113 | 7631 | 0 | 0 | 0.00% | 0.00% | 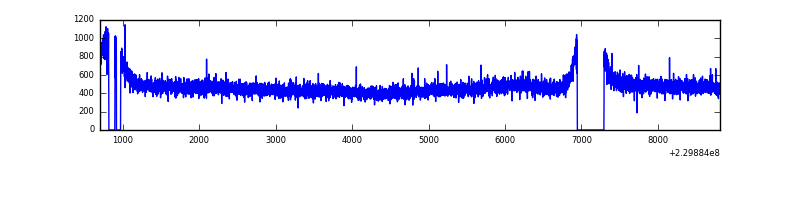 |
| D | 8113 | 7631 | 159 | 159 | 1.96% | 2.08% | 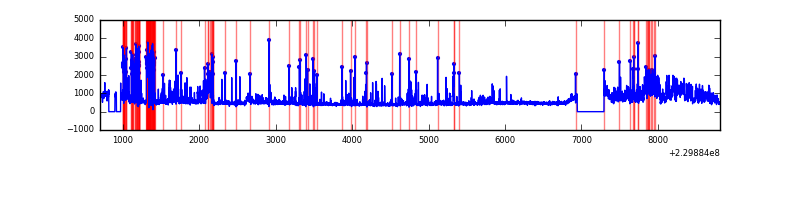 |
Top three noisy pixels from each quadrant. If the there are fewer than three noisy pixels in the level2.evt file, extra rows are filled as -1
| Pixel properties | Quadrant properties | ||||||
|---|---|---|---|---|---|---|---|
| Quadrant | DetID | PixID | Counts | Sigma | Mean | Median | Sigma |
| A | 15 | 239 | 291145 | 1496.91 | 936 | 915 | 193.9 |
| A | 15 | 223 | 41036 | 206.93 | 936 | 915 | 193.9 |
| A | 13 | 14 | 17250 | 84.25 | 936 | 915 | 193.9 |
| B | 0 | 214 | 99238 | 538.24 | 939 | 916 | 182.7 |
| B | 10 | 16 | 89775 | 486.44 | 939 | 916 | 182.7 |
| B | 4 | 173 | 48543 | 260.72 | 939 | 916 | 182.7 |
| C | 8 | 208 | 8137 | 33.69 | 913 | 915 | 214.4 |
| C | 13 | 61 | 7070 | 28.71 | 913 | 915 | 214.4 |
| C | 8 | 128 | 4607 | 17.22 | 913 | 915 | 214.4 |
| D | 9 | 102 | 734779 | 3059.83 | 894 | 873 | 239.9 |
| D | 13 | 105 | 520773 | 2167.59 | 894 | 873 | 239.9 |
| D | 2 | 152 | 192359 | 798.35 | 894 | 873 | 239.9 |
Histogram calculated using DETX and DETY for each event in the final _common_clean file
| Quadrant A | 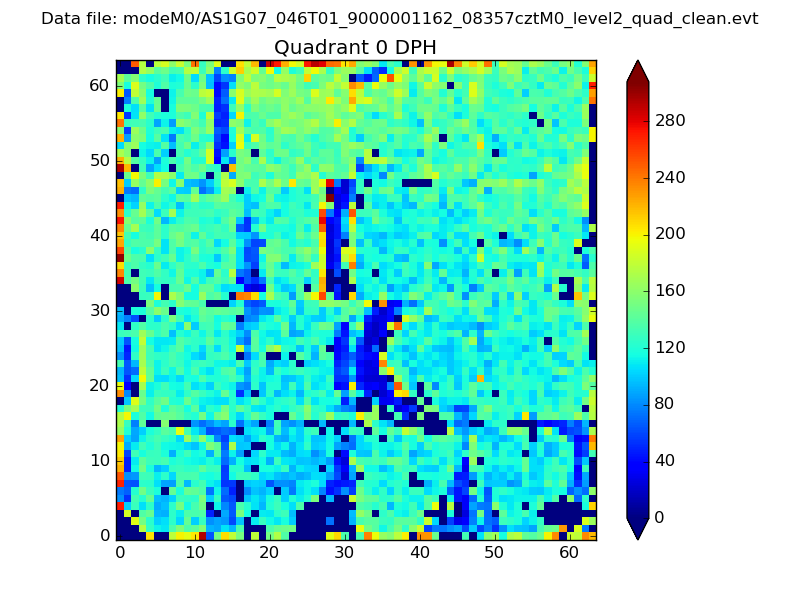 |
 |
Quadrant B |
|---|---|---|---|
| Quadrant D | 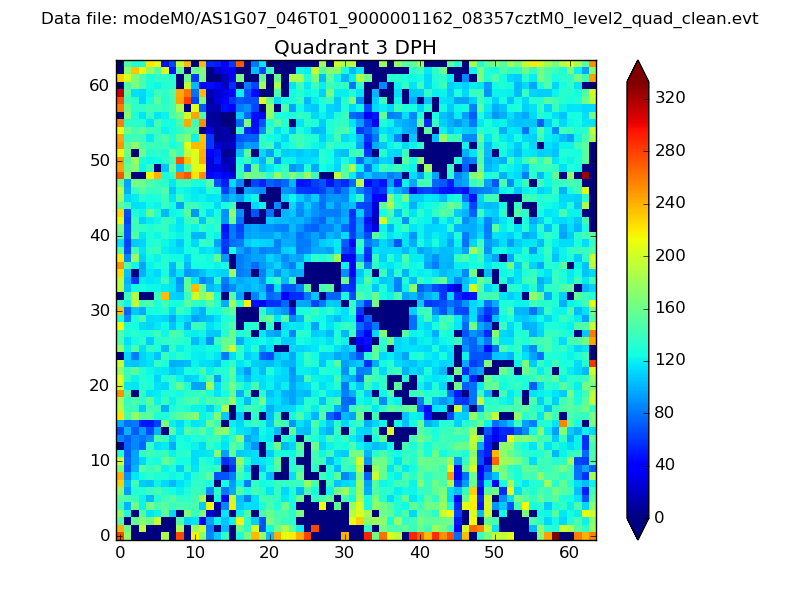 |
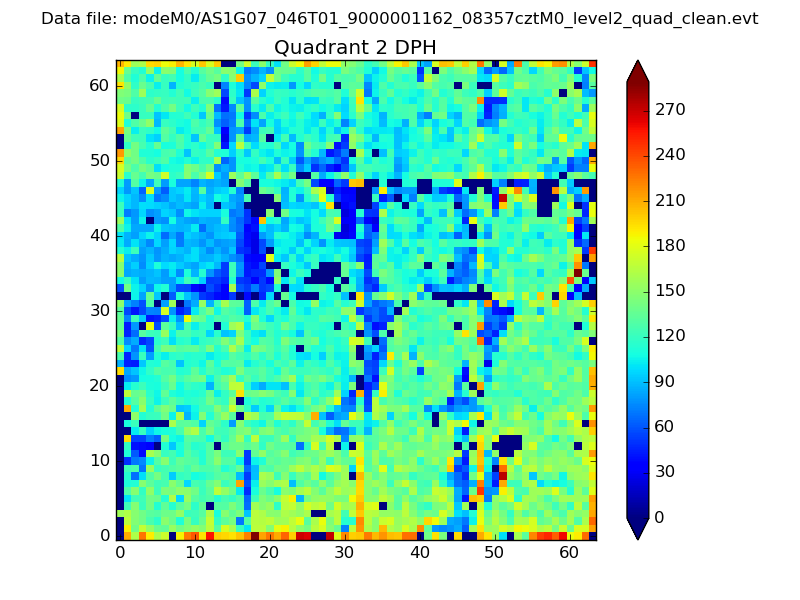 |
Quadrant C |
| Plot type | Count rate plots | Images |
|---|---|---|
| Comparison with Poisson distribution Blue bars denote a histogram of data divided into 1 sec bins. Red curve is a Poisson curve with rate = median count rate of data. |
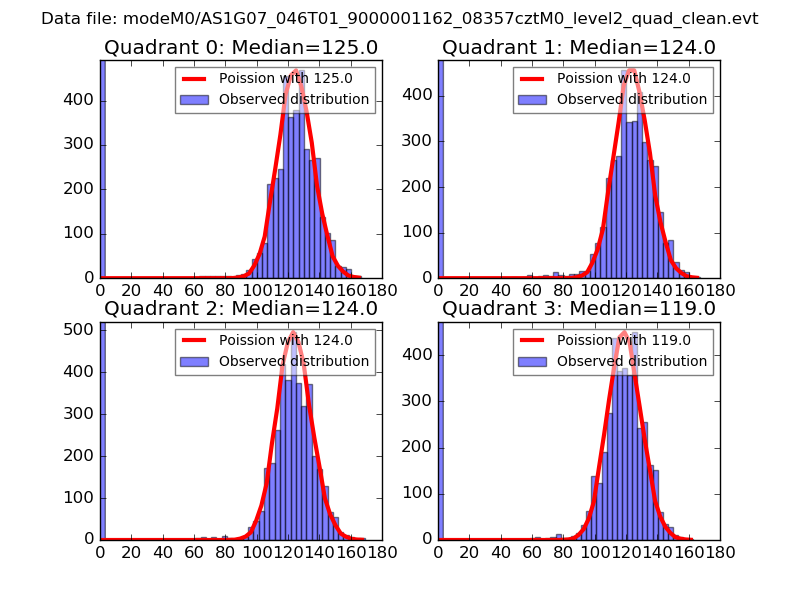 |
 |
| Quadrant-wise count rates Data is divided into 100 sec bins |
 |
|
| Module-wise count rates for Quadrant A Data is divided into 100 sec bins |
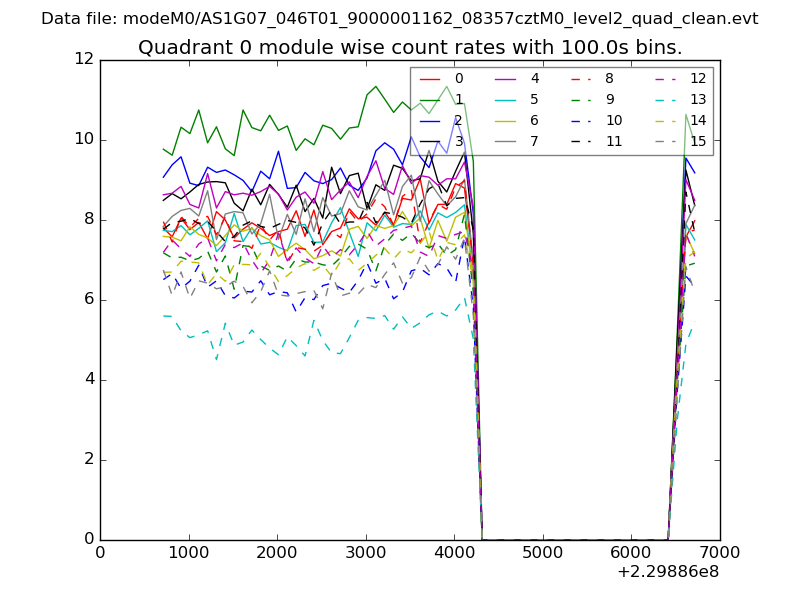 |
 |
| Module-wise count rates for Quadrant B Data is divided into 100 sec bins |
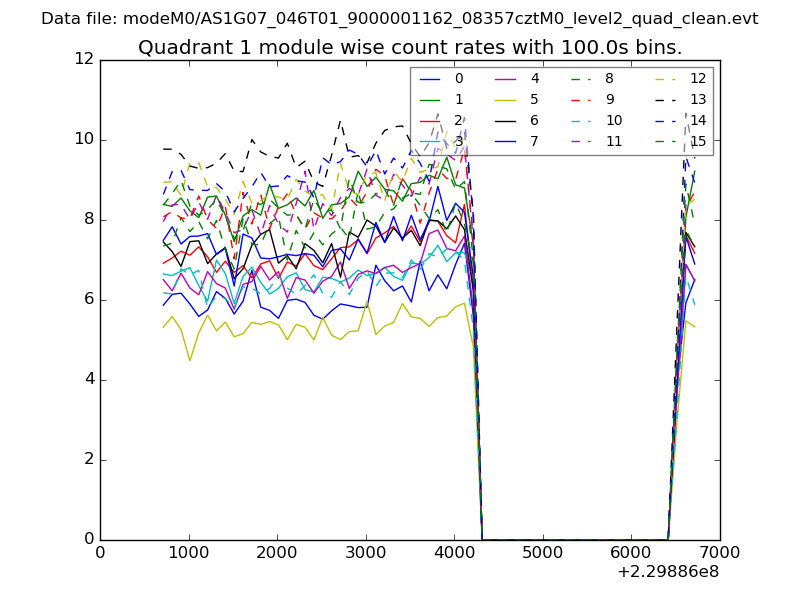 |
 |
| Module-wise count rates for Quadrant C Data is divided into 100 sec bins |
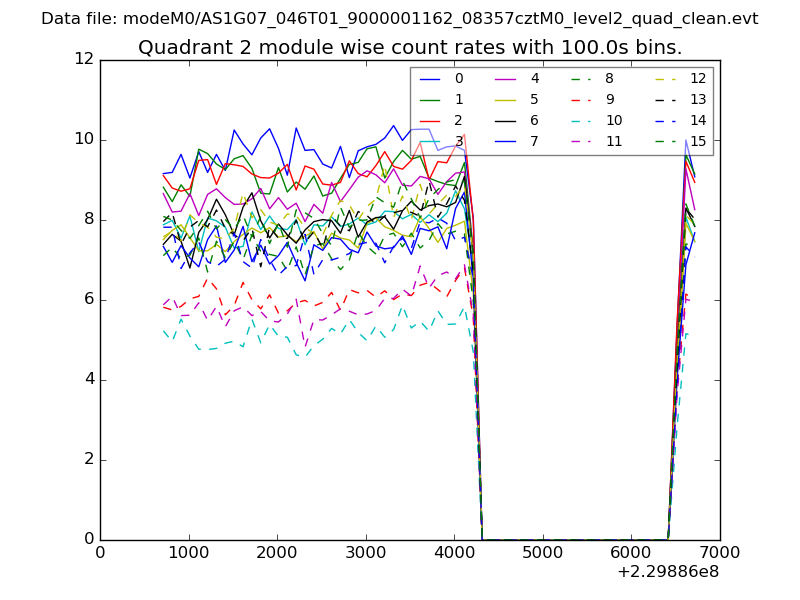 |
 |
| Module-wise count rates for Quadrant D Data is divided into 100 sec bins |
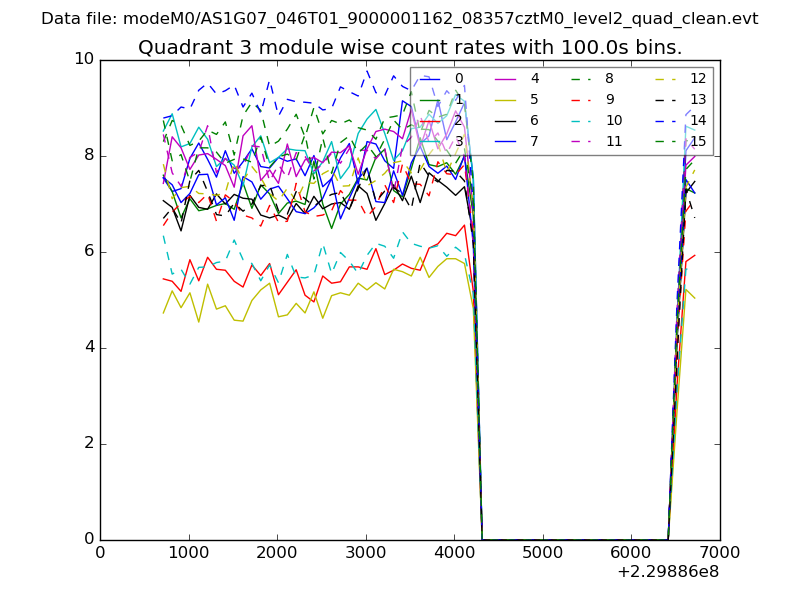 |
 |
| Parameter | Plot |
|---|---|
| CZT HV Monitor | 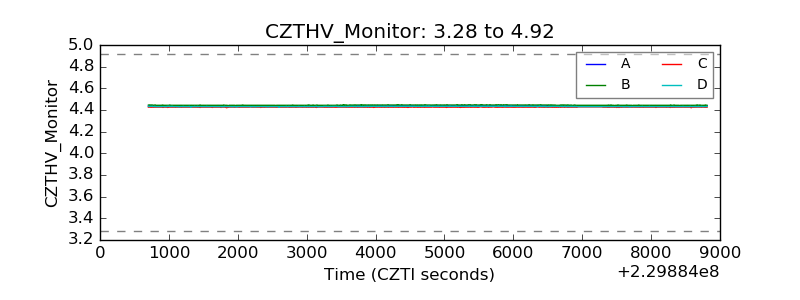 |
| D_VDD | 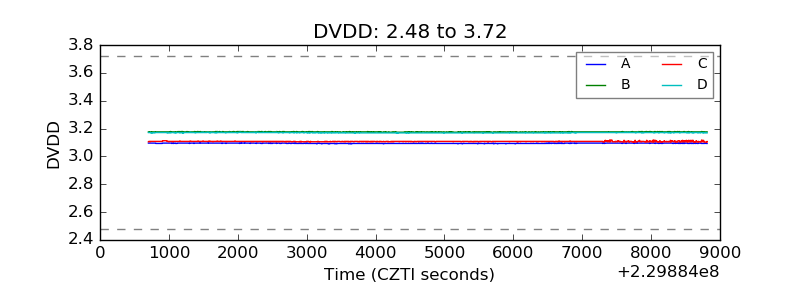 |
| Temperature 1 | 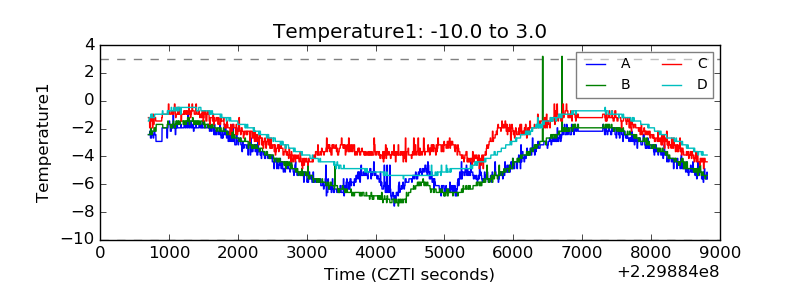 |
| Veto HV Monitor |  |
| Veto LLD | 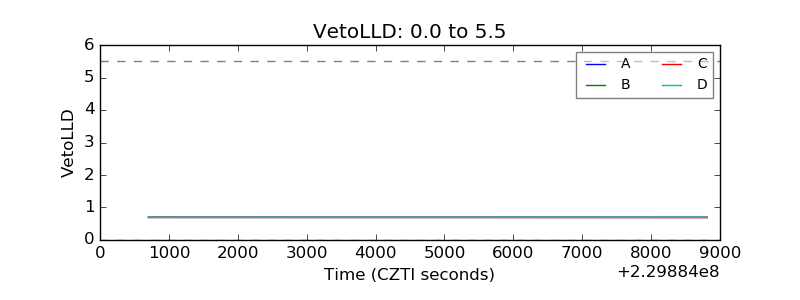 |
| Alpha Counter | 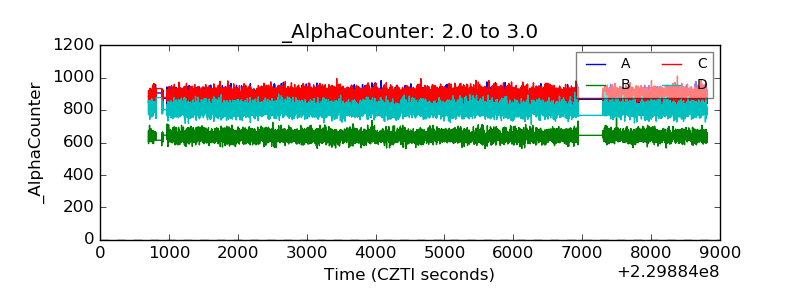 |
| _CPM_Rate | 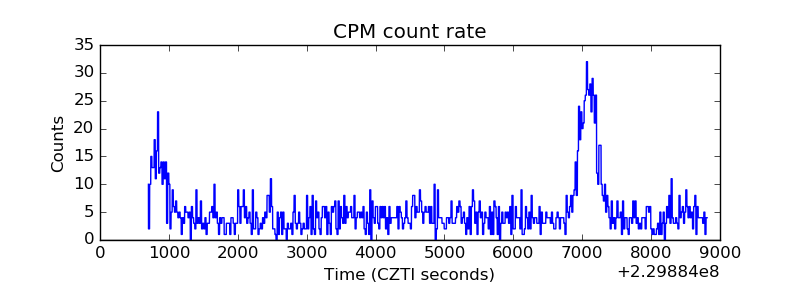 |
| CZT Counter | 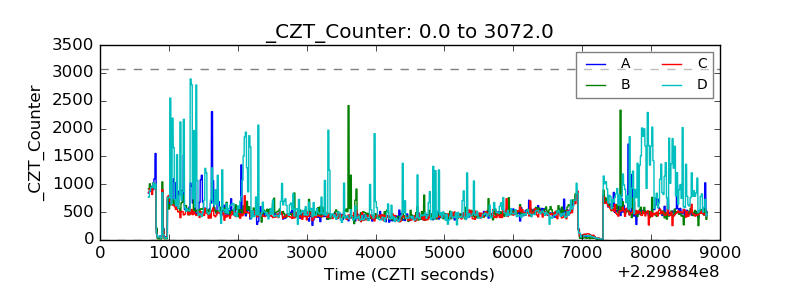 |
| +2.5 Volts monitor |  |
| +5 Volts monitor |  |
| _ROLL_ROT | 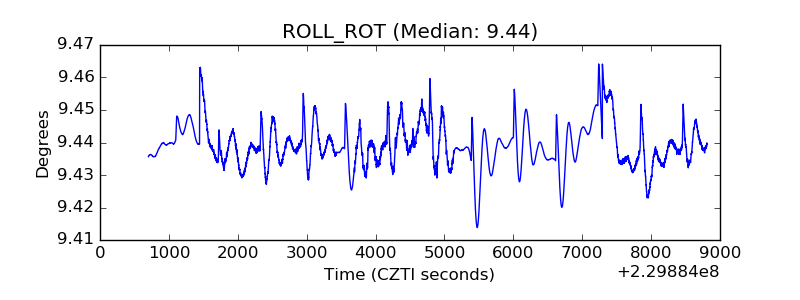 |
| _Roll_DEC | 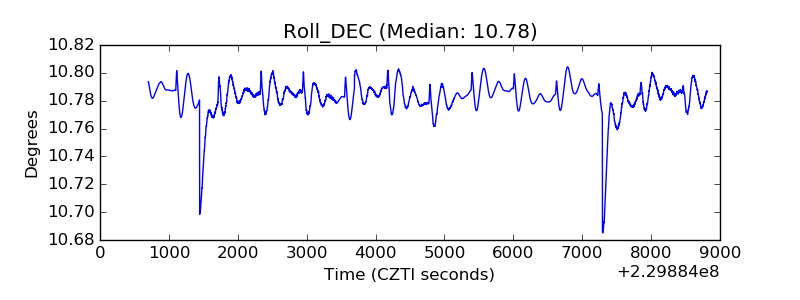 |
| _Roll_RA | 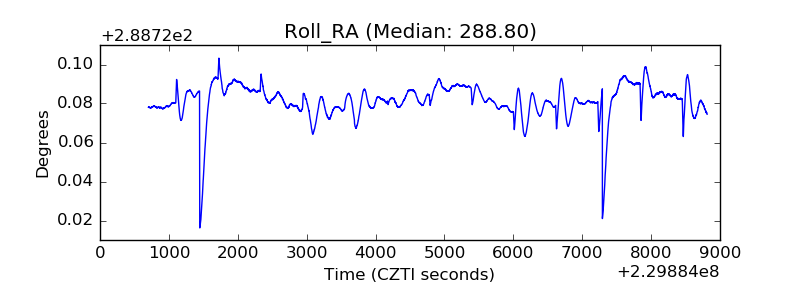 |
| Veto Counter | 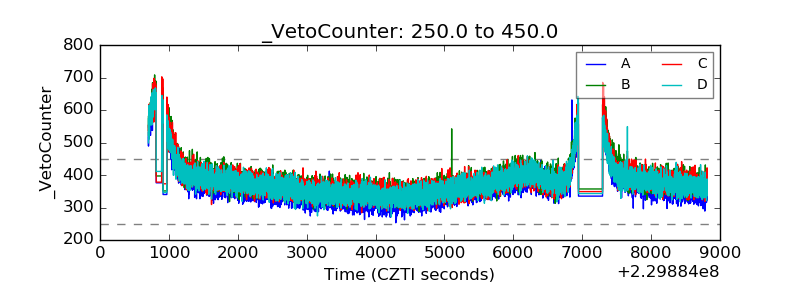 |