| Param | Original file | Final file |
|---|---|---|
| Filename | modeM0/AS1A03_036T01_9000001164cztM0_level2.fits | modeM0/AS1A03_036T01_9000001164cztM0_level2_quad_clean.evt |
| Size (bytes) | 541,039,680 | 584,974,080 |
| Size | 516.0 MB | 557.9 MB |
| Events in quadrant A | 3,245,538 | 3,557,364 |
| Events in quadrant B | 3,208,414 | 3,694,137 |
| Events in quadrant C | 3,232,092 | 3,433,383 |
| Events in quadrant D | 2,784,728 | 3,118,876 |
| Mode SS | |||
|---|---|---|---|
| Quadrant | BADHDUFLAG | Total packets | Discarded packets |
| A | 0 | 1164 | 0 |
| B | 0 | 1162 | 0 |
| C | 0 | 1164 | 0 |
| D | 0 | 1164 | 0 |
| Mode M0 | |||
|---|---|---|---|
| Quadrant | BADHDUFLAG | Total packets | Discarded packets |
| A | 0 | 130064 | 0 |
| B | 0 | 122137 | 0 |
| C | 0 | 118261 | 0 |
| D | 0 | 139549 | 0 |
| Mode M9 | |||
|---|---|---|---|
| Quadrant | BADHDUFLAG | Total packets | Discarded packets |
| A | 0 | 90 | 0 |
| B | 0 | 90 | 0 |
| C | 0 | 90 | 0 |
| D | 0 | 90 | 0 |
| Quadrant | Total seconds | Saturated seconds | Saturation percentage |
|---|---|---|---|
| A | 57038 | 2395 | 4.198955% |
| B | 57038 | 994 | 1.742698% |
| C | 57039 | 587 | 1.029120% |
| D | 57035 | 2181 | 3.823968% |
Noise dominated data is calculated using 1-second bins in cleaned event files. If a bin has >2000 counts, and if more than 50% of those come from <1% of pixels, then it is considered to be noise-dominated and hence unusable.
| Quadrant | # 1 sec bins | Bins with >0 counts | Bins with >2000 counts | High rate bins dominated by noise | Noise dominated (total time) | Noise dominated (detector-on time) | Marked lightcurve |
|---|---|---|---|---|---|---|---|
| A | 66168 | 57027 | 0 | 0 | 0.00% | 0.00% |  |
| B | 66168 | 57042 | 0 | 0 | 0.00% | 0.00% |  |
| C | 66168 | 57041 | 0 | 0 | 0.00% | 0.00% | 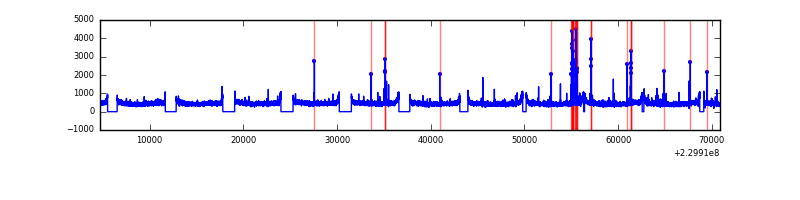 |
| D | 66168 | 57037 | 0 | 0 | 0.00% | 0.00% | 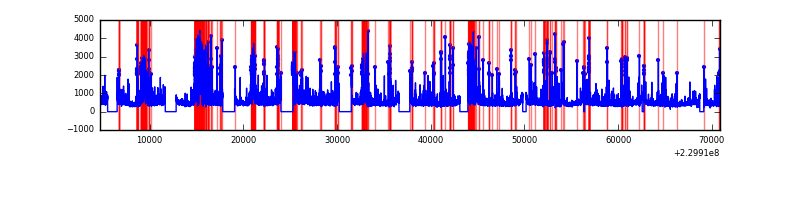 |
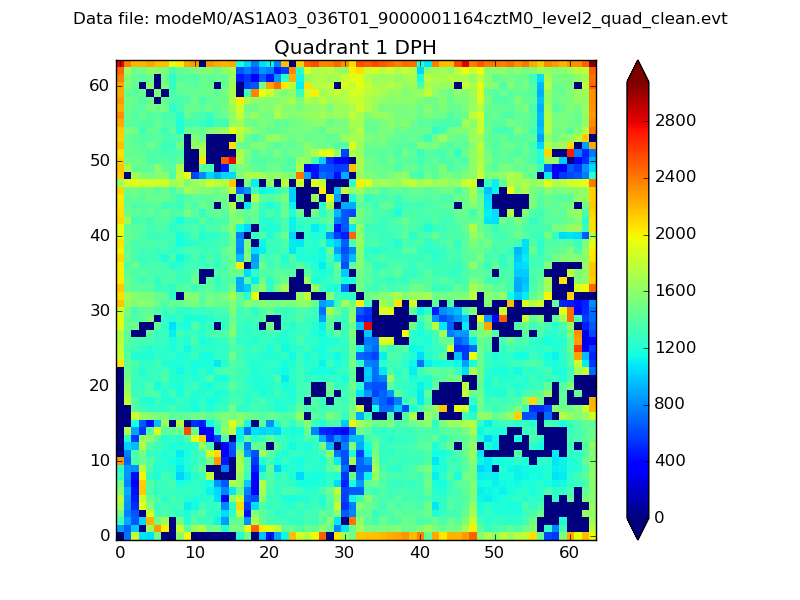
Top three noisy pixels from each quadrant. If the there are fewer than three noisy pixels in the level2.evt file, extra rows are filled as -1
| Pixel properties | Quadrant properties | ||||||
|---|---|---|---|---|---|---|---|
| Quadrant | DetID | PixID | Counts | Sigma | Mean | Median | Sigma |
| A | 0 | 29 | 3157 | 11.27 | 846 | 792 | 209.9 |
| A | 7 | 110 | 2809 | 9.61 | 846 | 792 | 209.9 |
| A | 9 | 19 | 2482 | 8.05 | 846 | 792 | 209.9 |
| B | 2 | 9 | 2724 | 11.64 | 845 | 805 | 164.8 |
| B | 12 | 226 | 2188 | 8.39 | 845 | 805 | 164.8 |
| B | 5 | 128 | 2146 | 8.14 | 845 | 805 | 164.8 |
| C | 1 | 81 | 2368 | 7.0 | 853 | 792 | 225.0 |
| C | 12 | 241 | 2307 | 6.73 | 853 | 792 | 225.0 |
| C | 1 | 80 | 2307 | 6.73 | 853 | 792 | 225.0 |
| D | 6 | 231 | 1986 | 5.93 | 794 | 722 | 213.0 |
| D | 1 | 19 | 1977 | 5.89 | 794 | 722 | 213.0 |
| D | 1 | 3 | 1941 | 5.72 | 794 | 722 | 213.0 |
Histogram calculated using DETX and DETY for each event in the final _common_clean file
| Quadrant A |  |
 |
Quadrant B |
|---|---|---|---|
| Quadrant D | 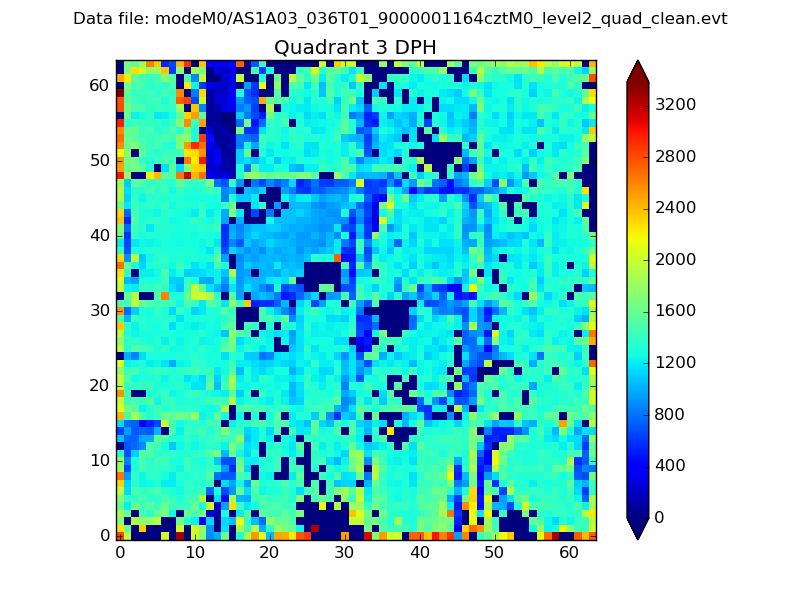 |
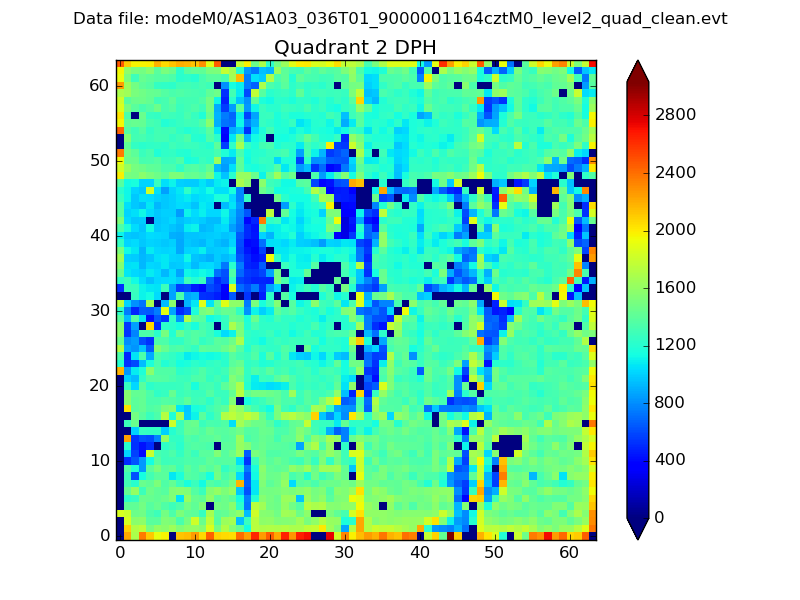 |
Quadrant C |
| Plot type | Count rate plots | Images |
|---|---|---|
| Comparison with Poisson distribution Blue bars denote a histogram of data divided into 1 sec bins. Red curve is a Poisson curve with rate = median count rate of data. |
 |
 |
| Quadrant-wise count rates Data is divided into 100 sec bins |
 |
|
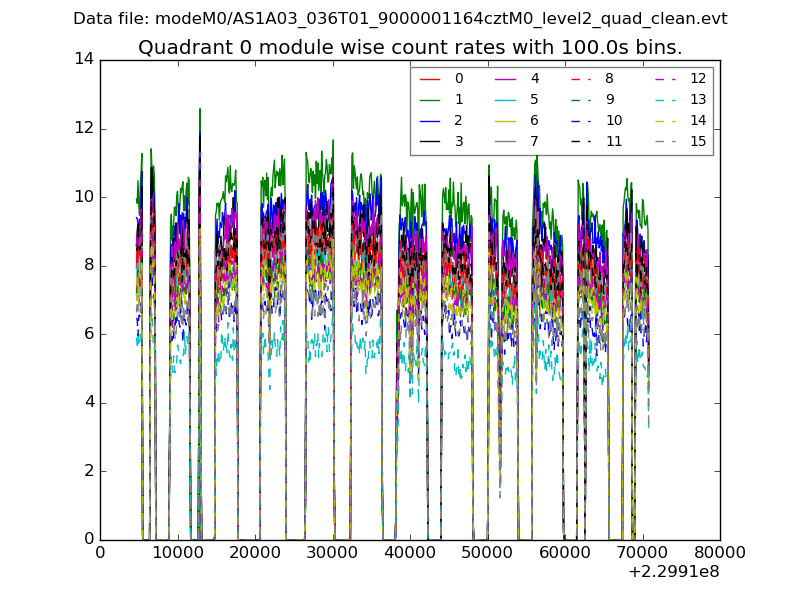
| Module-wise count rates for Quadrant A Data is divided into 100 sec bins |
 |
 |
| Module-wise count rates for Quadrant B Data is divided into 100 sec bins |
 |
 |
| Module-wise count rates for Quadrant C Data is divided into 100 sec bins |
 |
 |
| Module-wise count rates for Quadrant D Data is divided into 100 sec bins |
 |
 |
| Parameter | Plot |
|---|---|
| CZT HV Monitor | 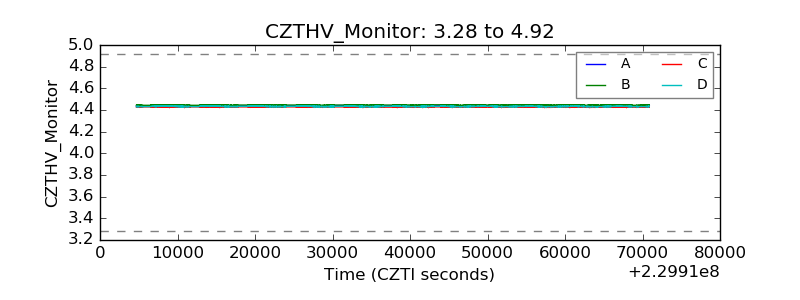 |
| D_VDD | 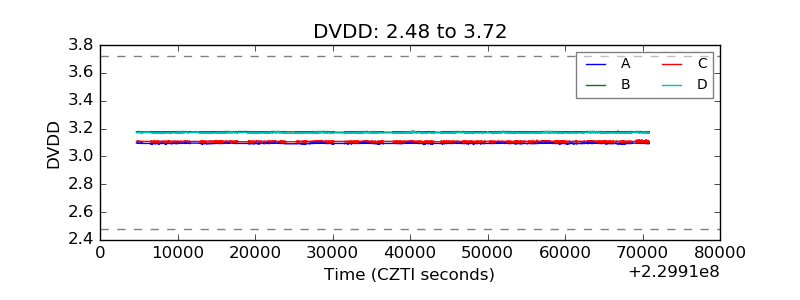 |
| Temperature 1 | 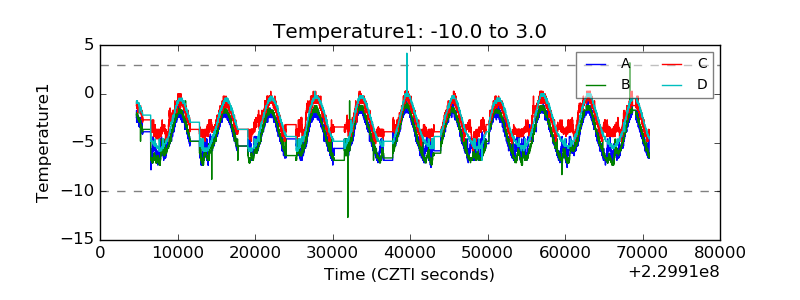 |
| Veto HV Monitor |  |
| Veto LLD |  |
| Alpha Counter |  |
| _CPM_Rate |  |
| CZT Counter |  |
| +2.5 Volts monitor |  |
| +5 Volts monitor | 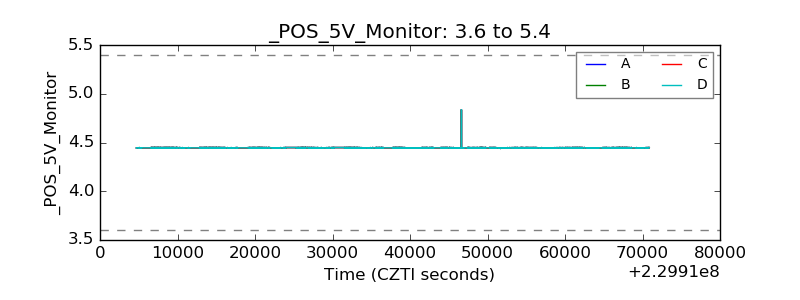 |
| _ROLL_ROT | 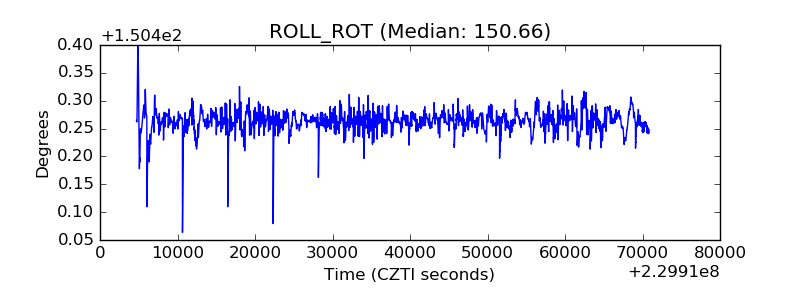 |
| _Roll_DEC | 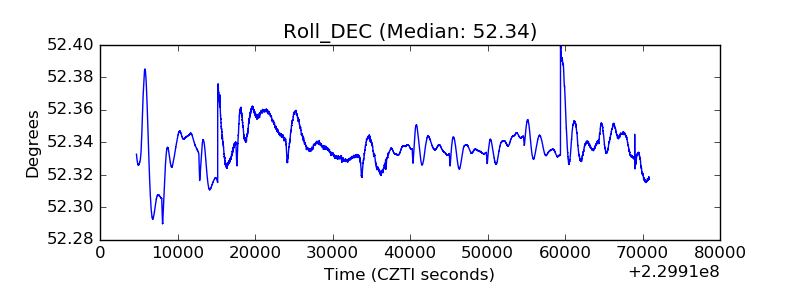 |
| _Roll_RA |  |
| Veto Counter | 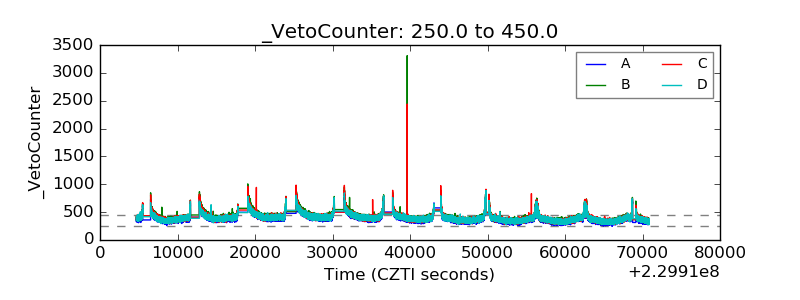 |