| Param | Original file | Final file |
|---|---|---|
| Filename | modeM0/AS1A03_036T01_9000001164_08361cztM0_level2.evt | modeM0/AS1A03_036T01_9000001164_08361cztM0_level2_quad_clean.evt |
| Size (bytes) | 147,876,480 | 30,957,120 |
| Size | 141.0 MB | 29.5 MB |
| Events in quadrant A | 1,031,322 | 198,041 |
| Events in quadrant B | 1,094,099 | 201,870 |
| Events in quadrant C | 1,026,645 | 196,607 |
| Events in quadrant D | 1,181,352 | 188,448 |
| Mode SS | |||
|---|---|---|---|
| Quadrant | BADHDUFLAG | Total packets | Discarded packets |
| A | 0 | 44 | 0 |
| B | 0 | 44 | 0 |
| C | 0 | 44 | 0 |
| D | 0 | 44 | 0 |
| Mode M0 | |||
|---|---|---|---|
| Quadrant | BADHDUFLAG | Total packets | Discarded packets |
| A | 0 | 4346 | 2 |
| B | 0 | 4486 | 1 |
| C | 0 | 4326 | 1 |
| D | 0 | 4853 | 1 |
| Mode M9 | |||
|---|---|---|---|
| Quadrant | BADHDUFLAG | Total packets | Discarded packets |
| A | 0 | 10 | 0 |
| B | 0 | 10 | 0 |
| C | 0 | 10 | 0 |
| D | 0 | 10 | 0 |
| Quadrant | Total seconds | Saturated seconds | Saturation percentage |
|---|---|---|---|
| A | 2095 | 21 | 1.002387% |
| B | 2095 | 36 | 1.718377% |
| C | 2095 | 14 | 0.668258% |
| D | 2095 | 21 | 1.002387% |
Noise dominated data is calculated using 1-second bins in cleaned event files. If a bin has >2000 counts, and if more than 50% of those come from <1% of pixels, then it is considered to be noise-dominated and hence unusable.
| Quadrant | # 1 sec bins | Bins with >0 counts | Bins with >2000 counts | High rate bins dominated by noise | Noise dominated (total time) | Noise dominated (detector-on time) | Marked lightcurve |
|---|---|---|---|---|---|---|---|
| A | 3120 | 2096 | 0 | 0 | 0.00% | 0.00% | 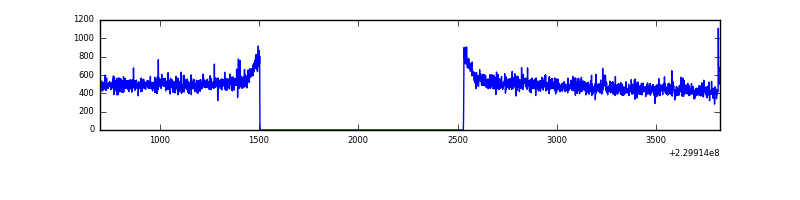 |
| B | 3120 | 2096 | 0 | 0 | 0.00% | 0.00% | 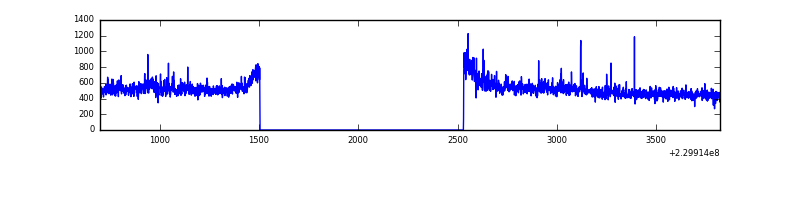 |
| C | 3120 | 2096 | 0 | 0 | 0.00% | 0.00% | 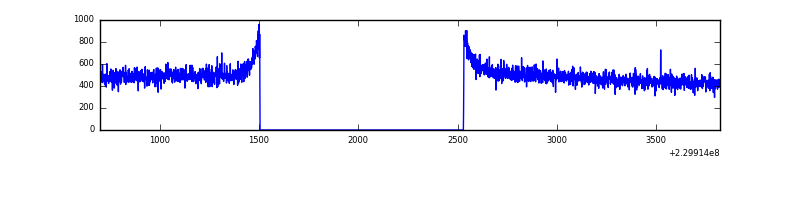 |
| D | 3120 | 2096 | 5 | 5 | 0.16% | 0.24% | 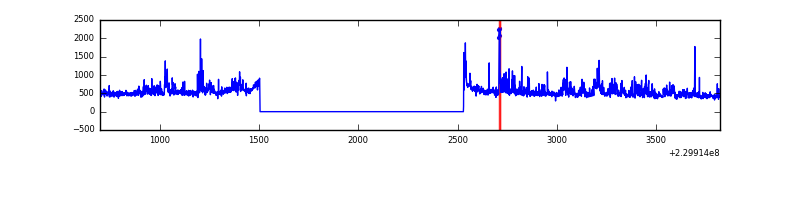 |
Top three noisy pixels from each quadrant. If the there are fewer than three noisy pixels in the level2.evt file, extra rows are filled as -1
| Pixel properties | Quadrant properties | ||||||
|---|---|---|---|---|---|---|---|
| Quadrant | DetID | PixID | Counts | Sigma | Mean | Median | Sigma |
| A | 15 | 239 | 4227 | 72.11 | 265 | 259 | 55.0 |
| A | 13 | 251 | 3676 | 62.1 | 265 | 259 | 55.0 |
| A | 14 | 111 | 3204 | 53.52 | 265 | 259 | 55.0 |
| B | 0 | 214 | 16424 | 305.51 | 269 | 262 | 52.9 |
| B | 4 | 81 | 14021 | 260.09 | 269 | 262 | 52.9 |
| B | 4 | 173 | 10340 | 190.51 | 269 | 262 | 52.9 |
| C | 13 | 61 | 2027 | 28.09 | 263 | 264 | 62.8 |
| C | 3 | 202 | 629 | 5.82 | 263 | 264 | 62.8 |
| C | -1 | -1 | -1 | -1.0 | 263 | 264 | 62.8 |
| D | 2 | 152 | 124778 | 1925.78 | 259 | 250 | 64.7 |
| D | 7 | 71 | 23759 | 363.56 | 259 | 250 | 64.7 |
| D | 1 | 52 | 14360 | 218.21 | 259 | 250 | 64.7 |
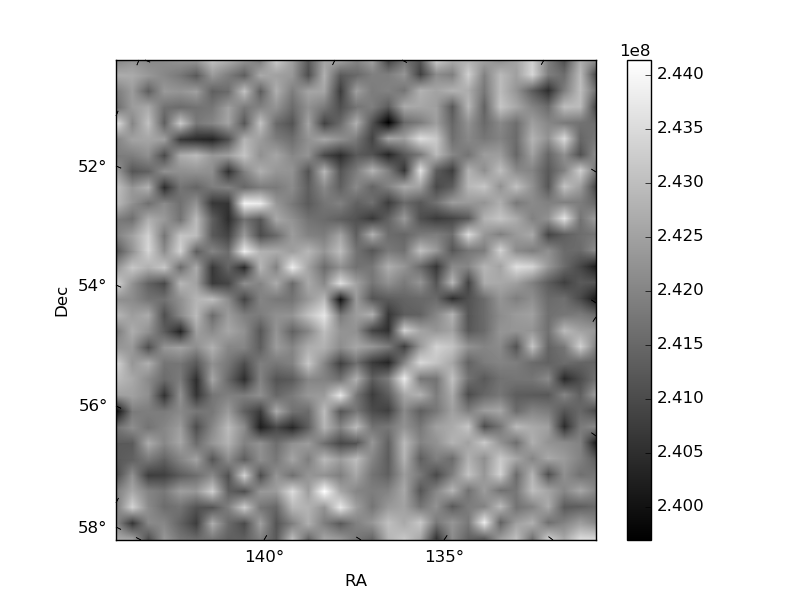
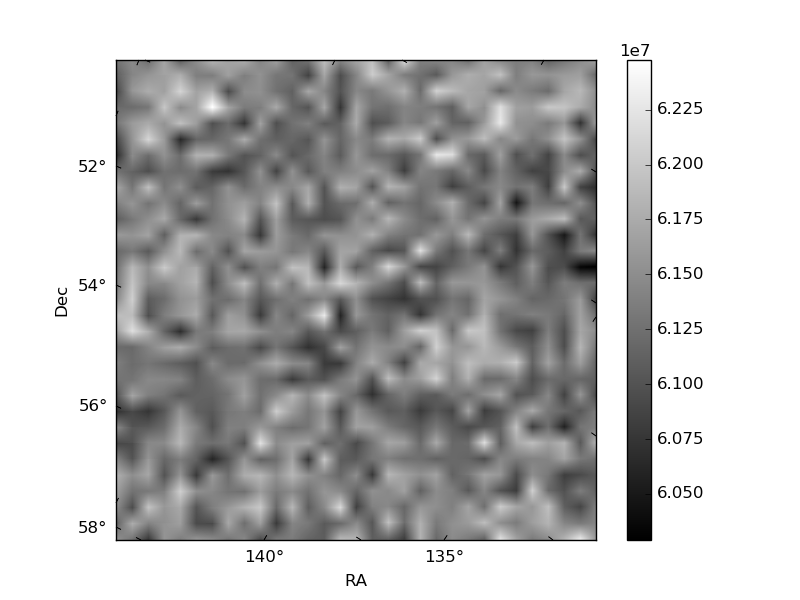
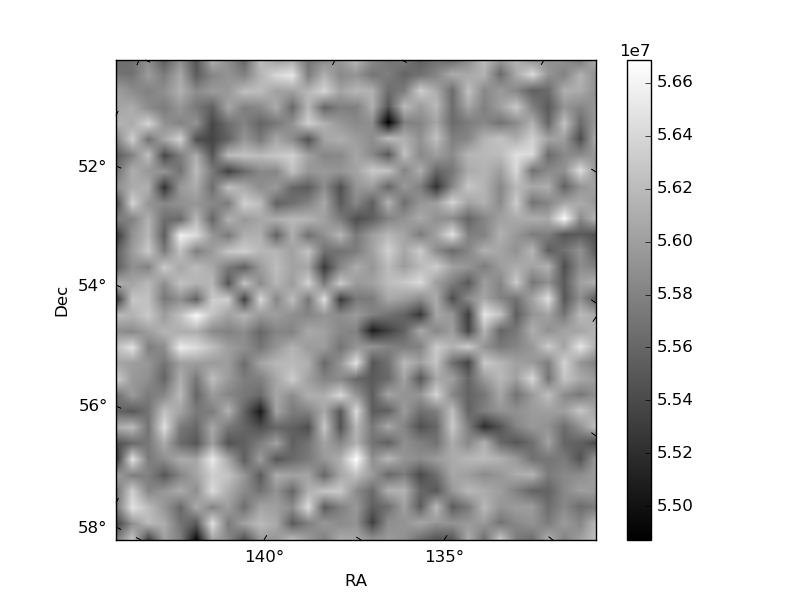
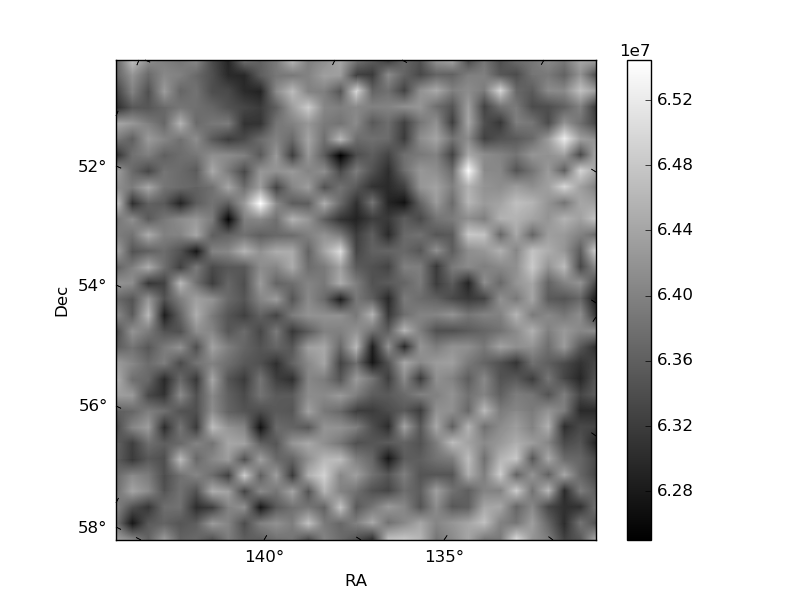
Histogram calculated using DETX and DETY for each event in the final _common_clean file
| Quadrant A | 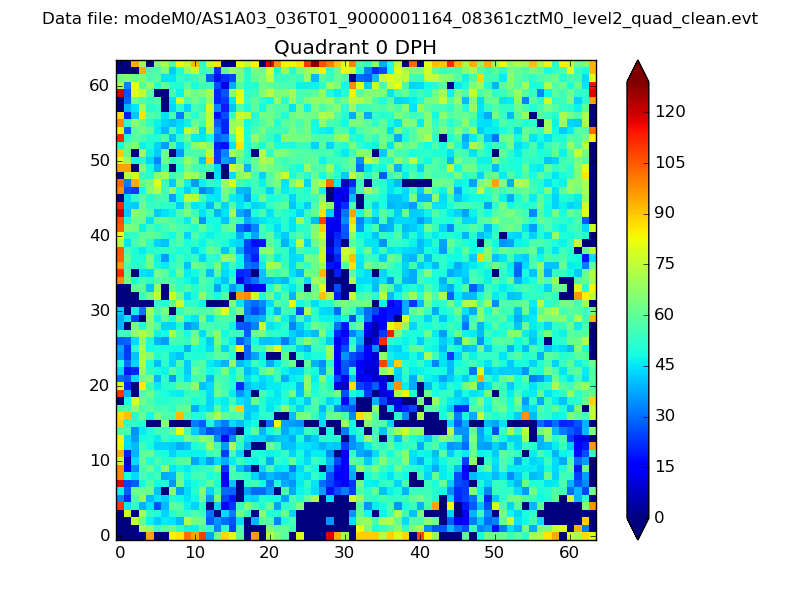 |
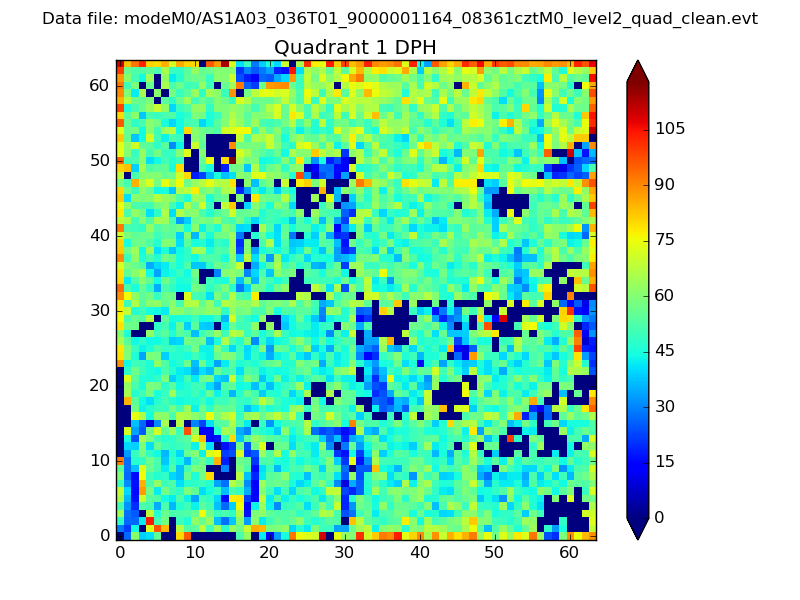 |
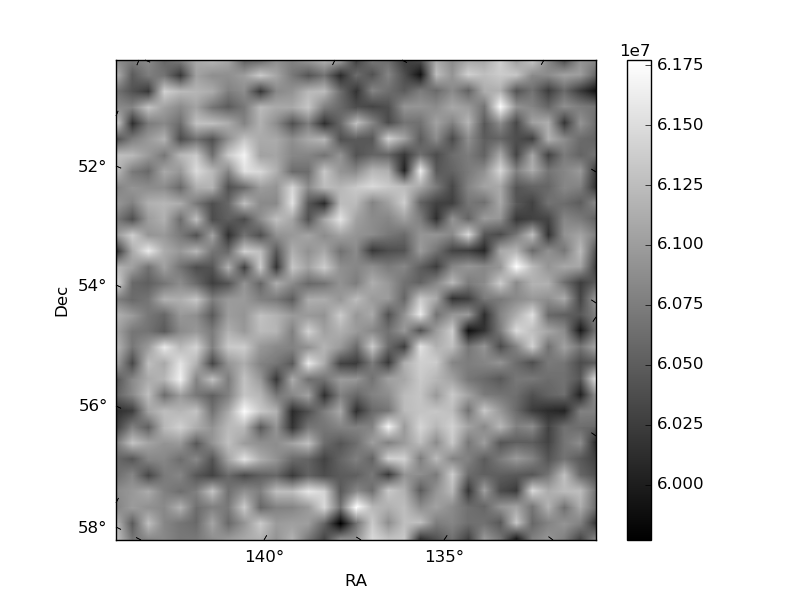
Quadrant B |
|---|---|---|---|
| Quadrant D | 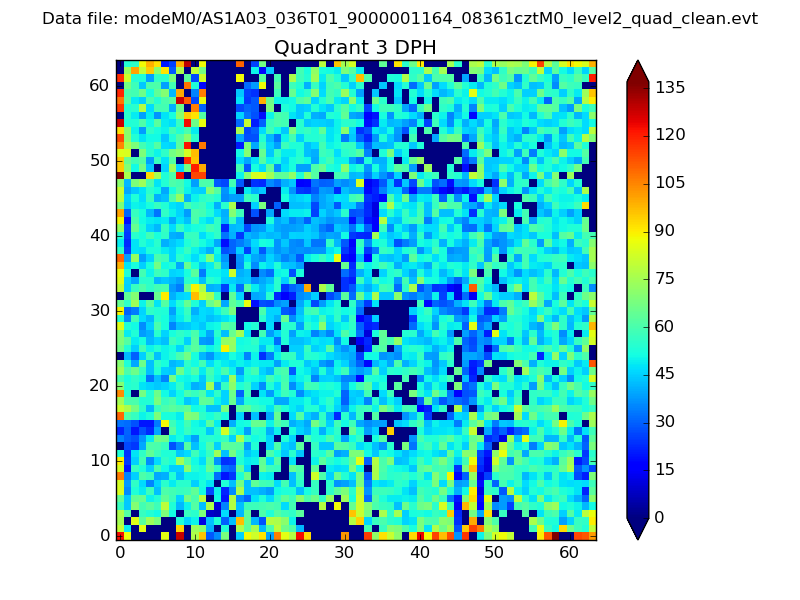 |
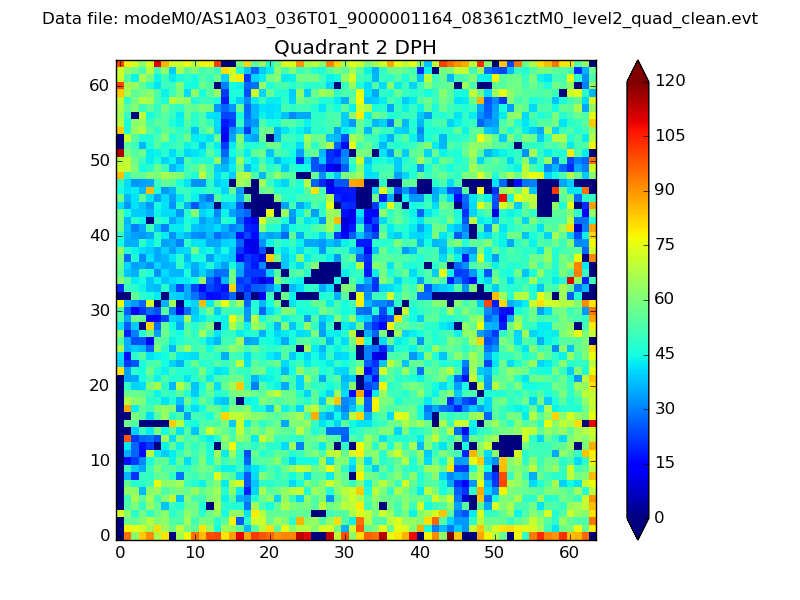 |
Quadrant C |
| Plot type | Count rate plots | Images |
|---|---|---|
| Comparison with Poisson distribution Blue bars denote a histogram of data divided into 1 sec bins. Red curve is a Poisson curve with rate = median count rate of data. |
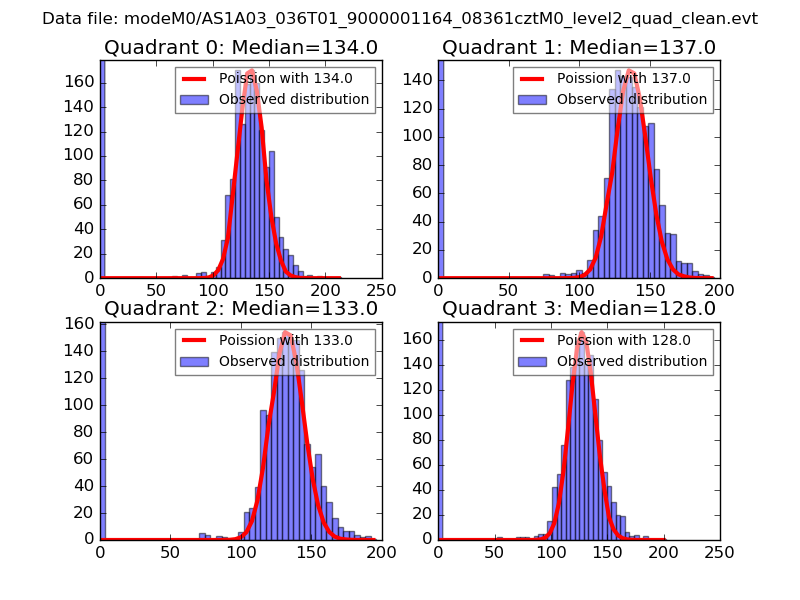 |
 |
| Quadrant-wise count rates Data is divided into 100 sec bins |
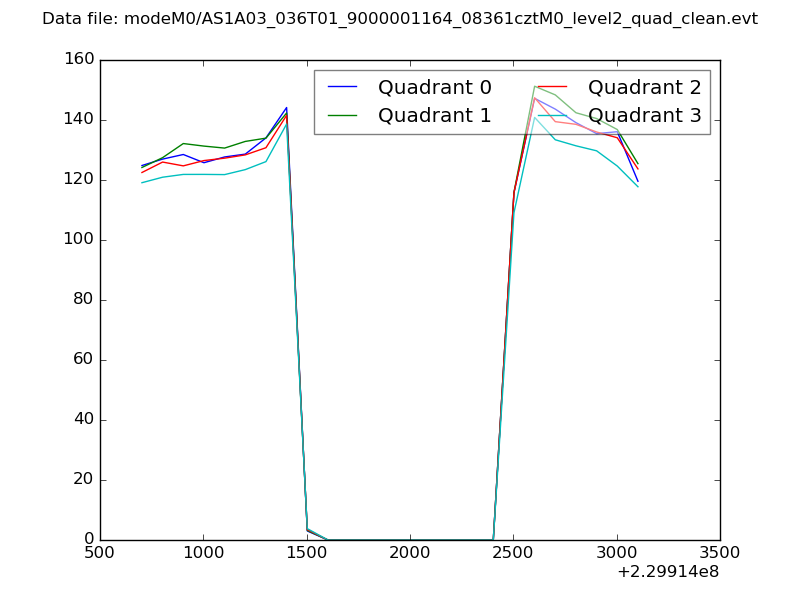 |
|
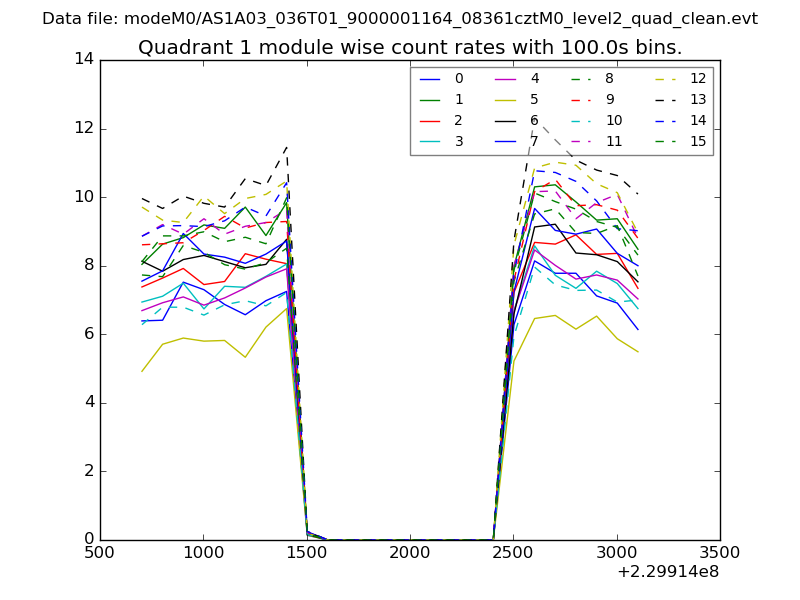
| Module-wise count rates for Quadrant A Data is divided into 100 sec bins |
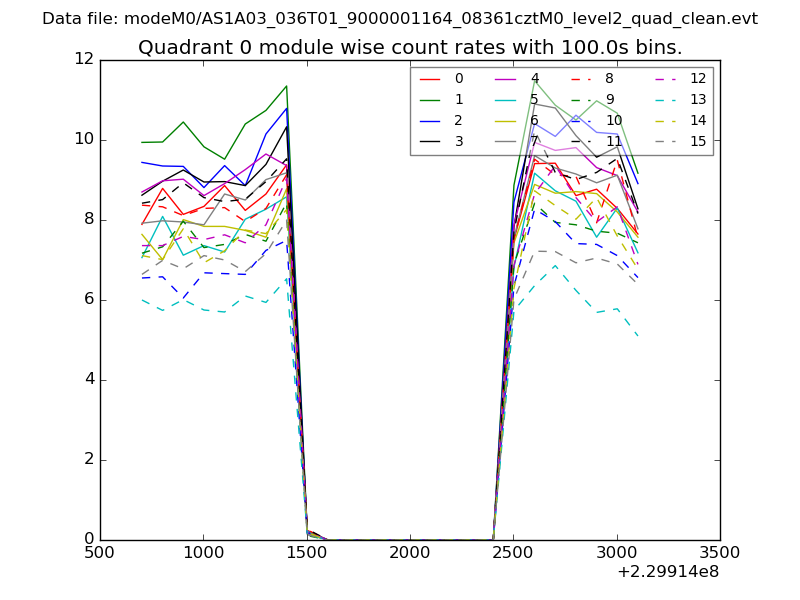 |
 |
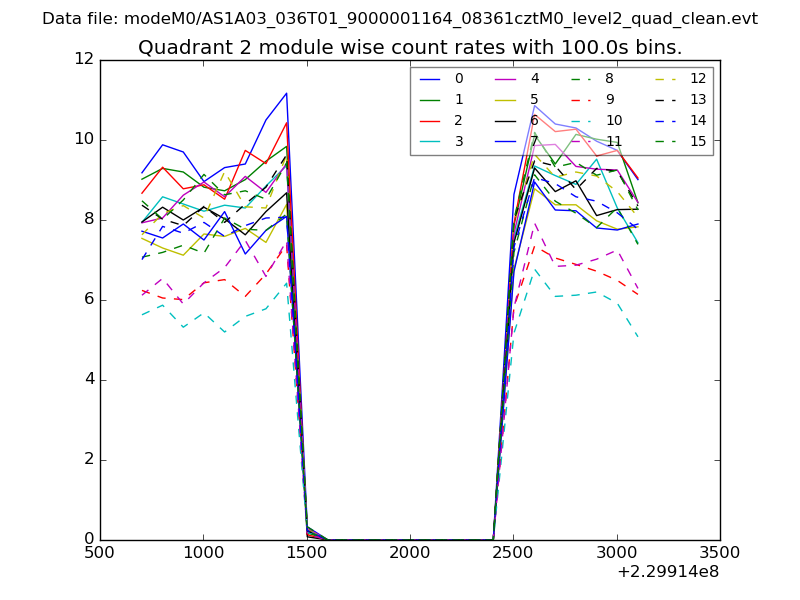
| Module-wise count rates for Quadrant B Data is divided into 100 sec bins |
 |
 |
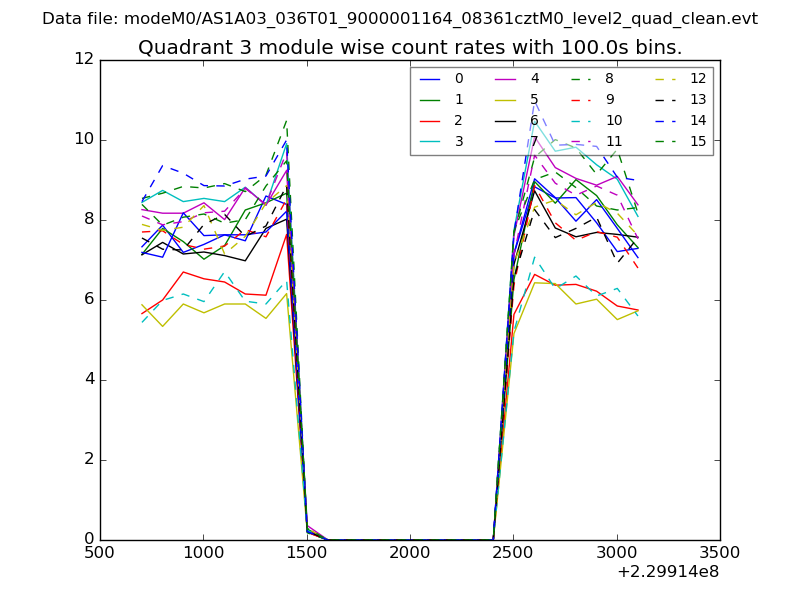
| Module-wise count rates for Quadrant C Data is divided into 100 sec bins |
 |
 |
| Module-wise count rates for Quadrant D Data is divided into 100 sec bins |
 |
 |
| Parameter | Plot |
|---|---|
| CZT HV Monitor | 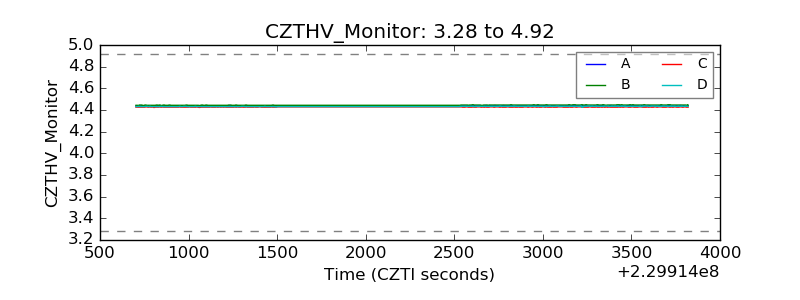 |
| D_VDD | 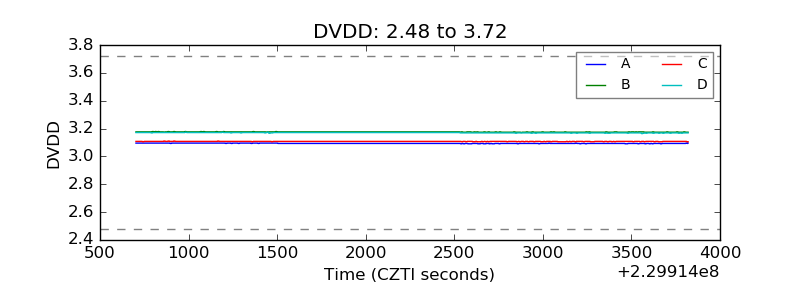 |
| Temperature 1 | 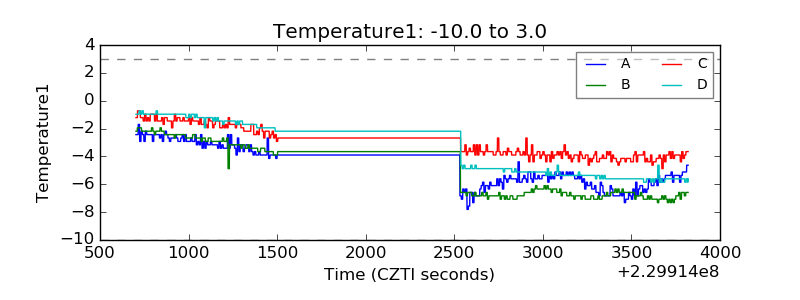 |
| Veto HV Monitor | 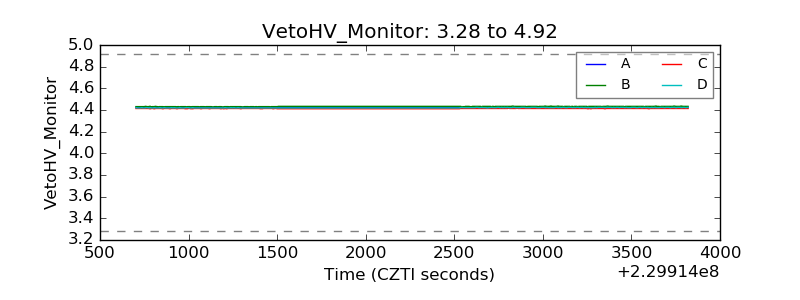 |
| Veto LLD | 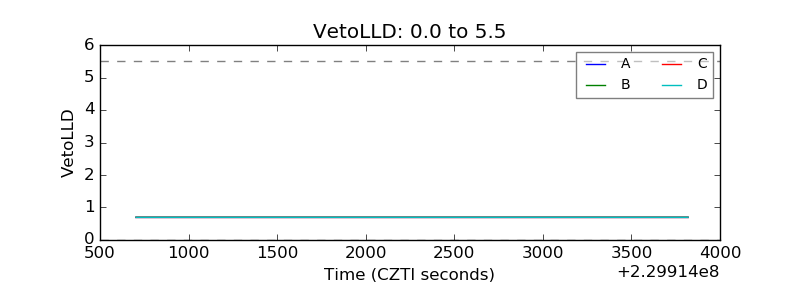 |
| Alpha Counter | 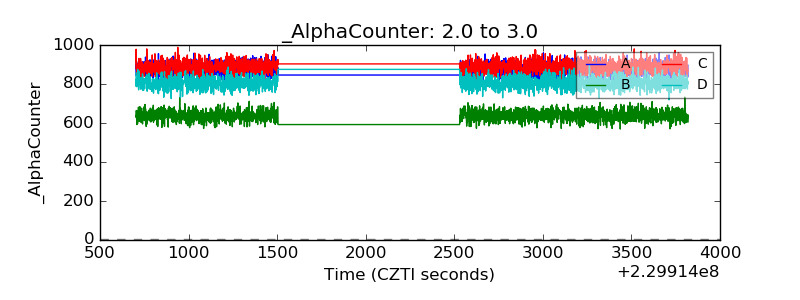 |
| _CPM_Rate | 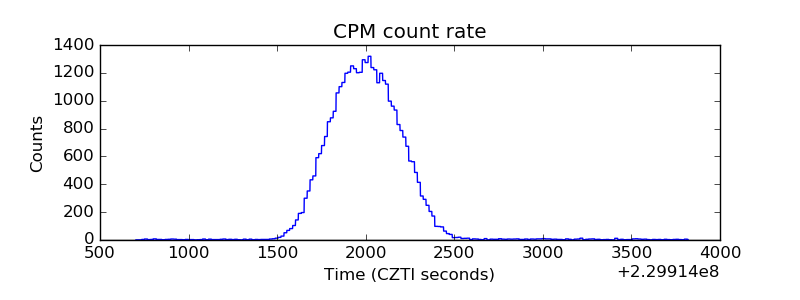 |
| CZT Counter | 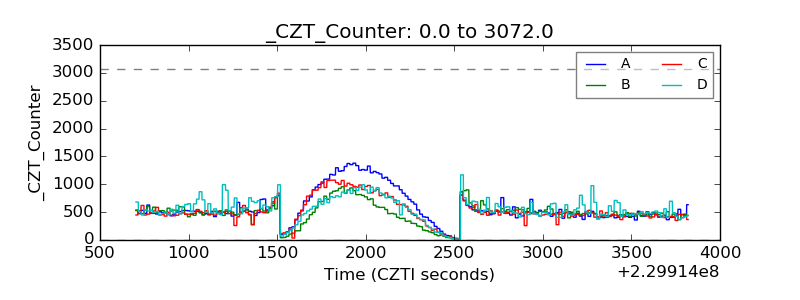 |
| +2.5 Volts monitor |  |
| +5 Volts monitor |  |
| _ROLL_ROT | 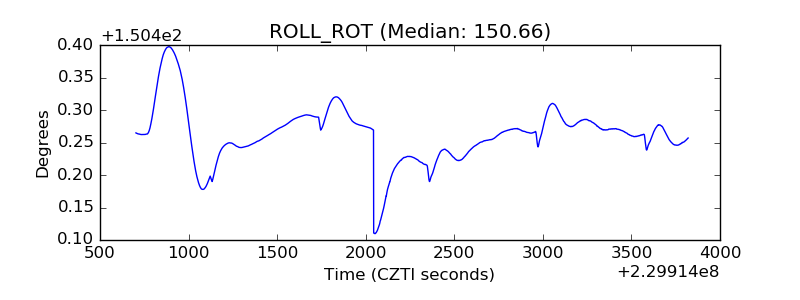 |
| _Roll_DEC | 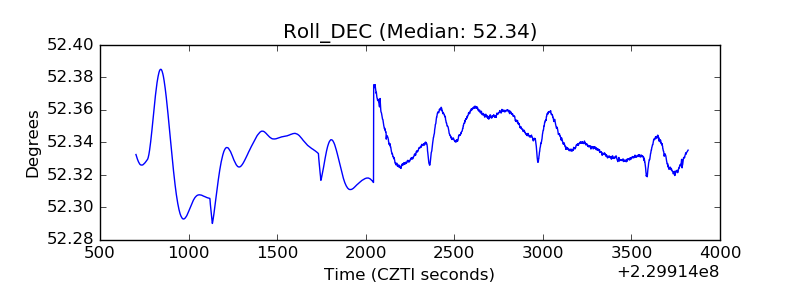 |
| _Roll_RA | 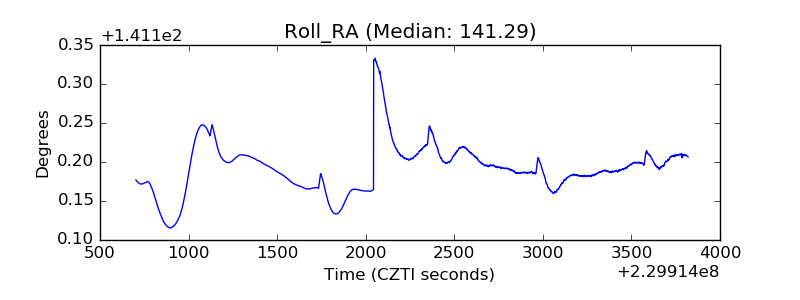 |
| Veto Counter | 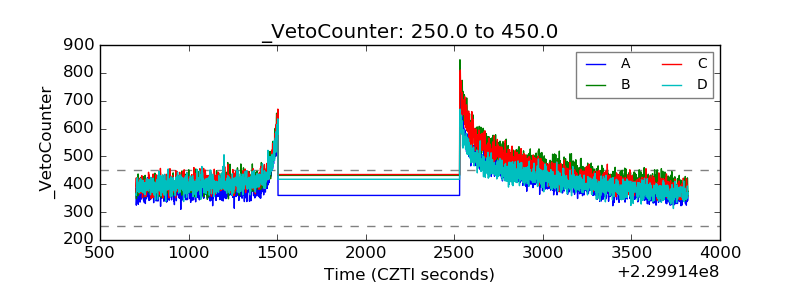 |