| Param | Original file | Final file |
|---|---|---|
| Filename | modeM0/AS1A03_036T01_9000001164_08363cztM0_level2.evt | modeM0/AS1A03_036T01_9000001164_08363cztM0_level2_quad_clean.evt |
| Size (bytes) | 441,227,520 | 69,073,920 |
| Size | 420.8 MB | 65.9 MB |
| Events in quadrant A | 2,977,841 | 417,013 |
| Events in quadrant B | 3,072,892 | 429,668 |
| Events in quadrant C | 2,858,554 | 411,685 |
| Events in quadrant D | 4,022,142 | 390,420 |
| Mode SS | |||
|---|---|---|---|
| Quadrant | BADHDUFLAG | Total packets | Discarded packets |
| A | 0 | 128 | 0 |
| B | 0 | 128 | 0 |
| C | 0 | 128 | 0 |
| D | 0 | 128 | 0 |
| Mode M0 | |||
|---|---|---|---|
| Quadrant | BADHDUFLAG | Total packets | Discarded packets |
| A | 0 | 13023 | 2 |
| B | 0 | 13226 | 1 |
| C | 0 | 12871 | 1 |
| D | 0 | 16281 | 1 |
| Mode M9 | |||
|---|---|---|---|
| Quadrant | BADHDUFLAG | Total packets | Discarded packets |
| A | 0 | 12 | 0 |
| B | 0 | 12 | 0 |
| C | 0 | 12 | 0 |
| D | 0 | 12 | 0 |
| Quadrant | Total seconds | Saturated seconds | Saturation percentage |
|---|---|---|---|
| A | 6343 | 50 | 0.788271% |
| B | 6343 | 37 | 0.583320% |
| C | 6343 | 21 | 0.331074% |
| D | 6343 | 192 | 3.026959% |
Noise dominated data is calculated using 1-second bins in cleaned event files. If a bin has >2000 counts, and if more than 50% of those come from <1% of pixels, then it is considered to be noise-dominated and hence unusable.
| Quadrant | # 1 sec bins | Bins with >0 counts | Bins with >2000 counts | High rate bins dominated by noise | Noise dominated (total time) | Noise dominated (detector-on time) | Marked lightcurve |
|---|---|---|---|---|---|---|---|
| A | 7508 | 6343 | 1 | 1 | 0.01% | 0.02% | 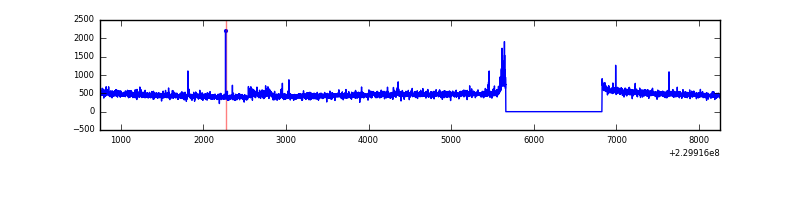 |
| B | 7508 | 6344 | 0 | 0 | 0.00% | 0.00% | 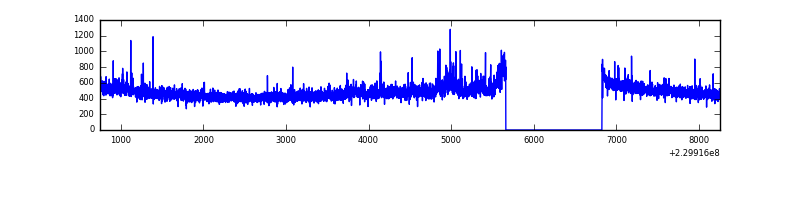 |
| C | 7508 | 6344 | 0 | 0 | 0.00% | 0.00% | 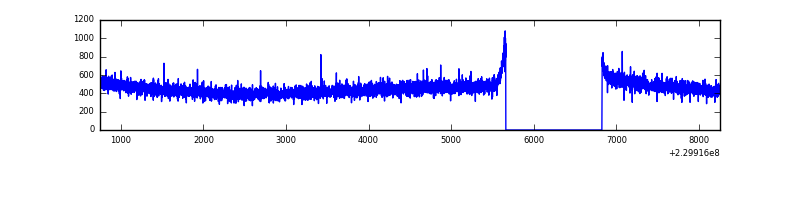 |
| D | 7508 | 6344 | 182 | 182 | 2.42% | 2.87% | 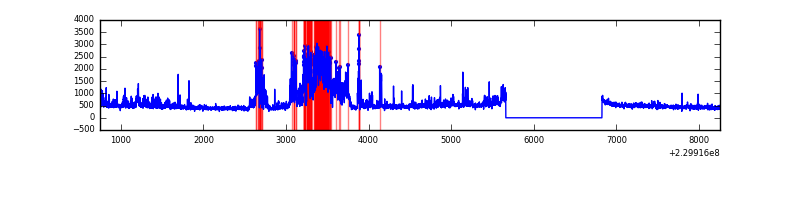 |
Top three noisy pixels from each quadrant. If the there are fewer than three noisy pixels in the level2.evt file, extra rows are filled as -1
| Pixel properties | Quadrant properties | ||||||
|---|---|---|---|---|---|---|---|
| Quadrant | DetID | PixID | Counts | Sigma | Mean | Median | Sigma |
| A | 14 | 111 | 33833 | 215.0 | 754 | 738 | 153.9 |
| A | 15 | 239 | 31572 | 200.32 | 754 | 738 | 153.9 |
| A | 15 | 236 | 7176 | 41.82 | 754 | 738 | 153.9 |
| B | 0 | 214 | 40493 | 274.97 | 764 | 746 | 144.6 |
| B | 4 | 173 | 28746 | 193.7 | 764 | 746 | 144.6 |
| B | 12 | 111 | 15265 | 100.44 | 764 | 746 | 144.6 |
| C | 13 | 61 | 5692 | 29.3 | 732 | 736 | 169.2 |
| C | 3 | 202 | 1884 | 6.78 | 732 | 736 | 169.2 |
| C | 8 | 208 | 1818 | 6.39 | 732 | 736 | 169.2 |
| D | 12 | 233 | 988221 | 5375.9 | 718 | 701 | 183.7 |
| D | 2 | 152 | 198700 | 1077.88 | 718 | 701 | 183.7 |
| D | 5 | 81 | 27245 | 144.5 | 718 | 701 | 183.7 |
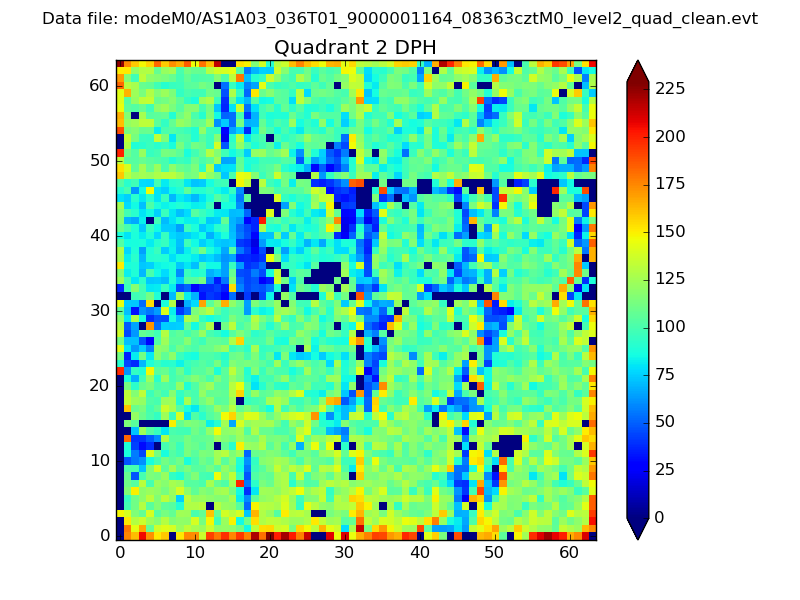
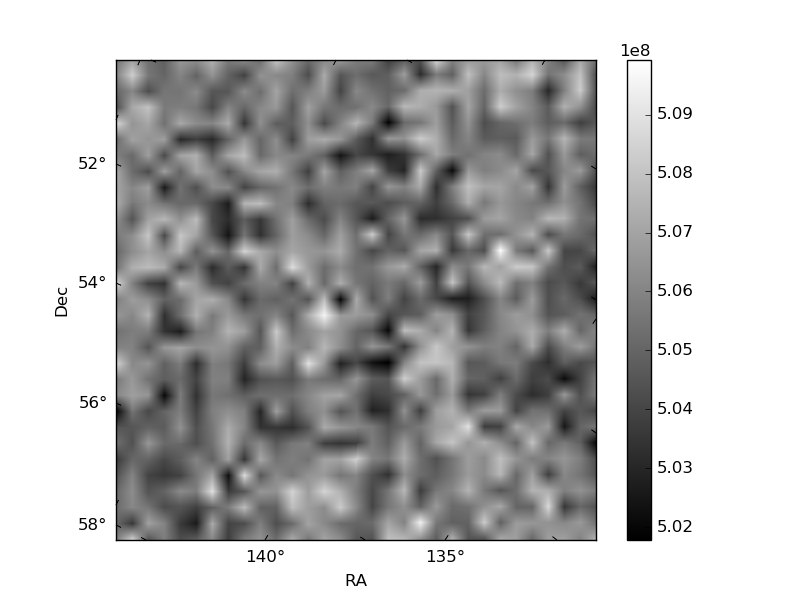
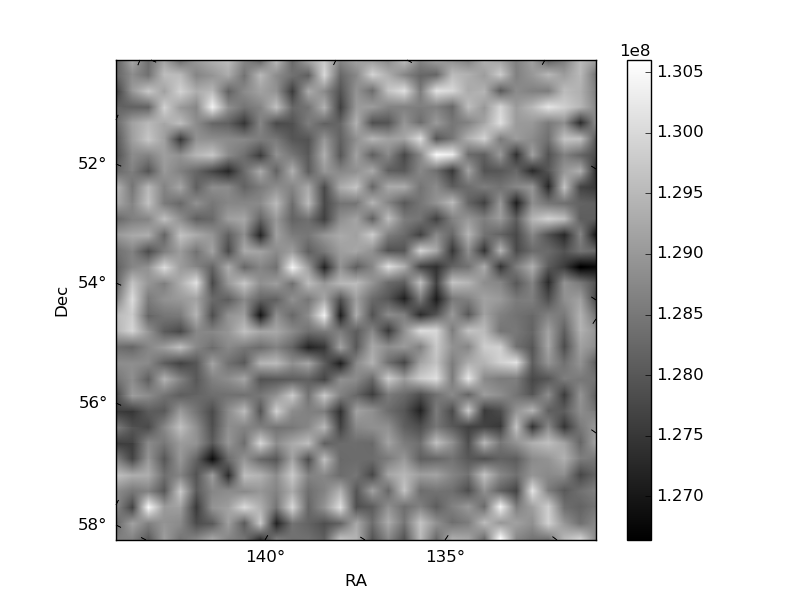
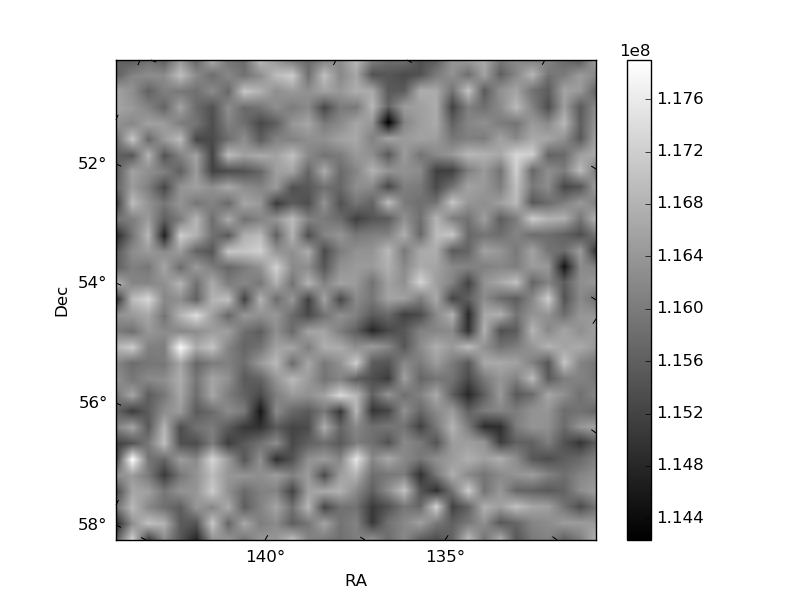
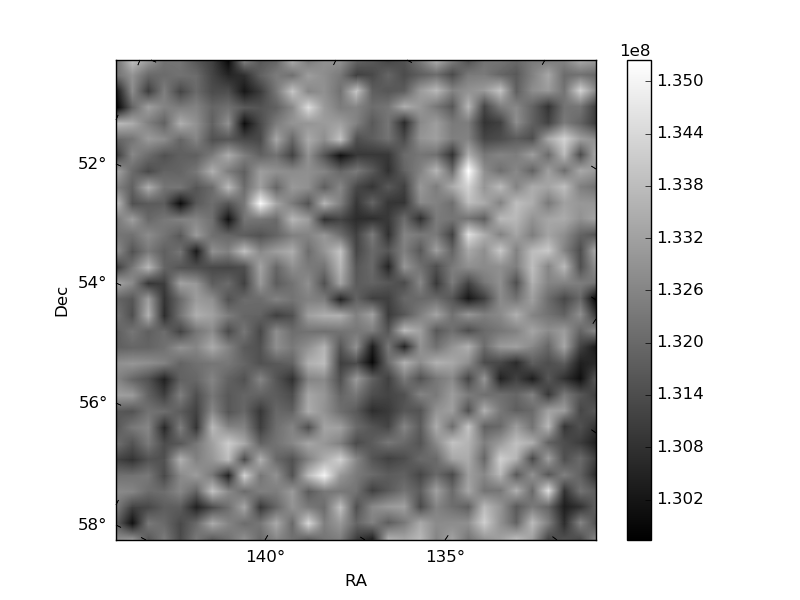
Histogram calculated using DETX and DETY for each event in the final _common_clean file
| Quadrant A | 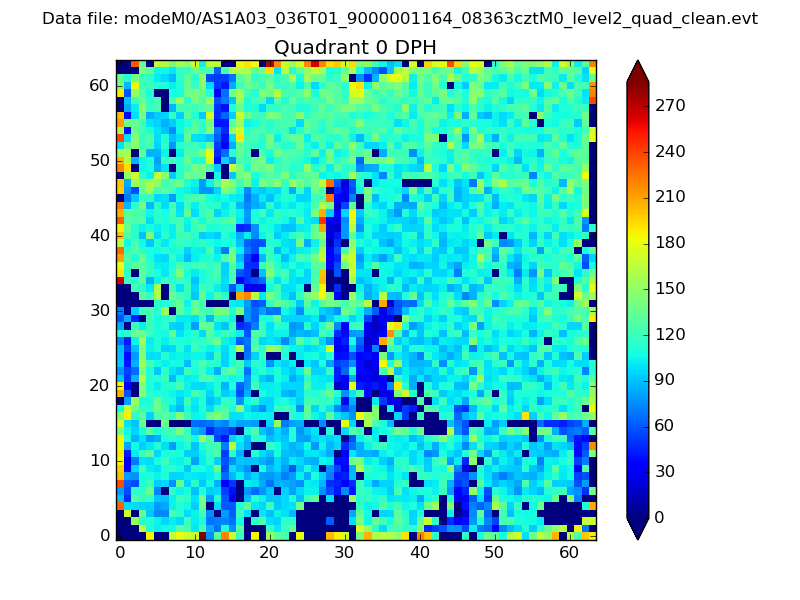 |
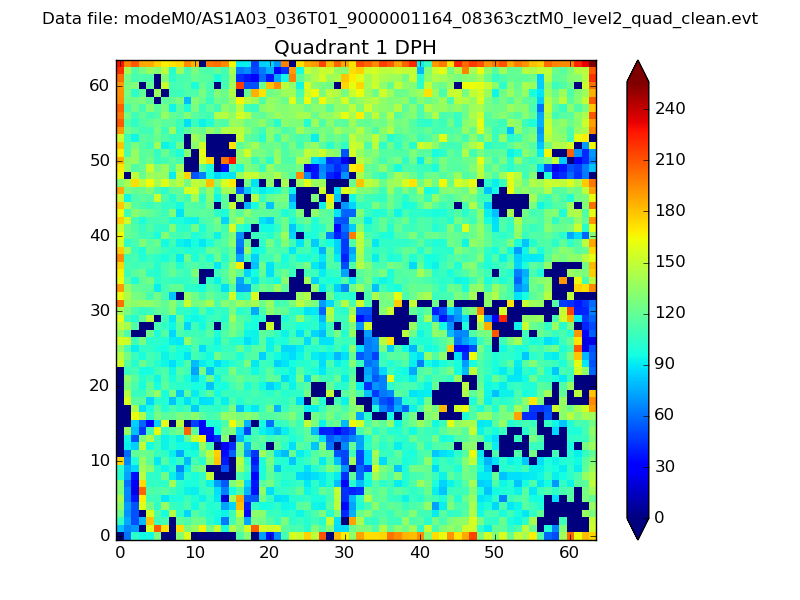 |
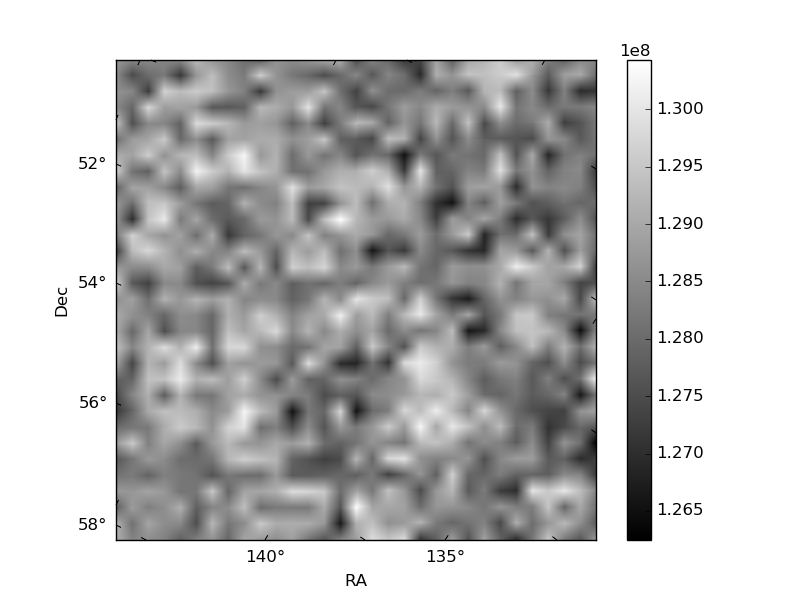
Quadrant B |
|---|---|---|---|
| Quadrant D | 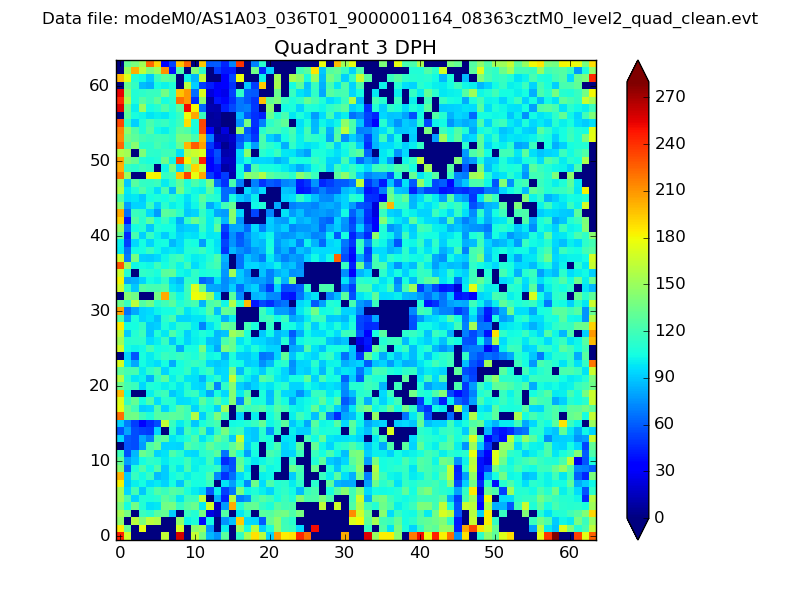 |
 |
Quadrant C |
| Plot type | Count rate plots | Images |
|---|---|---|
| Comparison with Poisson distribution Blue bars denote a histogram of data divided into 1 sec bins. Red curve is a Poisson curve with rate = median count rate of data. |
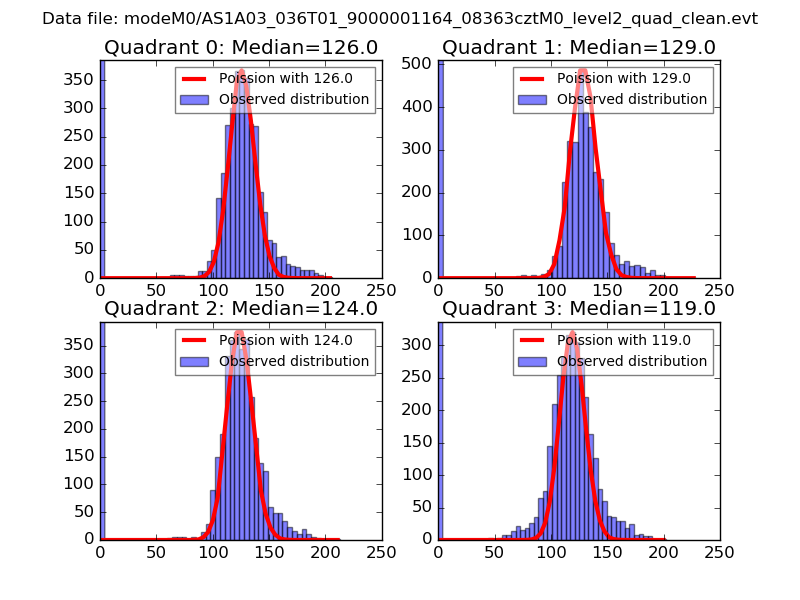 |
 |
| Quadrant-wise count rates Data is divided into 100 sec bins |
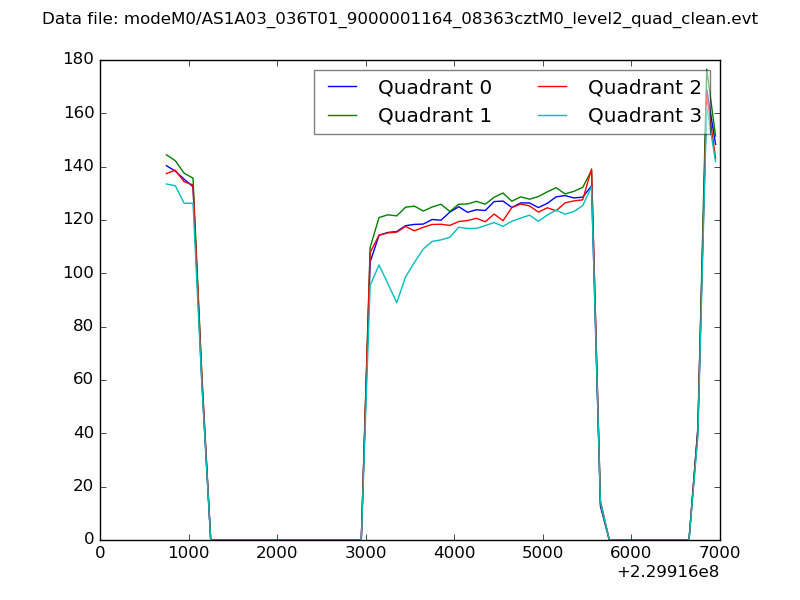 |
|
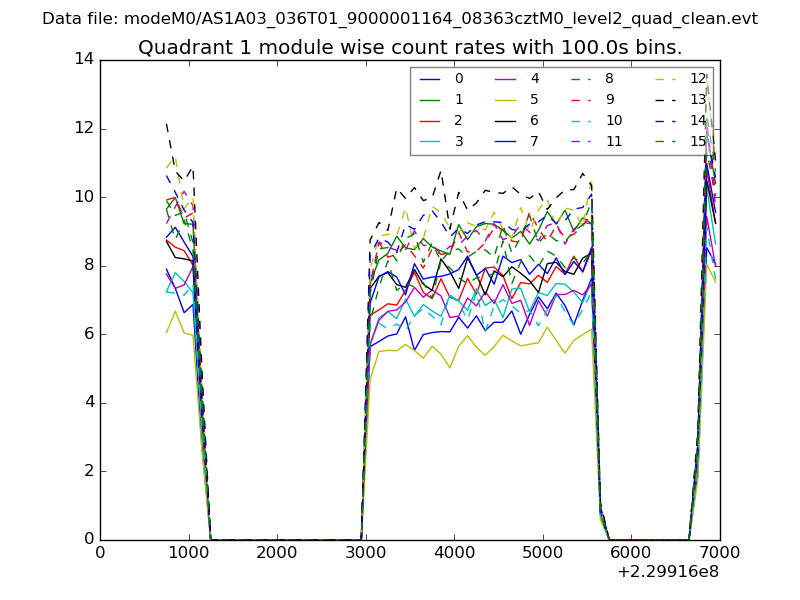
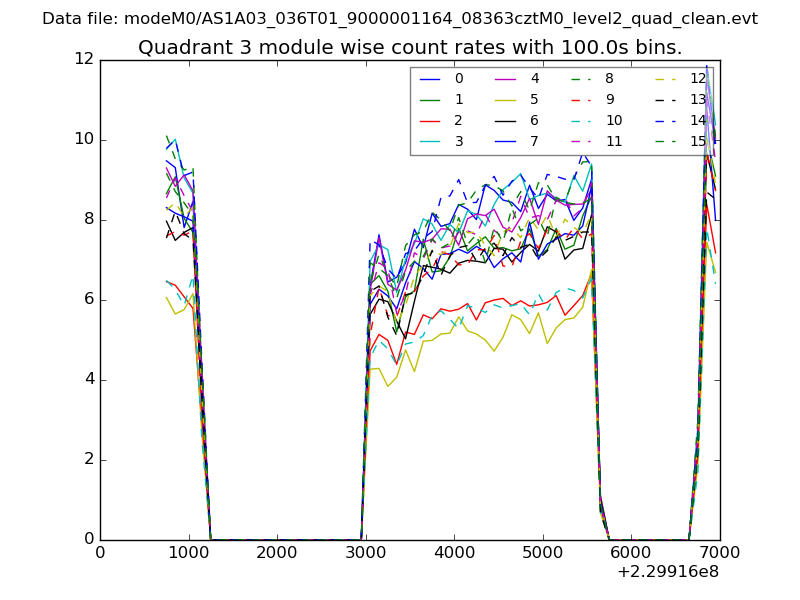
| Module-wise count rates for Quadrant A Data is divided into 100 sec bins |
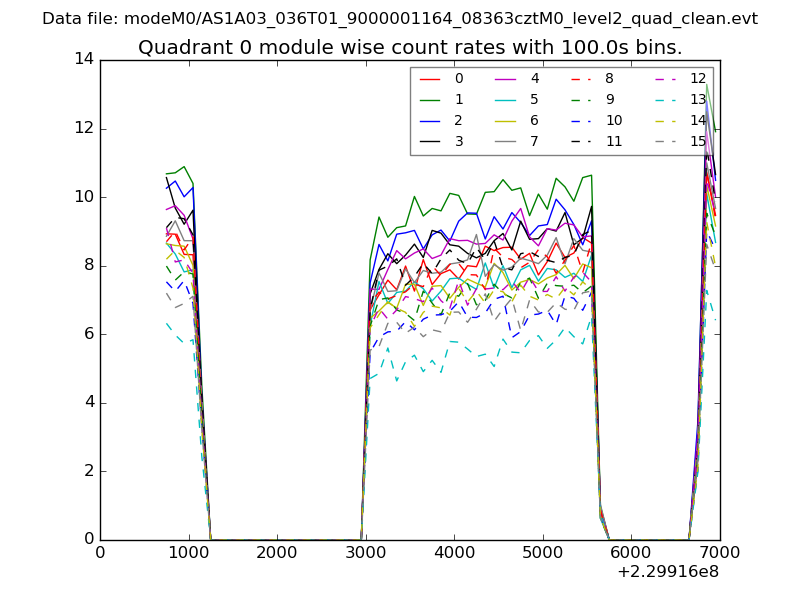 |
 |
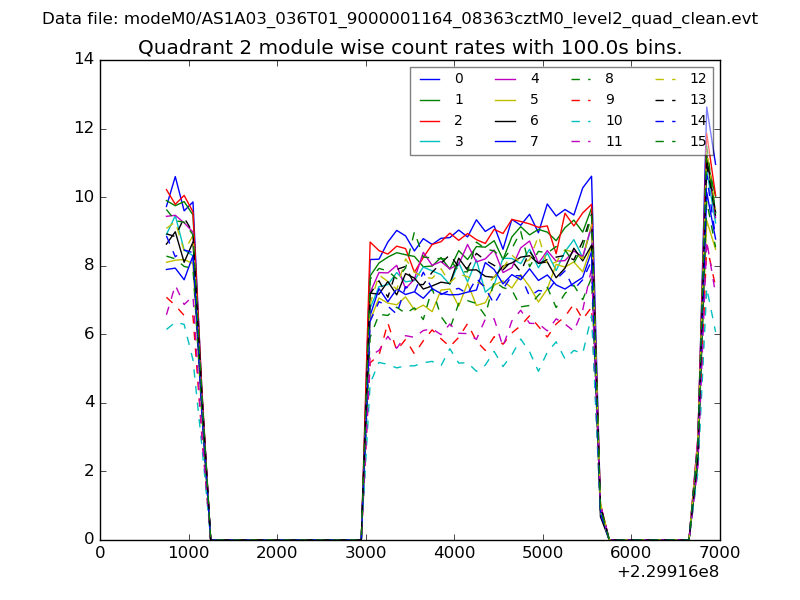
| Module-wise count rates for Quadrant B Data is divided into 100 sec bins |
 |
 |
| Module-wise count rates for Quadrant C Data is divided into 100 sec bins |
 |
 |
| Module-wise count rates for Quadrant D Data is divided into 100 sec bins |
 |
 |
| Parameter | Plot |
|---|---|
| CZT HV Monitor | 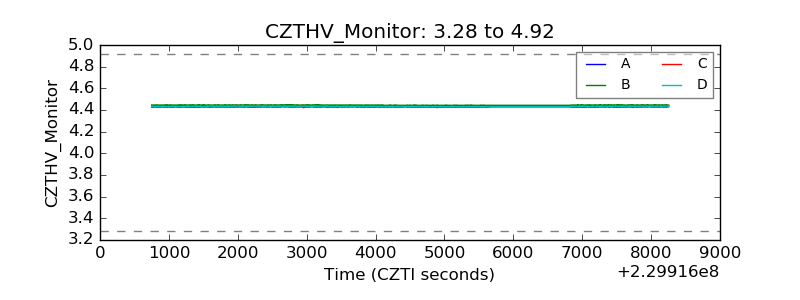 |
| D_VDD | 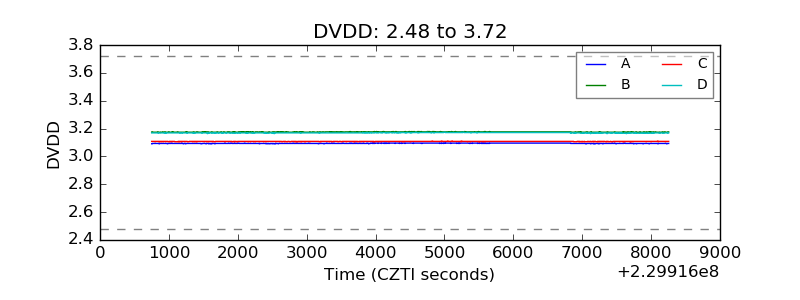 |
| Temperature 1 | 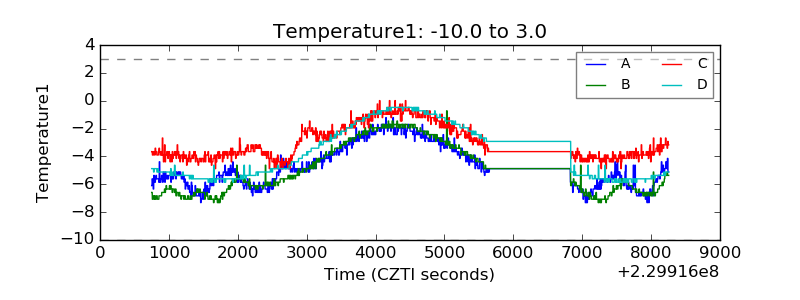 |
| Veto HV Monitor | 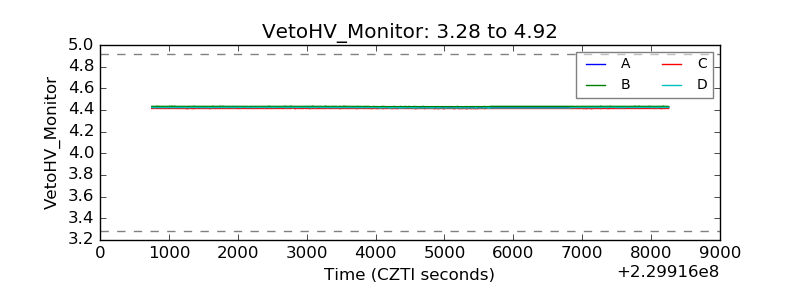 |
| Veto LLD | 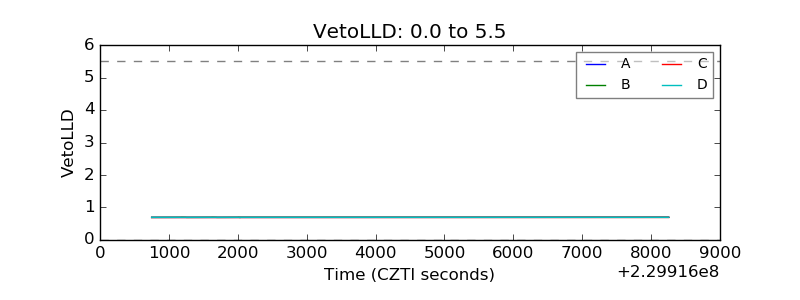 |
| Alpha Counter | 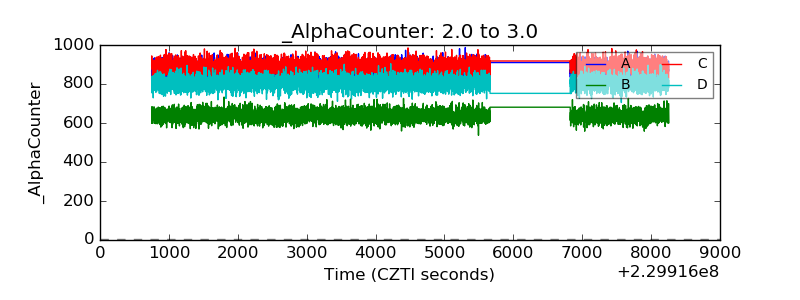 |
| _CPM_Rate | 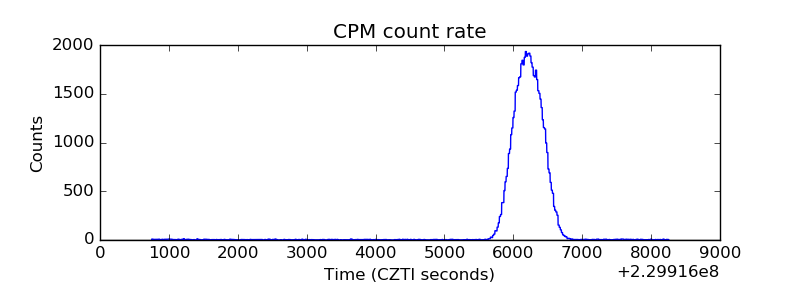 |
| CZT Counter | 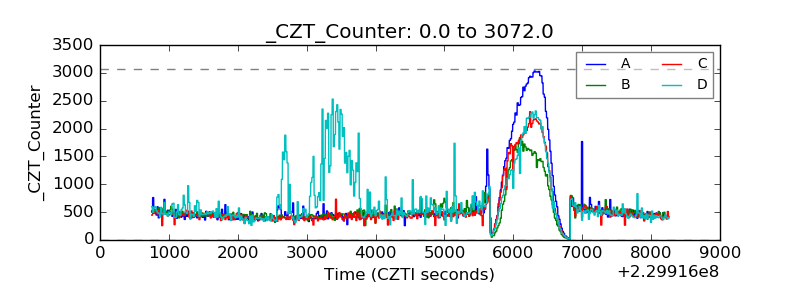 |
| +2.5 Volts monitor |  |
| +5 Volts monitor |  |
| _ROLL_ROT | 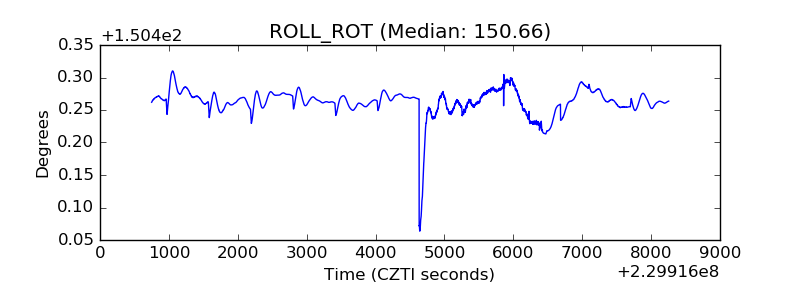 |
| _Roll_DEC | 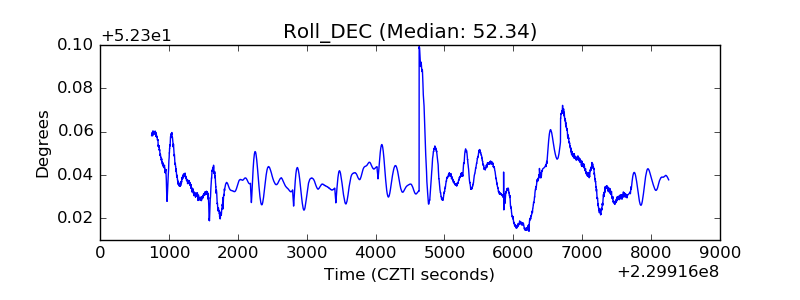 |
| _Roll_RA | 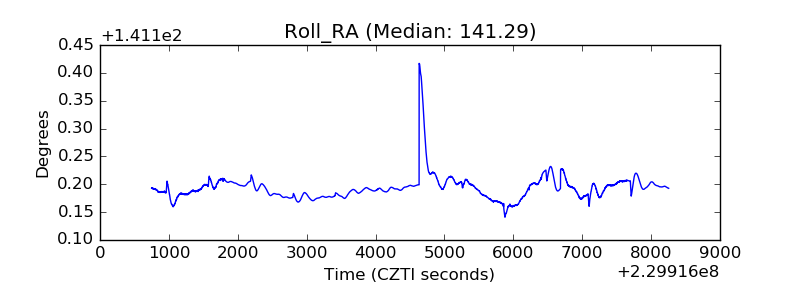 |
| Veto Counter | 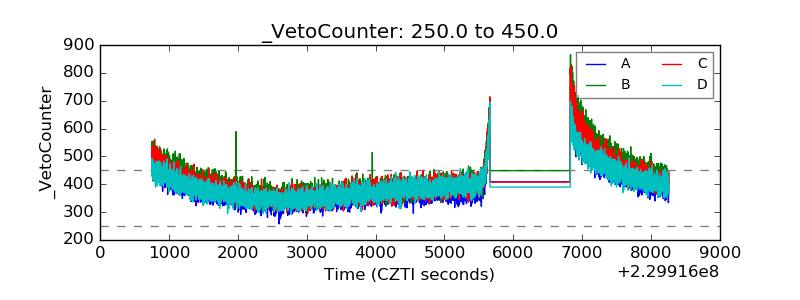 |