| Param | Original file | Final file |
|---|---|---|
| Filename | modeM0/AS1A03_036T01_9000001164_08364cztM0_level2.evt | modeM0/AS1A03_036T01_9000001164_08364cztM0_level2_quad_clean.evt |
| Size (bytes) | 501,984,000 | 66,453,120 |
| Size | 478.7 MB | 63.4 MB |
| Events in quadrant A | 3,585,537 | 402,564 |
| Events in quadrant B | 3,258,615 | 415,868 |
| Events in quadrant C | 3,018,290 | 395,584 |
| Events in quadrant D | 4,902,394 | 348,118 |
| Mode SS | |||
|---|---|---|---|
| Quadrant | BADHDUFLAG | Total packets | Discarded packets |
| A | 0 | 130 | 0 |
| B | 0 | 130 | 0 |
| C | 0 | 130 | 0 |
| D | 0 | 130 | 0 |
| Mode M0 | |||
|---|---|---|---|
| Quadrant | BADHDUFLAG | Total packets | Discarded packets |
| A | 0 | 14710 | 3 |
| B | 0 | 13648 | 2 |
| C | 0 | 13213 | 2 |
| D | 0 | 18758 | 2 |
| Mode M9 | |||
|---|---|---|---|
| Quadrant | BADHDUFLAG | Total packets | Discarded packets |
| A | 0 | 19 | 0 |
| B | 0 | 19 | 0 |
| C | 0 | 19 | 0 |
| D | 0 | 20 | 0 |
| Quadrant | Total seconds | Saturated seconds | Saturation percentage |
|---|---|---|---|
| A | 6448 | 268 | 4.156328% |
| B | 6448 | 39 | 0.604839% |
| C | 6448 | 6 | 0.093052% |
| D | 6448 | 617 | 9.568859% |
Noise dominated data is calculated using 1-second bins in cleaned event files. If a bin has >2000 counts, and if more than 50% of those come from <1% of pixels, then it is considered to be noise-dominated and hence unusable.
| Quadrant | # 1 sec bins | Bins with >0 counts | Bins with >2000 counts | High rate bins dominated by noise | Noise dominated (total time) | Noise dominated (detector-on time) | Marked lightcurve |
|---|---|---|---|---|---|---|---|
| A | 7723 | 6449 | 141 | 141 | 1.83% | 2.19% | 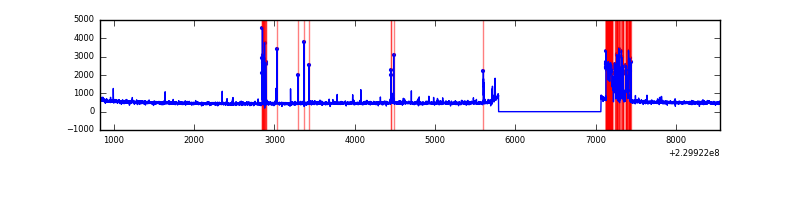 |
| B | 7723 | 6449 | 2 | 2 | 0.03% | 0.03% | 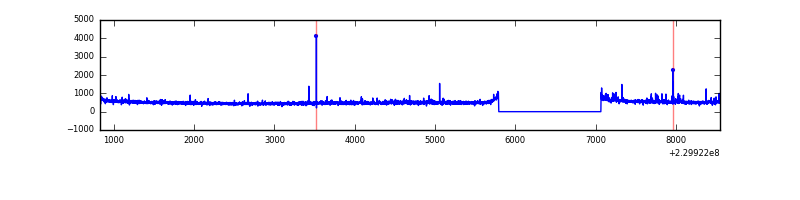 |
| C | 7723 | 6449 | 0 | 0 | 0.00% | 0.00% | 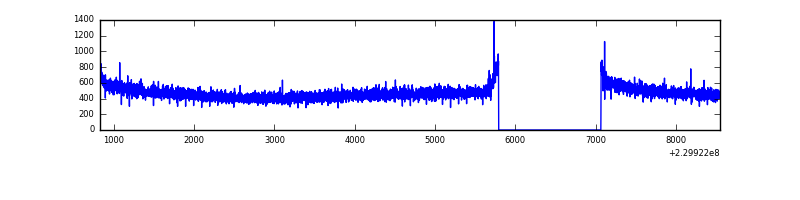 |
| D | 7723 | 6449 | 532 | 532 | 6.89% | 8.25% | 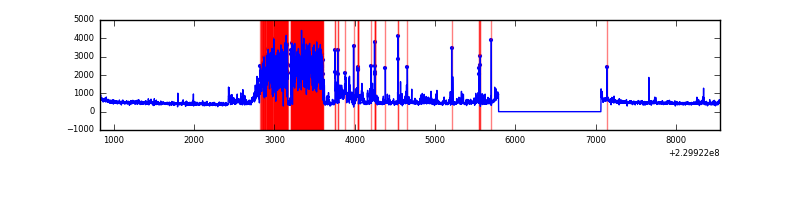 |
Top three noisy pixels from each quadrant. If the there are fewer than three noisy pixels in the level2.evt file, extra rows are filled as -1
| Pixel properties | Quadrant properties | ||||||
|---|---|---|---|---|---|---|---|
| Quadrant | DetID | PixID | Counts | Sigma | Mean | Median | Sigma |
| A | 14 | 111 | 433615 | 2736.05 | 784 | 768 | 158.2 |
| A | 15 | 239 | 117715 | 739.23 | 784 | 768 | 158.2 |
| A | 15 | 236 | 9043 | 52.31 | 784 | 768 | 158.2 |
| B | 4 | 81 | 38228 | 246.13 | 813 | 794 | 152.1 |
| B | 0 | 214 | 25292 | 161.07 | 813 | 794 | 152.1 |
| B | 4 | 173 | 17998 | 113.12 | 813 | 794 | 152.1 |
| C | 13 | 61 | 6045 | 29.58 | 772 | 777 | 178.1 |
| C | 12 | 2 | 4522 | 21.03 | 772 | 777 | 178.1 |
| C | 8 | 208 | 1968 | 6.69 | 772 | 777 | 178.1 |
| D | 12 | 233 | 1719871 | 9086.76 | 742 | 723 | 189.2 |
| D | 2 | 152 | 151526 | 797.08 | 742 | 723 | 189.2 |
| D | 7 | 71 | 73759 | 386.04 | 742 | 723 | 189.2 |
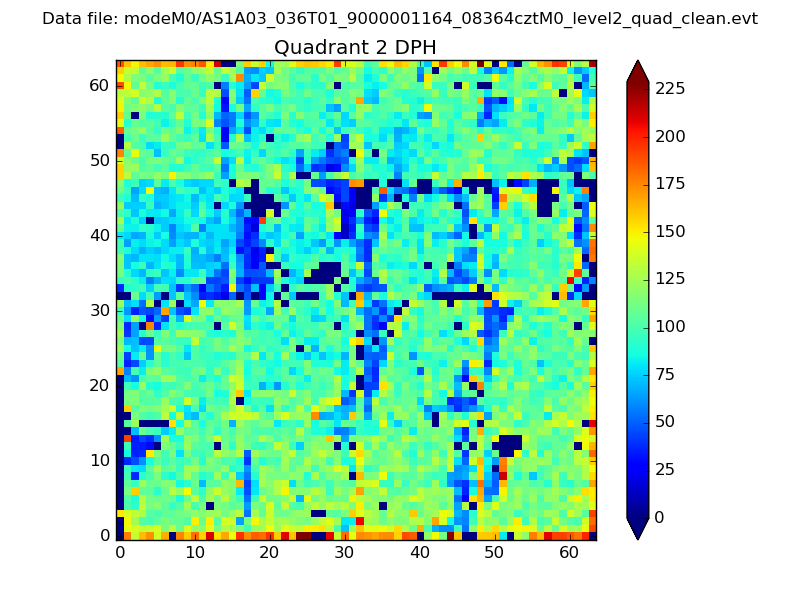
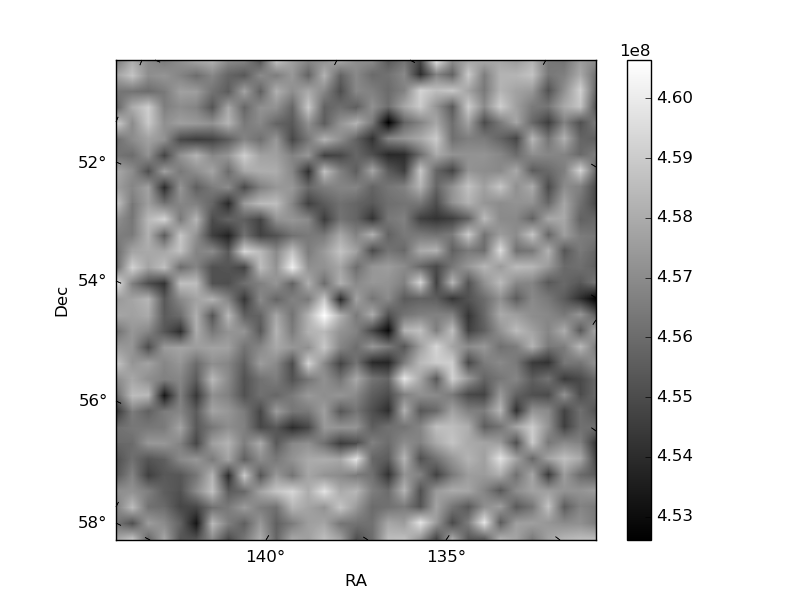
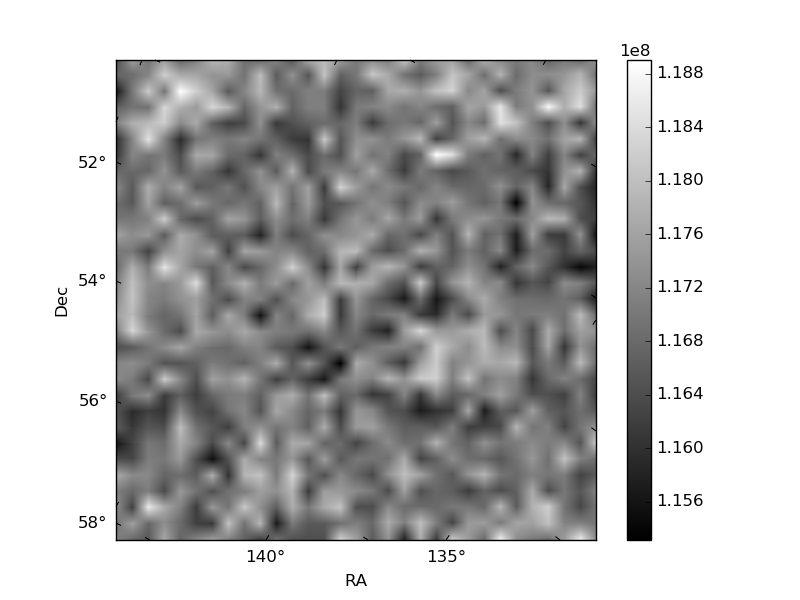
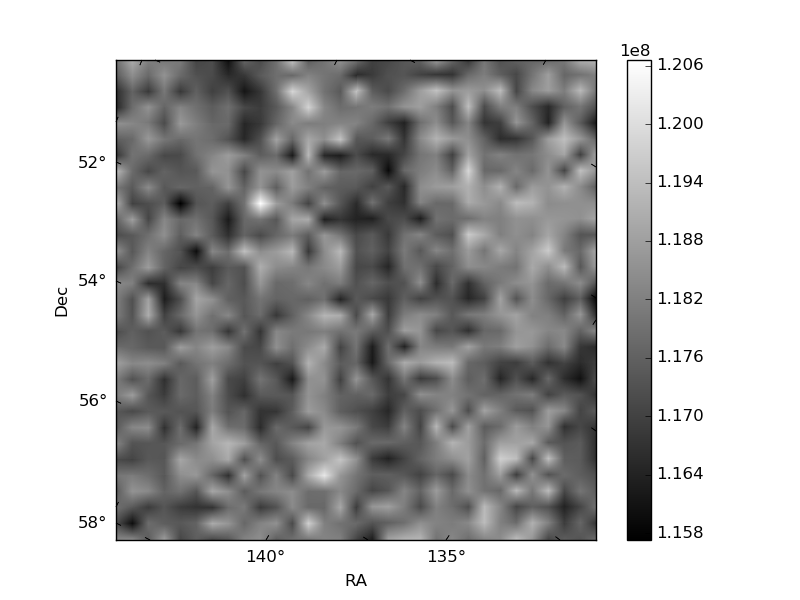
Histogram calculated using DETX and DETY for each event in the final _common_clean file
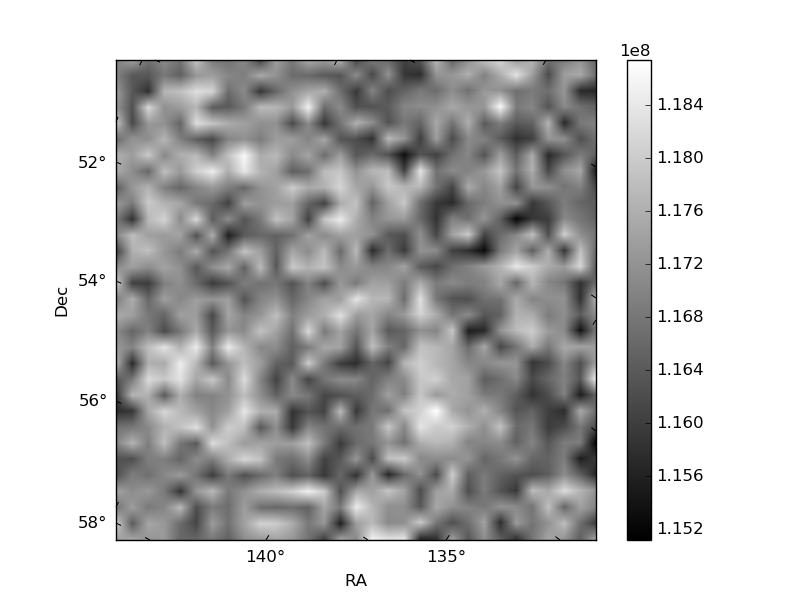
| Quadrant A | 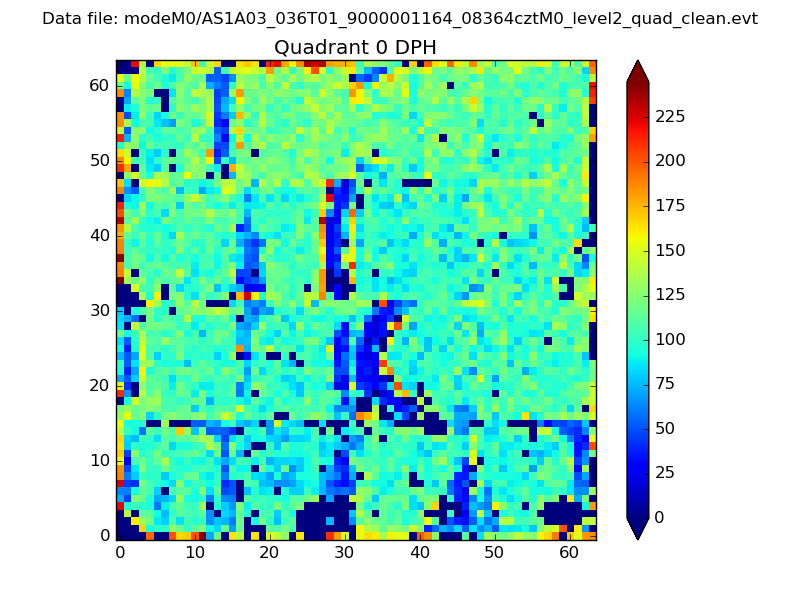 |
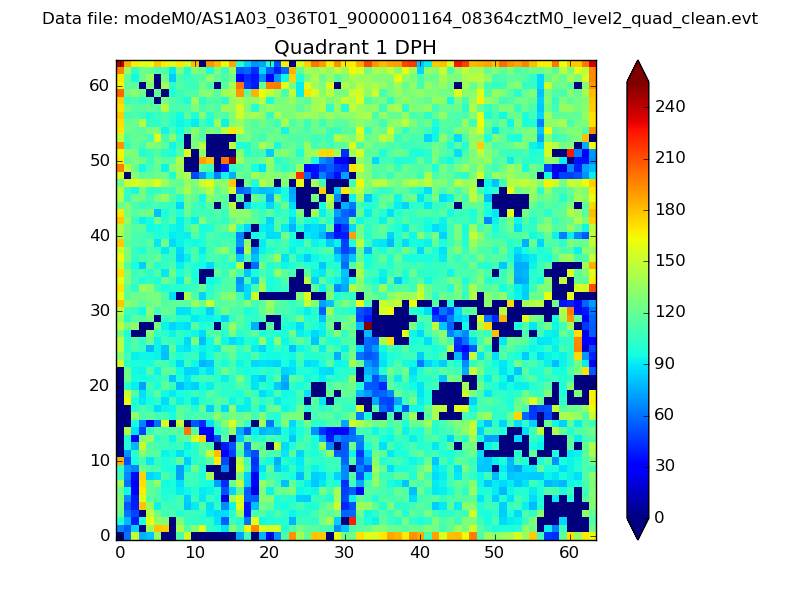 |
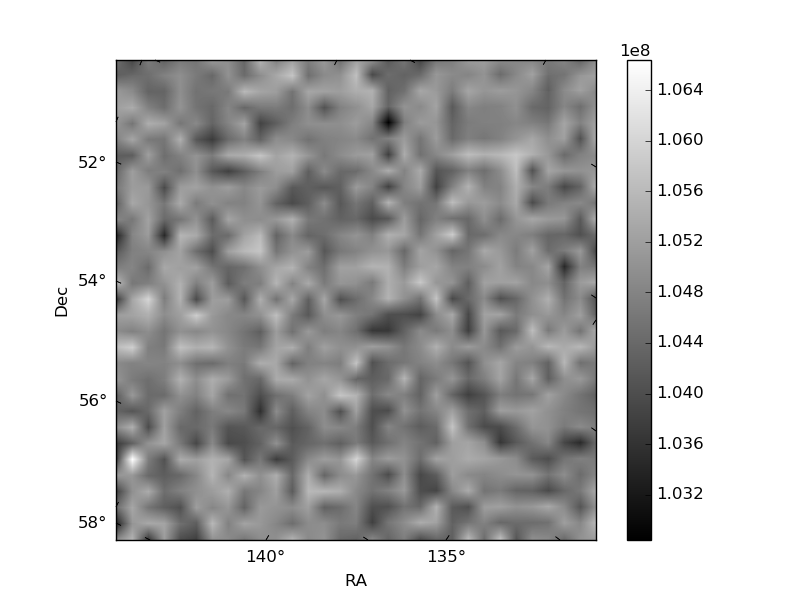
Quadrant B |
|---|---|---|---|
| Quadrant D | 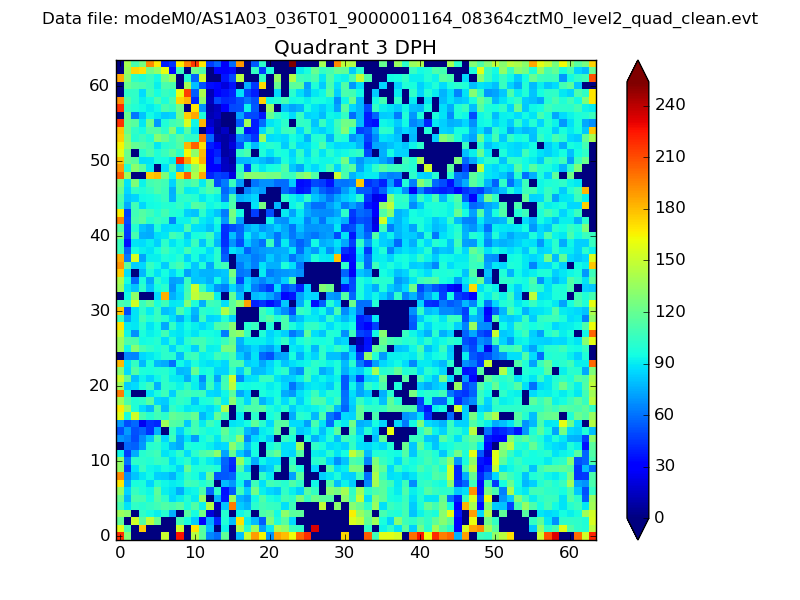 |
 |
Quadrant C |
| Plot type | Count rate plots | Images |
|---|---|---|
| Comparison with Poisson distribution Blue bars denote a histogram of data divided into 1 sec bins. Red curve is a Poisson curve with rate = median count rate of data. |
 |
 |
| Quadrant-wise count rates Data is divided into 100 sec bins |
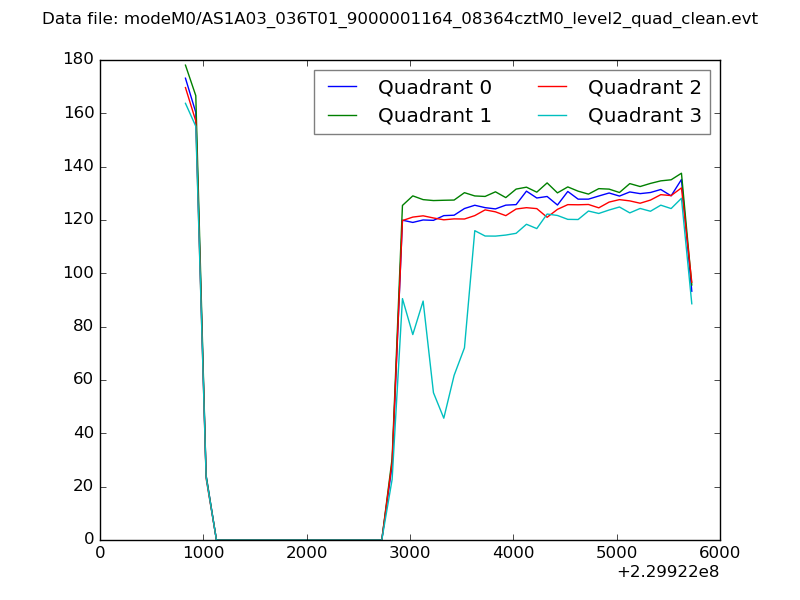 |
|
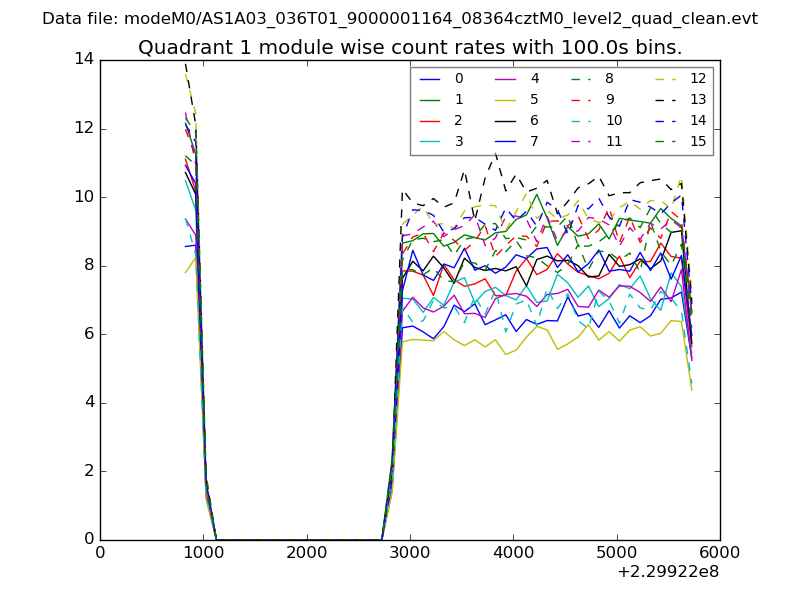
| Module-wise count rates for Quadrant A Data is divided into 100 sec bins |
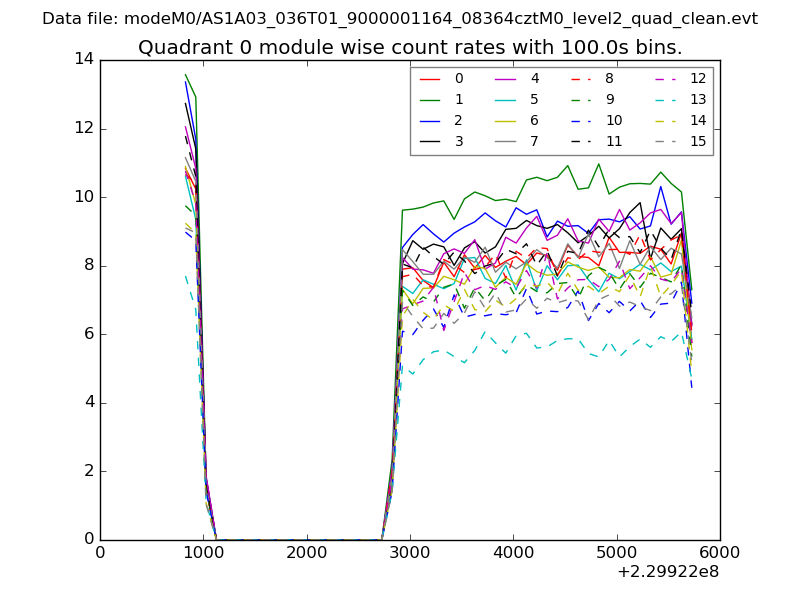 |
 |
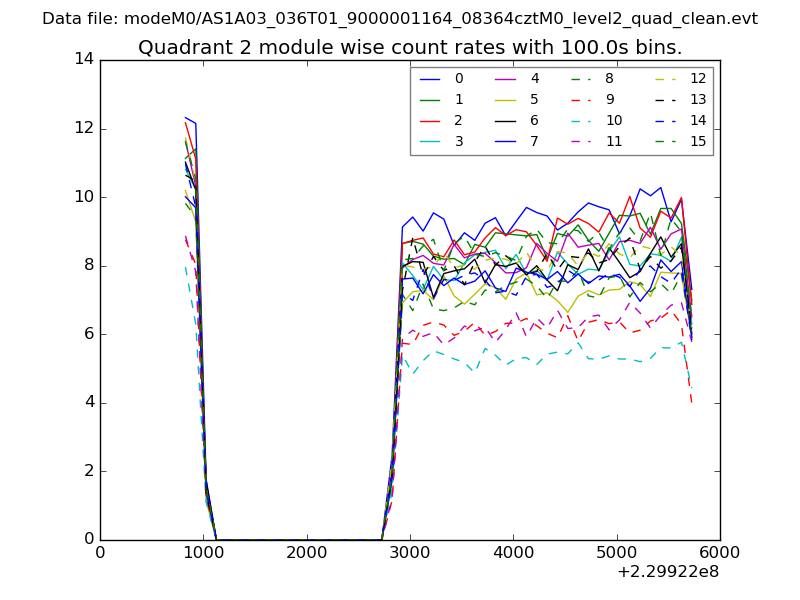
| Module-wise count rates for Quadrant B Data is divided into 100 sec bins |
 |
 |
| Module-wise count rates for Quadrant C Data is divided into 100 sec bins |
 |
 |
| Module-wise count rates for Quadrant D Data is divided into 100 sec bins |
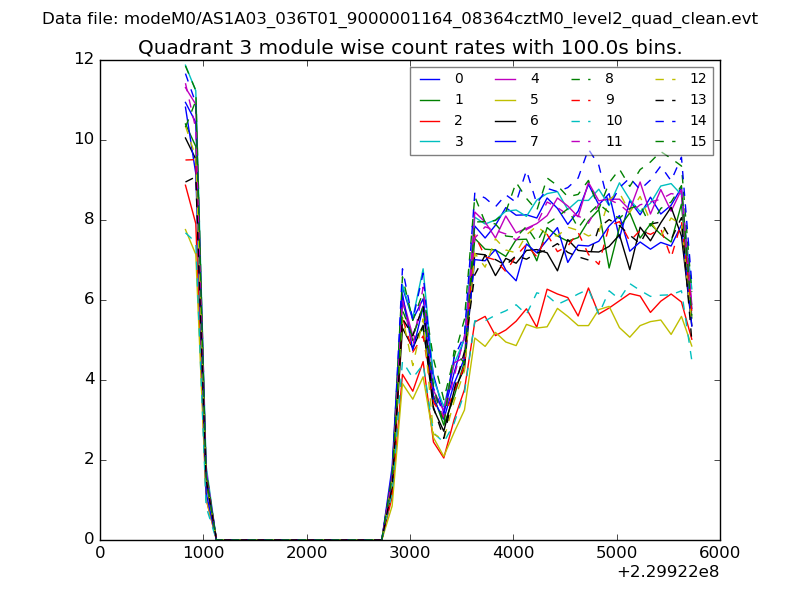 |
 |
| Parameter | Plot |
|---|---|
| CZT HV Monitor | 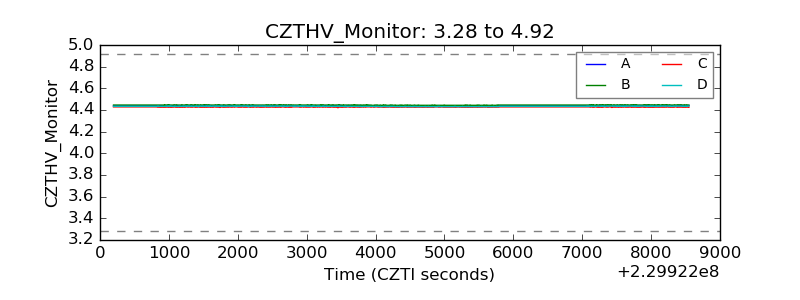 |
| D_VDD | 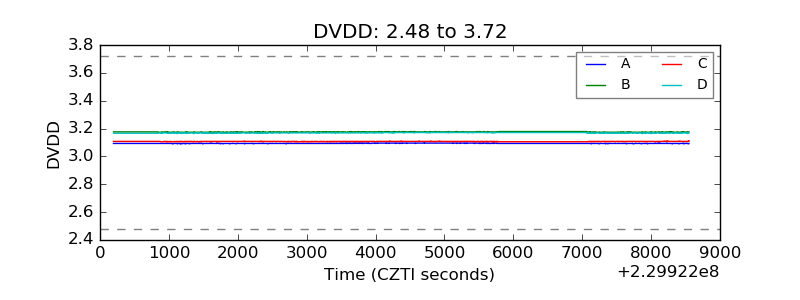 |
| Temperature 1 | 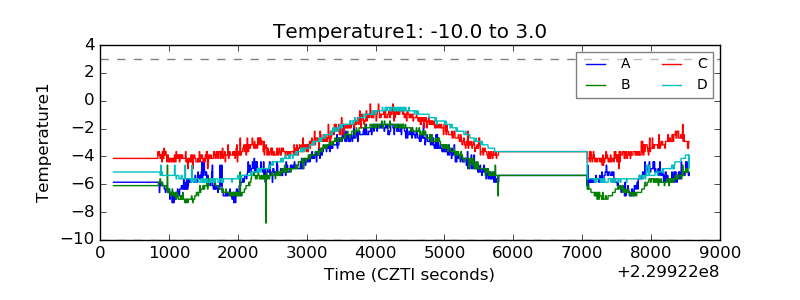 |
| Veto HV Monitor | 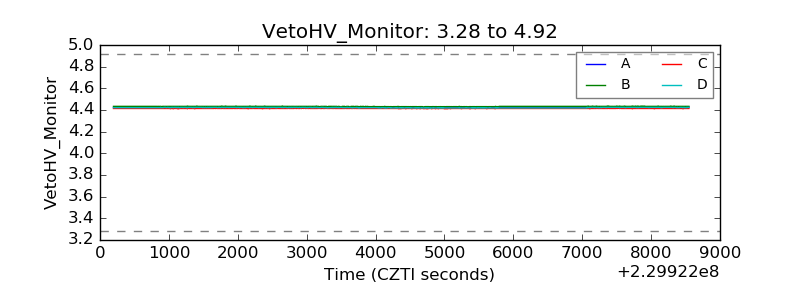 |
| Veto LLD | 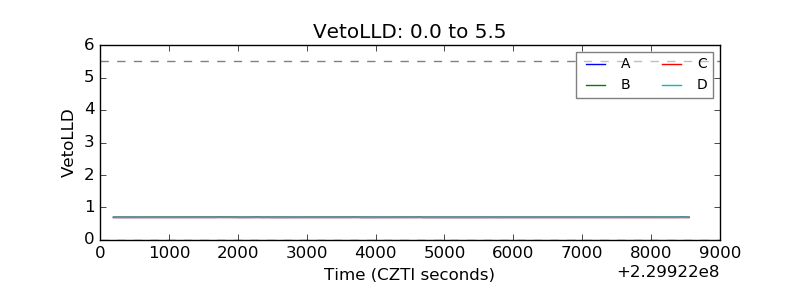 |
| Alpha Counter | 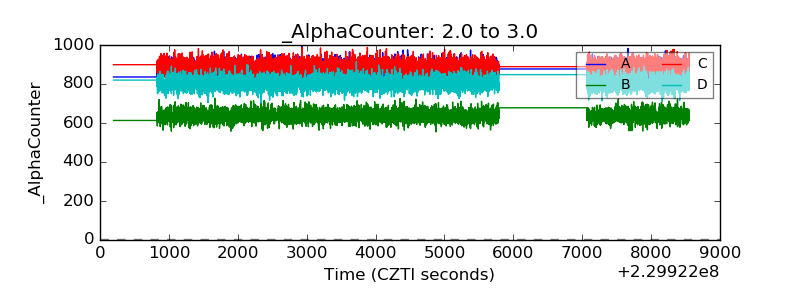 |
| _CPM_Rate | 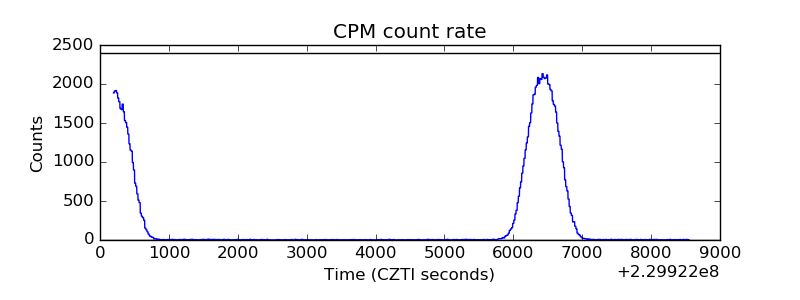 |
| CZT Counter | 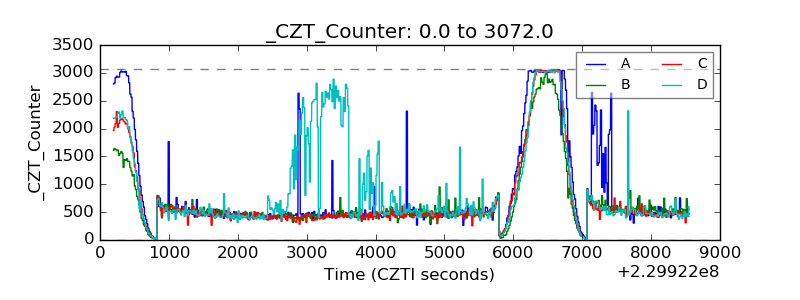 |
| +2.5 Volts monitor | 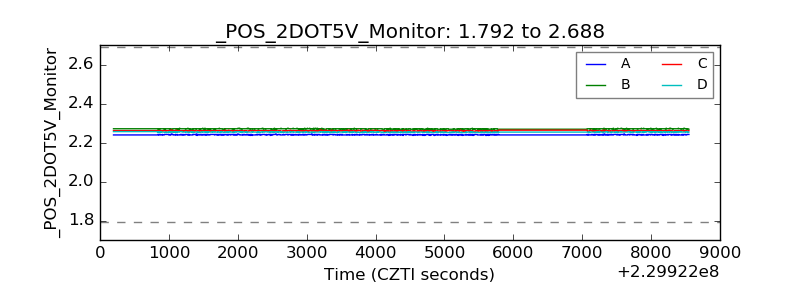 |
| +5 Volts monitor |  |
| _ROLL_ROT | 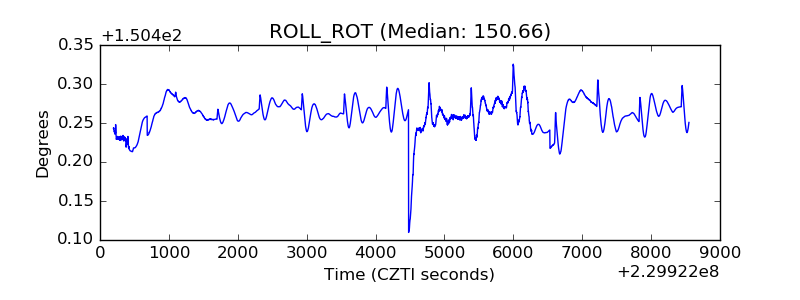 |
| _Roll_DEC | 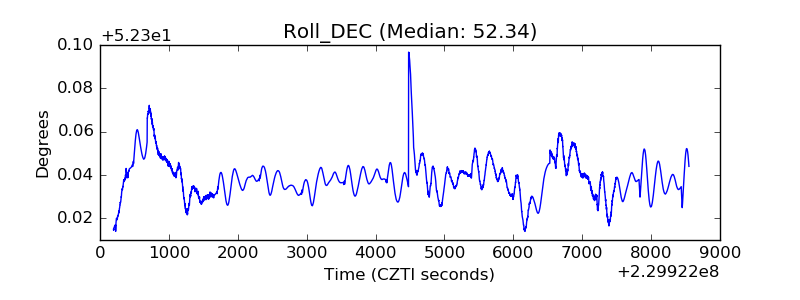 |
| _Roll_RA | 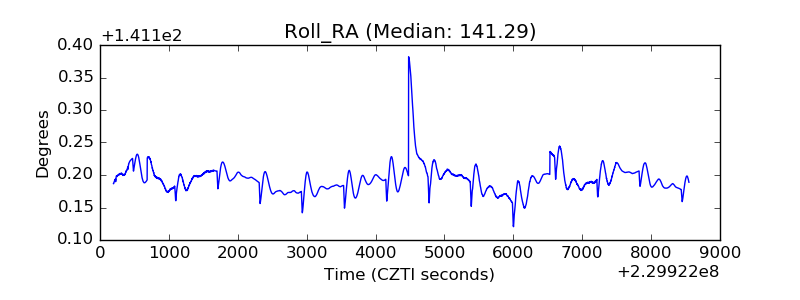 |
| Veto Counter | 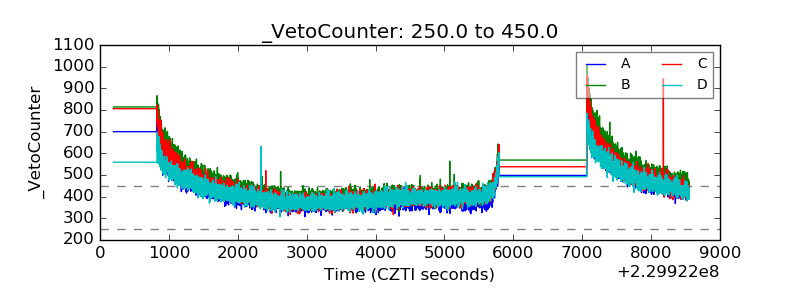 |