| Param | Original file | Final file |
|---|---|---|
| Filename | modeM0/AS1A03_036T01_9000001164_08365cztM0_level2.evt | modeM0/AS1A03_036T01_9000001164_08365cztM0_level2_quad_clean.evt |
| Size (bytes) | 499,584,960 | 70,130,880 |
| Size | 476.4 MB | 66.9 MB |
| Events in quadrant A | 3,802,761 | 423,811 |
| Events in quadrant B | 3,363,486 | 443,157 |
| Events in quadrant C | 3,020,979 | 422,421 |
| Events in quadrant D | 4,519,210 | 398,358 |
| Mode SS | |||
|---|---|---|---|
| Quadrant | BADHDUFLAG | Total packets | Discarded packets |
| A | 0 | 128 | 0 |
| B | 0 | 128 | 0 |
| C | 0 | 128 | 0 |
| D | 0 | 128 | 0 |
| Mode M0 | |||
|---|---|---|---|
| Quadrant | BADHDUFLAG | Total packets | Discarded packets |
| A | 0 | 15140 | 3 |
| B | 0 | 13734 | 2 |
| C | 0 | 12923 | 2 |
| D | 0 | 17493 | 2 |
| Mode M9 | |||
|---|---|---|---|
| Quadrant | BADHDUFLAG | Total packets | Discarded packets |
| A | 0 | 15 | 0 |
| B | 0 | 15 | 0 |
| C | 0 | 15 | 0 |
| D | 0 | 16 | 0 |
| Quadrant | Total seconds | Saturated seconds | Saturation percentage |
|---|---|---|---|
| A | 6234 | 396 | 6.352262% |
| B | 6234 | 99 | 1.588065% |
| C | 6234 | 48 | 0.769971% |
| D | 6234 | 336 | 5.389798% |
Noise dominated data is calculated using 1-second bins in cleaned event files. If a bin has >2000 counts, and if more than 50% of those come from <1% of pixels, then it is considered to be noise-dominated and hence unusable.
| Quadrant | # 1 sec bins | Bins with >0 counts | Bins with >2000 counts | High rate bins dominated by noise | Noise dominated (total time) | Noise dominated (detector-on time) | Marked lightcurve |
|---|---|---|---|---|---|---|---|
| A | 7534 | 6235 | 183 | 183 | 2.43% | 2.94% | 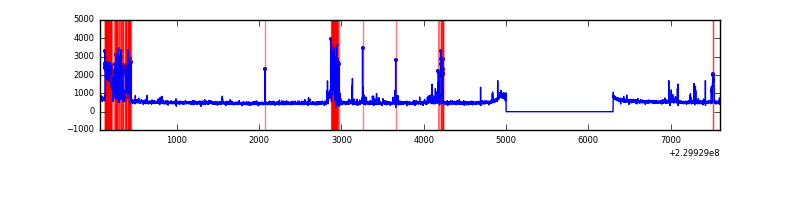 |
| B | 7534 | 6235 | 8 | 8 | 0.11% | 0.13% | 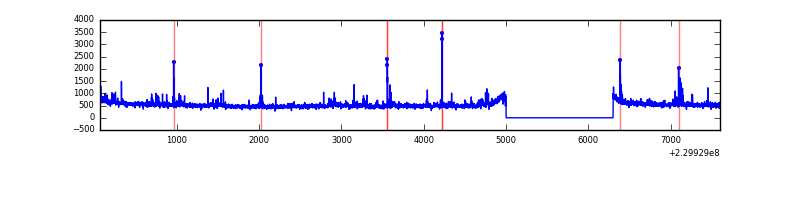 |
| C | 7534 | 6235 | 0 | 0 | 0.00% | 0.00% | 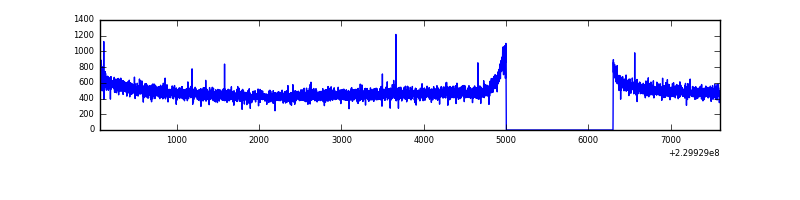 |
| D | 7534 | 6235 | 274 | 274 | 3.64% | 4.39% | 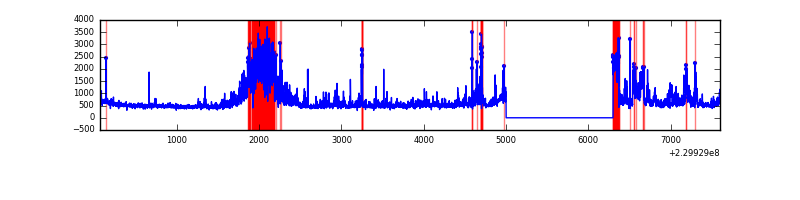 |
Top three noisy pixels from each quadrant. If the there are fewer than three noisy pixels in the level2.evt file, extra rows are filled as -1
| Pixel properties | Quadrant properties | ||||||
|---|---|---|---|---|---|---|---|
| Quadrant | DetID | PixID | Counts | Sigma | Mean | Median | Sigma |
| A | 14 | 111 | 636081 | 4044.72 | 785 | 767 | 157.1 |
| A | 15 | 239 | 127662 | 807.87 | 785 | 767 | 157.1 |
| A | 13 | 251 | 9791 | 57.45 | 785 | 767 | 157.1 |
| B | 4 | 81 | 52178 | 338.96 | 814 | 796 | 151.6 |
| B | 0 | 214 | 45044 | 291.9 | 814 | 796 | 151.6 |
| B | 4 | 173 | 32318 | 207.95 | 814 | 796 | 151.6 |
| C | 13 | 61 | 6065 | 29.66 | 774 | 778 | 178.3 |
| C | 1 | 16 | 2963 | 12.26 | 774 | 778 | 178.3 |
| C | 3 | 202 | 1890 | 6.24 | 774 | 778 | 178.3 |
| D | 12 | 233 | 1126376 | 5675.02 | 757 | 738 | 198.3 |
| D | 2 | 152 | 403960 | 2032.88 | 757 | 738 | 198.3 |
| D | 7 | 71 | 65985 | 328.95 | 757 | 738 | 198.3 |
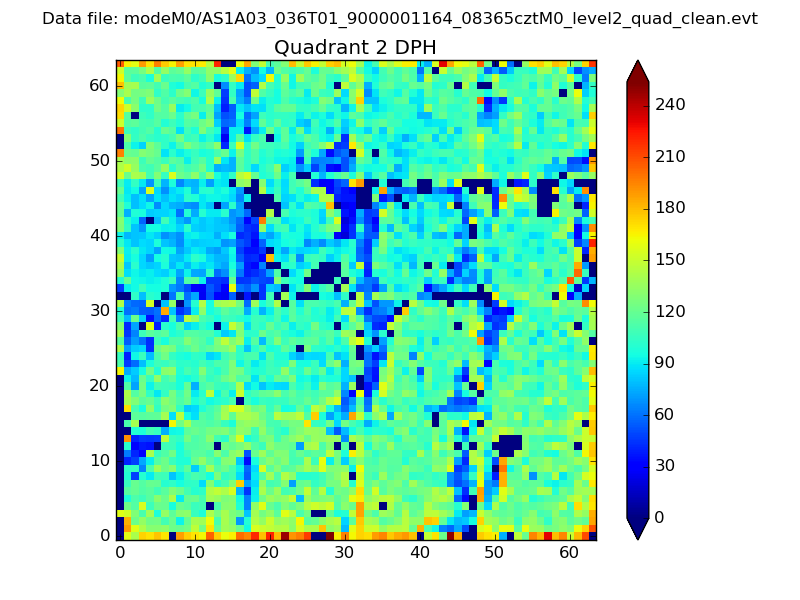
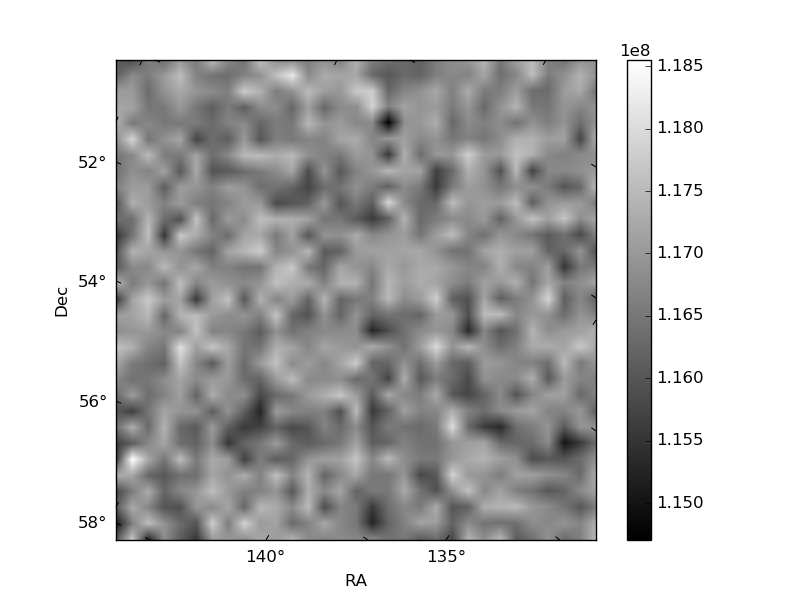
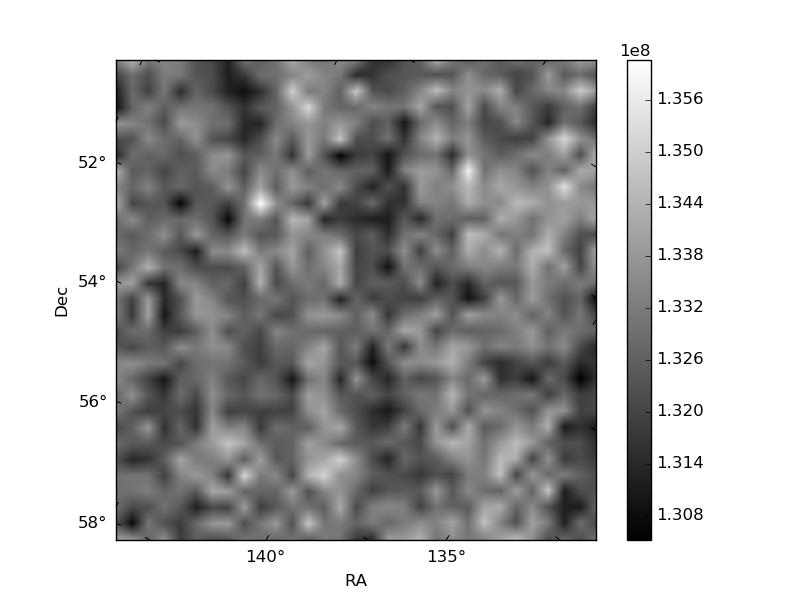
Histogram calculated using DETX and DETY for each event in the final _common_clean file
| Quadrant A | 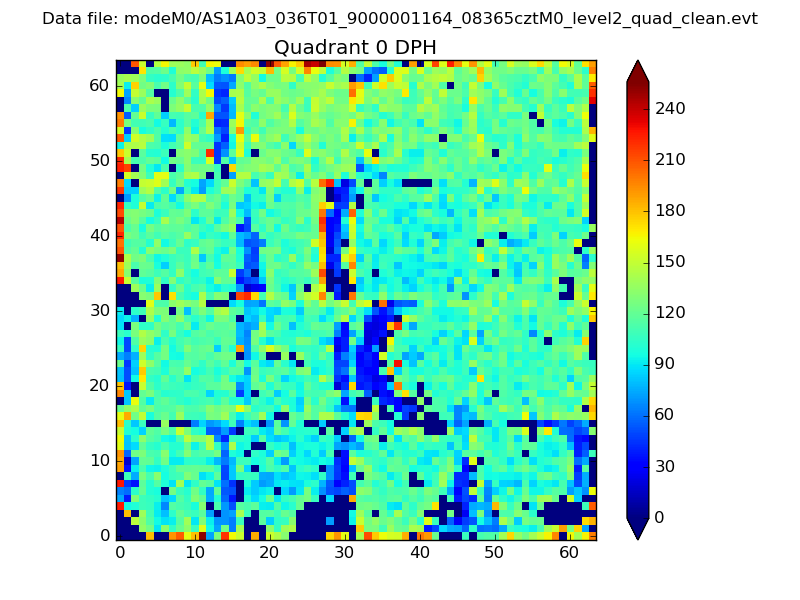 |
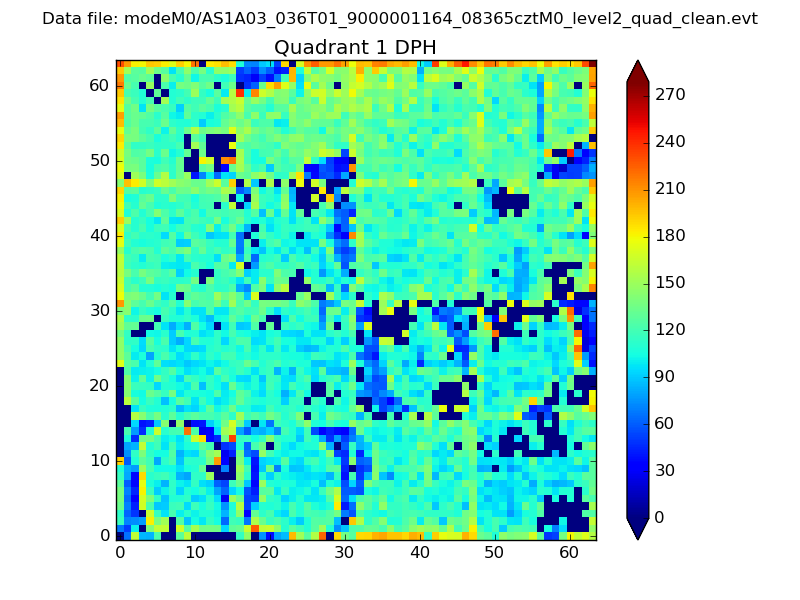 |
Quadrant B |
|---|---|---|---|
| Quadrant D | 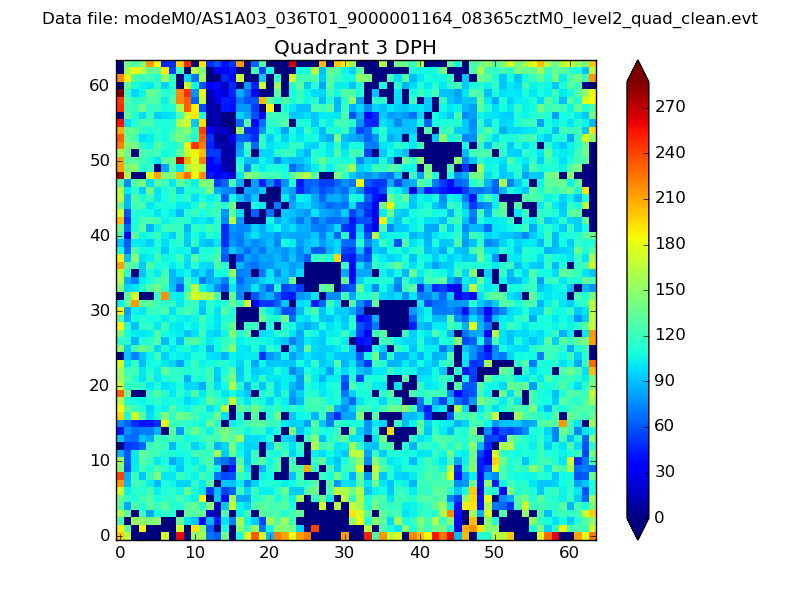 |
 |
Quadrant C |
| Plot type | Count rate plots | Images |
|---|---|---|
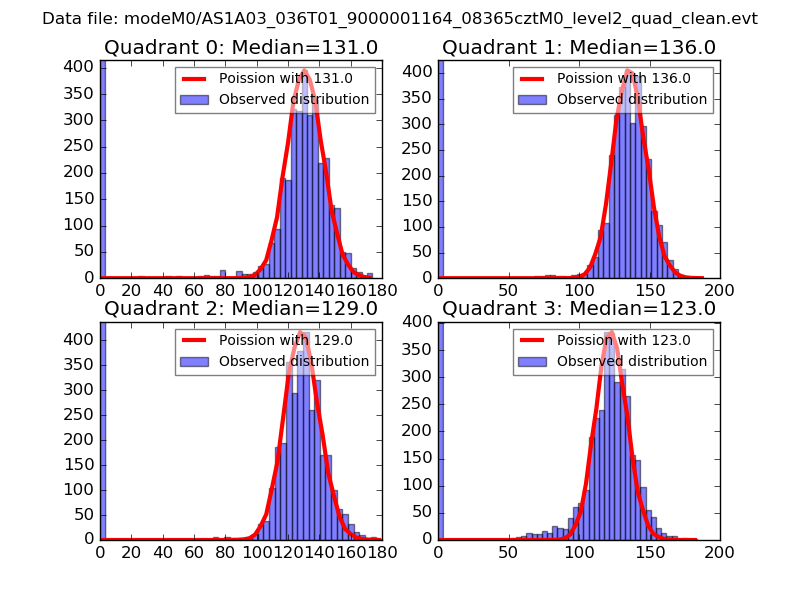
| Comparison with Poisson distribution Blue bars denote a histogram of data divided into 1 sec bins. Red curve is a Poisson curve with rate = median count rate of data. |
 |
 |
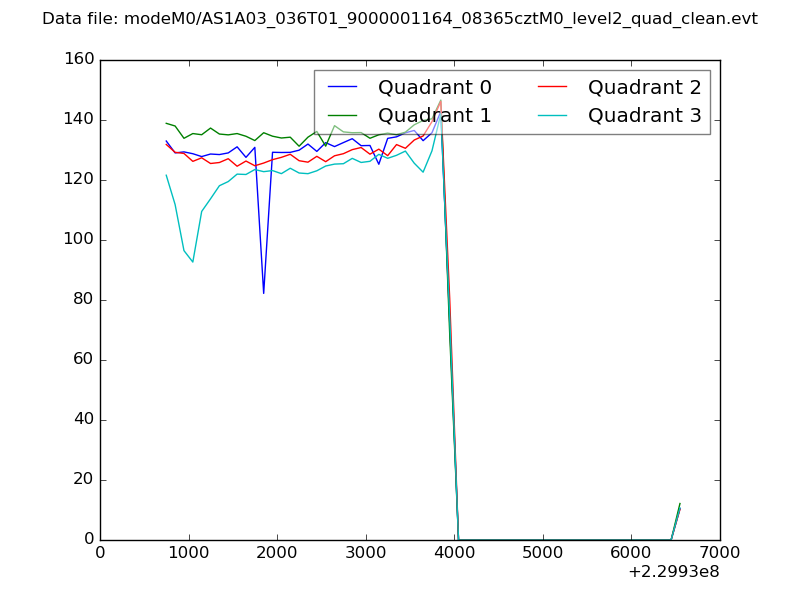
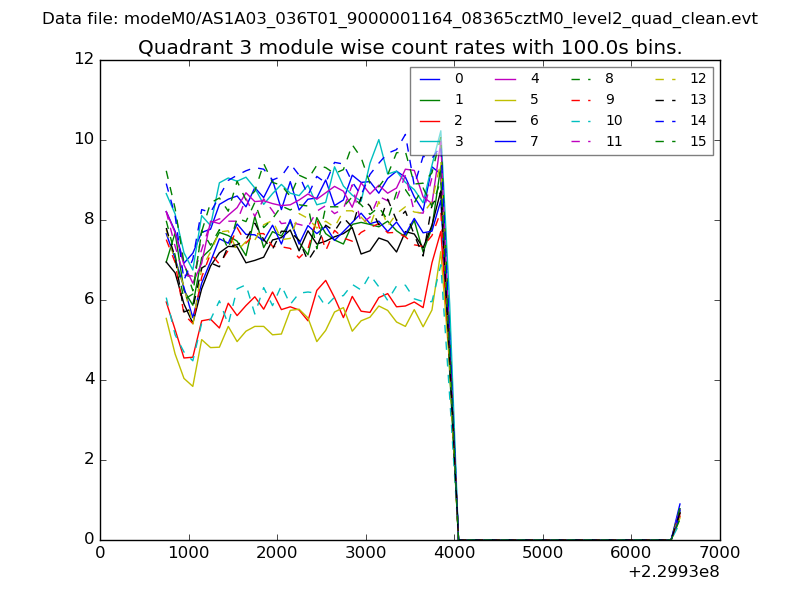
| Quadrant-wise count rates Data is divided into 100 sec bins |
 |
|
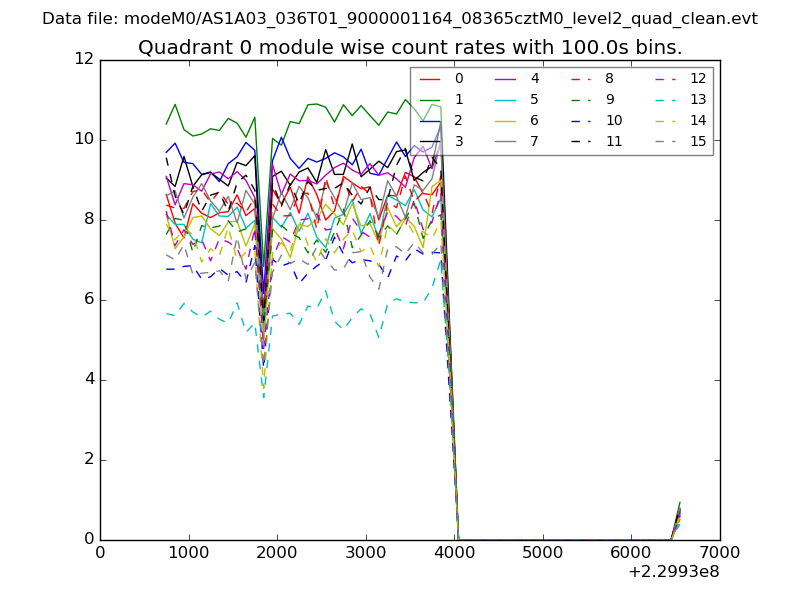
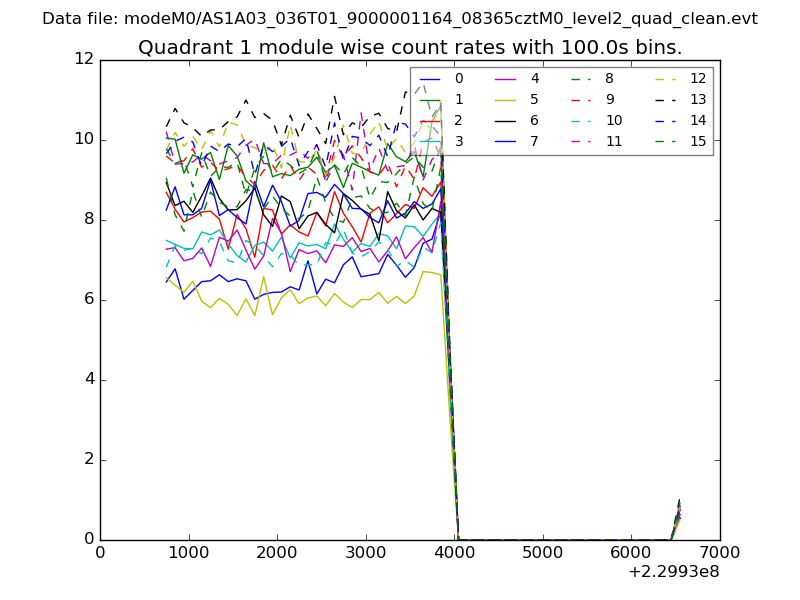
| Module-wise count rates for Quadrant A Data is divided into 100 sec bins |
 |
 |
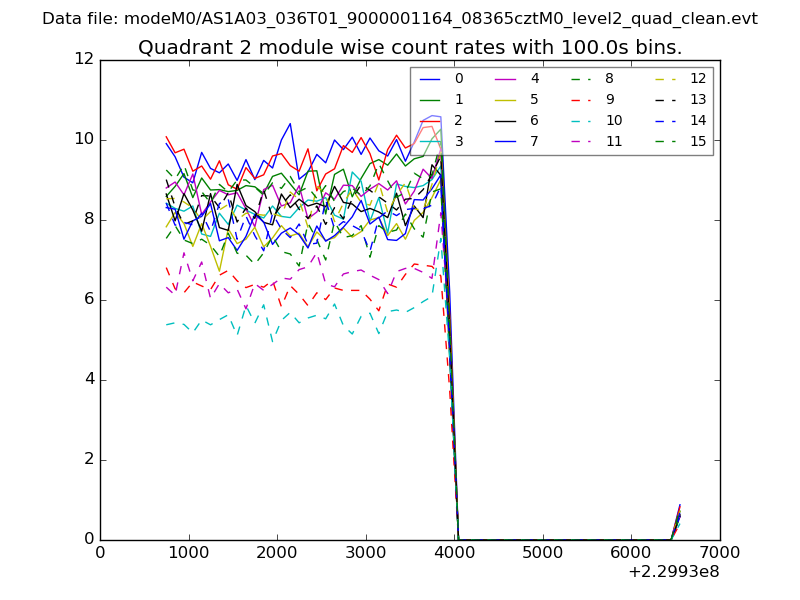
| Module-wise count rates for Quadrant B Data is divided into 100 sec bins |
 |
 |
| Module-wise count rates for Quadrant C Data is divided into 100 sec bins |
 |
 |
| Module-wise count rates for Quadrant D Data is divided into 100 sec bins |
 |
 |
| Parameter | Plot |
|---|---|
| CZT HV Monitor | 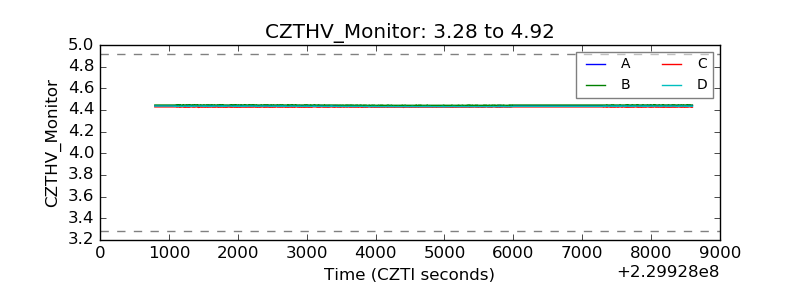 |
| D_VDD | 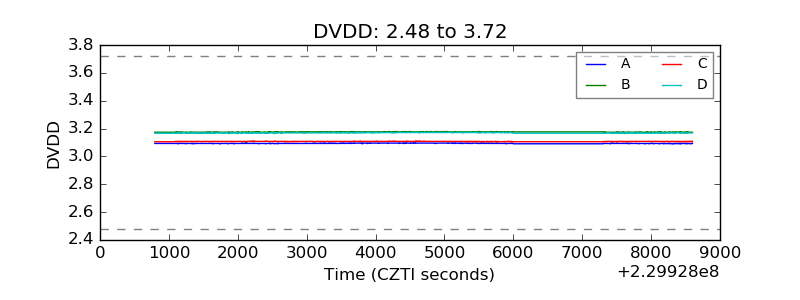 |
| Temperature 1 | 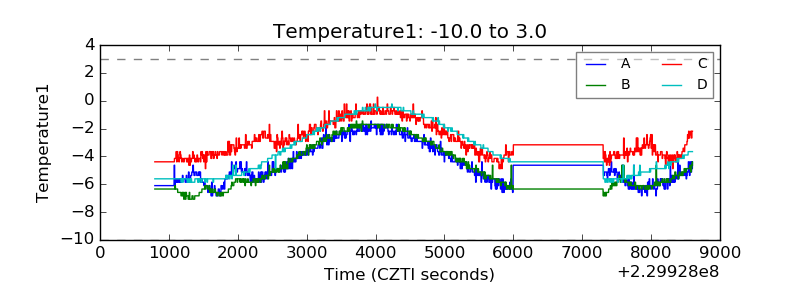 |
| Veto HV Monitor | 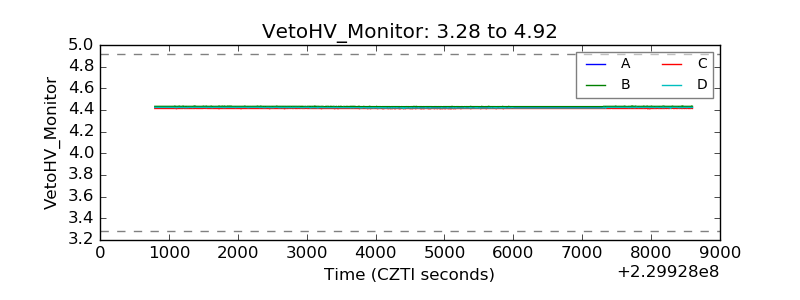 |
| Veto LLD | 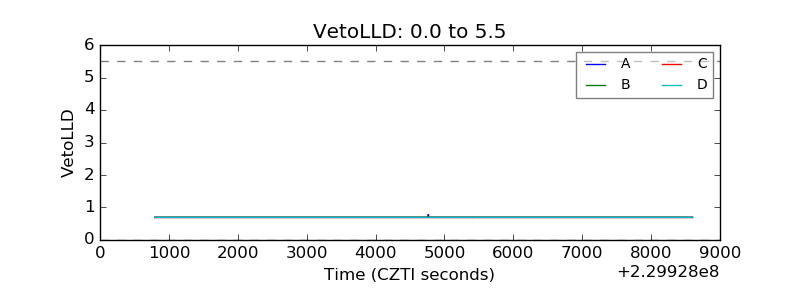 |
| Alpha Counter | 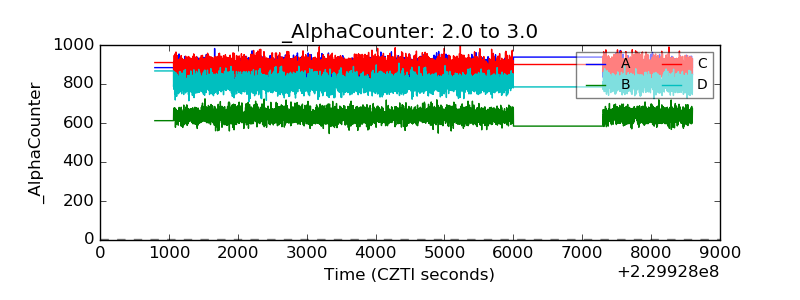 |
| _CPM_Rate | 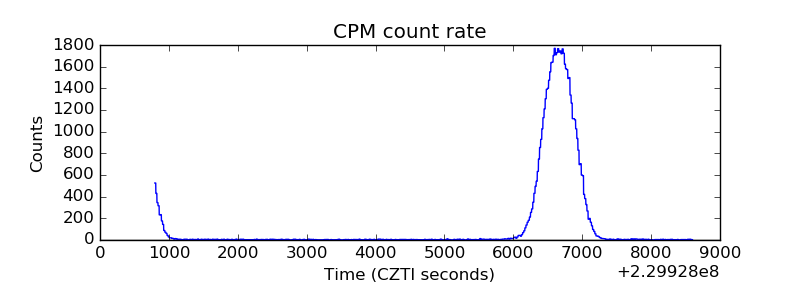 |
| CZT Counter | 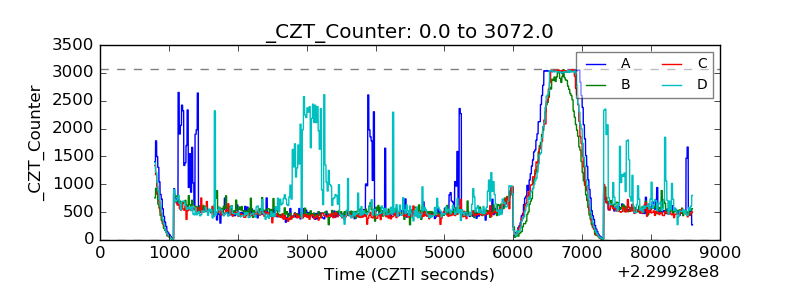 |
| +2.5 Volts monitor |  |
| +5 Volts monitor | 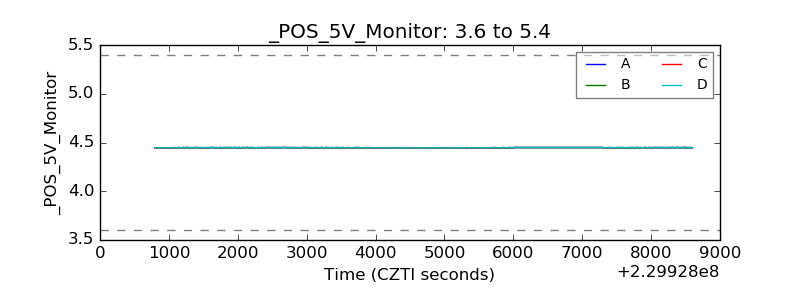 |
| _ROLL_ROT | 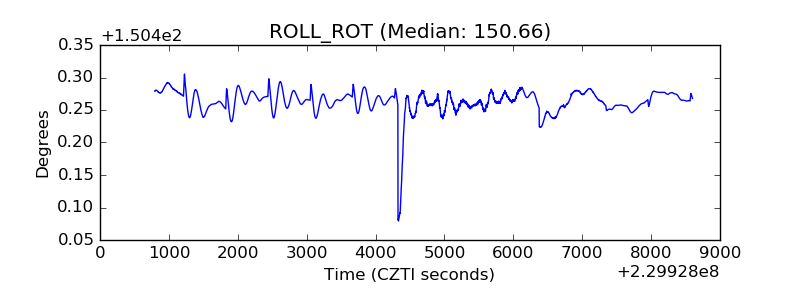 |
| _Roll_DEC | 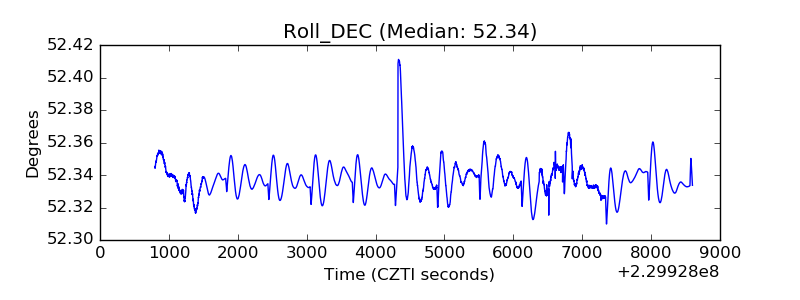 |
| _Roll_RA | 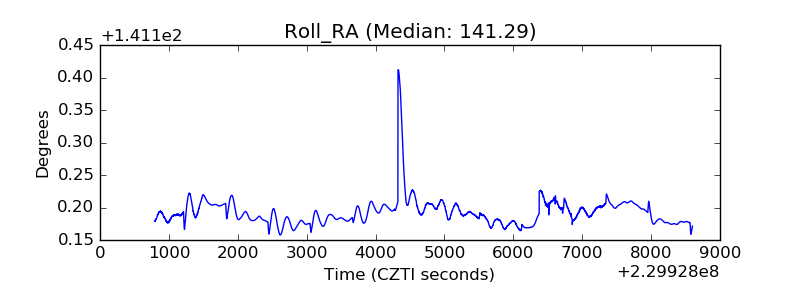 |
| Veto Counter | 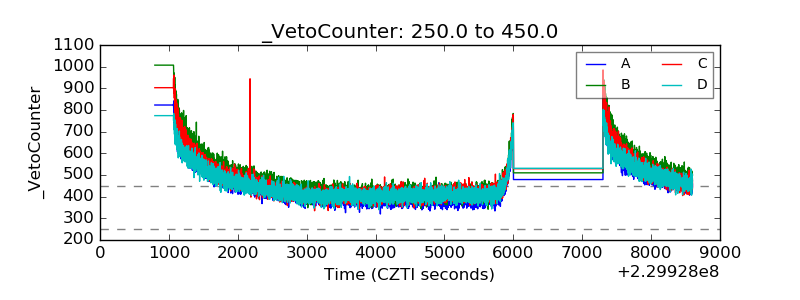 |