| Param | Original file | Final file |
|---|---|---|
| Filename | modeM0/AS1A03_036T01_9000001164_08366cztM0_level2.evt | modeM0/AS1A03_036T01_9000001164_08366cztM0_level2_quad_clean.evt |
| Size (bytes) | 471,522,240 | 86,149,440 |
| Size | 449.7 MB | 82.2 MB |
| Events in quadrant A | 3,302,990 | 549,422 |
| Events in quadrant B | 3,401,603 | 564,678 |
| Events in quadrant C | 3,061,933 | 537,602 |
| Events in quadrant D | 4,087,088 | 518,855 |
| Mode SS | |||
|---|---|---|---|
| Quadrant | BADHDUFLAG | Total packets | Discarded packets |
| A | 0 | 126 | 0 |
| B | 0 | 126 | 0 |
| C | 0 | 126 | 0 |
| D | 0 | 126 | 0 |
| Mode M0 | |||
|---|---|---|---|
| Quadrant | BADHDUFLAG | Total packets | Discarded packets |
| A | 0 | 13680 | 3 |
| B | 0 | 13862 | 2 |
| C | 0 | 13041 | 2 |
| D | 0 | 16153 | 2 |
| Mode M9 | |||
|---|---|---|---|
| Quadrant | BADHDUFLAG | Total packets | Discarded packets |
| A | 0 | 13 | 0 |
| B | 0 | 13 | 0 |
| C | 0 | 13 | 0 |
| D | 0 | 14 | 0 |
| Quadrant | Total seconds | Saturated seconds | Saturation percentage |
|---|---|---|---|
| A | 6285 | 122 | 1.941130% |
| B | 6285 | 121 | 1.925219% |
| C | 6285 | 64 | 1.018298% |
| D | 6285 | 221 | 3.516309% |
Noise dominated data is calculated using 1-second bins in cleaned event files. If a bin has >2000 counts, and if more than 50% of those come from <1% of pixels, then it is considered to be noise-dominated and hence unusable.
| Quadrant | # 1 sec bins | Bins with >0 counts | Bins with >2000 counts | High rate bins dominated by noise | Noise dominated (total time) | Noise dominated (detector-on time) | Marked lightcurve |
|---|---|---|---|---|---|---|---|
| A | 7580 | 6286 | 8 | 8 | 0.11% | 0.13% | 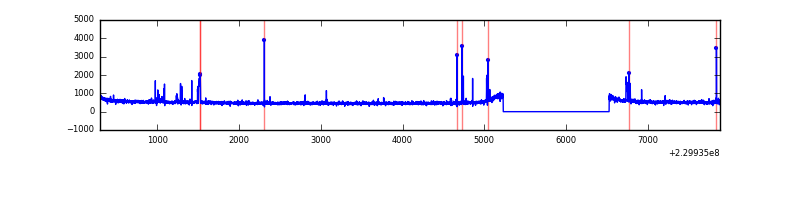 |
| B | 7580 | 6286 | 5 | 5 | 0.07% | 0.08% | 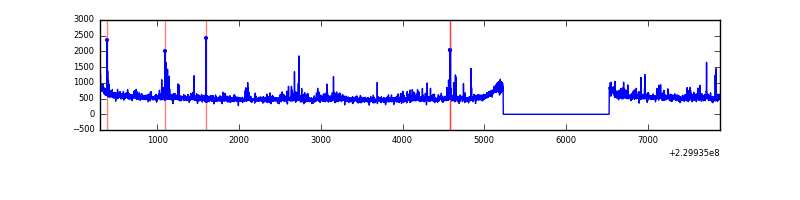 |
| C | 7580 | 6286 | 1 | 1 | 0.01% | 0.02% | 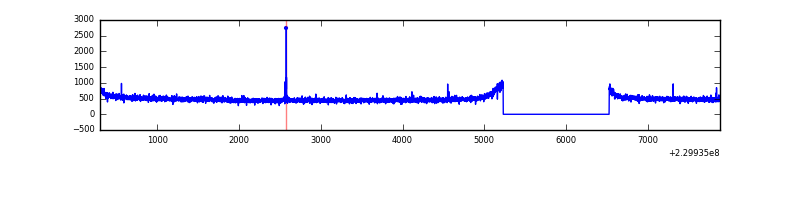 |
| D | 7580 | 6286 | 118 | 118 | 1.56% | 1.88% | 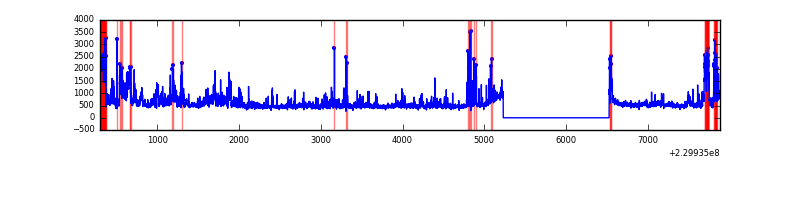 |
Top three noisy pixels from each quadrant. If the there are fewer than three noisy pixels in the level2.evt file, extra rows are filled as -1
| Pixel properties | Quadrant properties | ||||||
|---|---|---|---|---|---|---|---|
| Quadrant | DetID | PixID | Counts | Sigma | Mean | Median | Sigma |
| A | 15 | 239 | 99661 | 605.29 | 818 | 803 | 163.3 |
| A | 14 | 111 | 35289 | 211.15 | 818 | 803 | 163.3 |
| A | 15 | 236 | 14028 | 80.97 | 818 | 803 | 163.3 |
| B | 4 | 173 | 78148 | 504.54 | 821 | 803 | 153.3 |
| B | 0 | 214 | 47838 | 306.82 | 821 | 803 | 153.3 |
| B | 4 | 80 | 34683 | 221.01 | 821 | 803 | 153.3 |
| C | 1 | 16 | 12057 | 63.31 | 780 | 784 | 178.1 |
| C | 13 | 61 | 5956 | 29.05 | 780 | 784 | 178.1 |
| C | 12 | 4 | 3312 | 14.2 | 780 | 784 | 178.1 |
| D | 12 | 233 | 698575 | 3433.85 | 771 | 756 | 203.2 |
| D | 2 | 152 | 264124 | 1295.99 | 771 | 756 | 203.2 |
| D | 7 | 71 | 87286 | 425.8 | 771 | 756 | 203.2 |
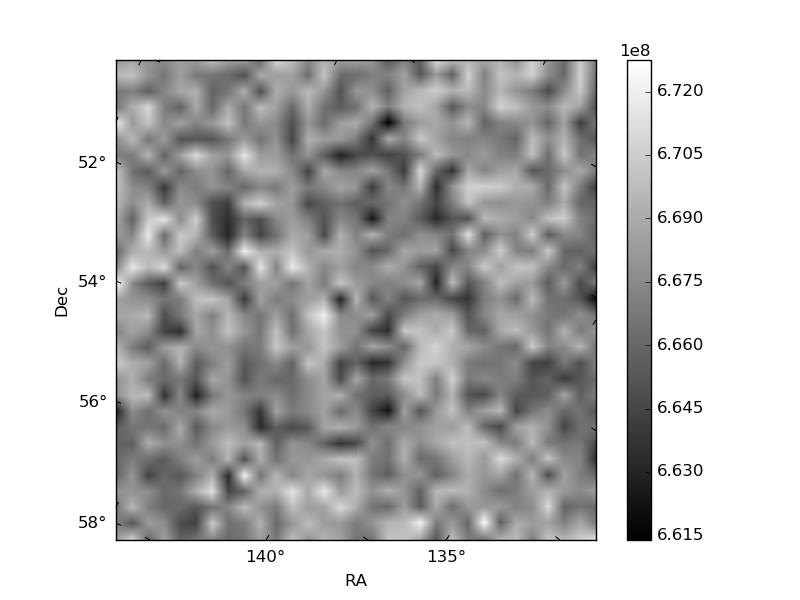
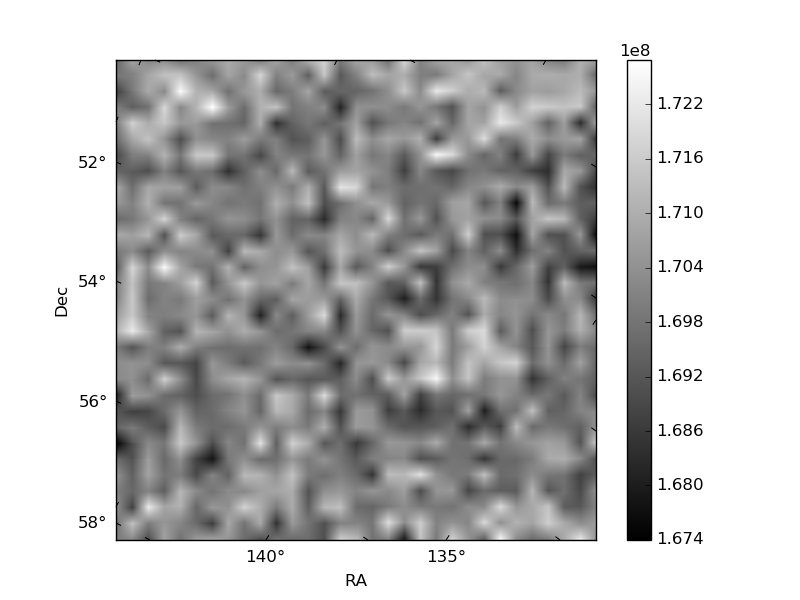
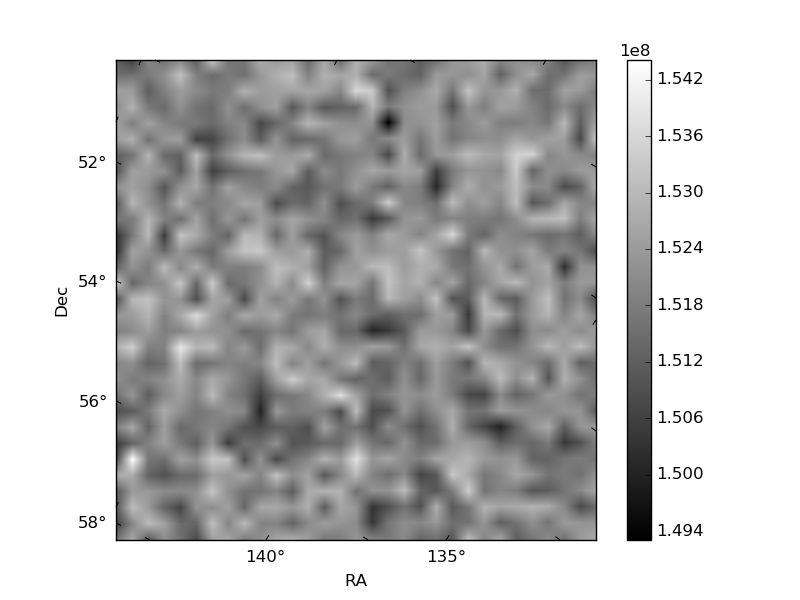
Histogram calculated using DETX and DETY for each event in the final _common_clean file
| Quadrant A | 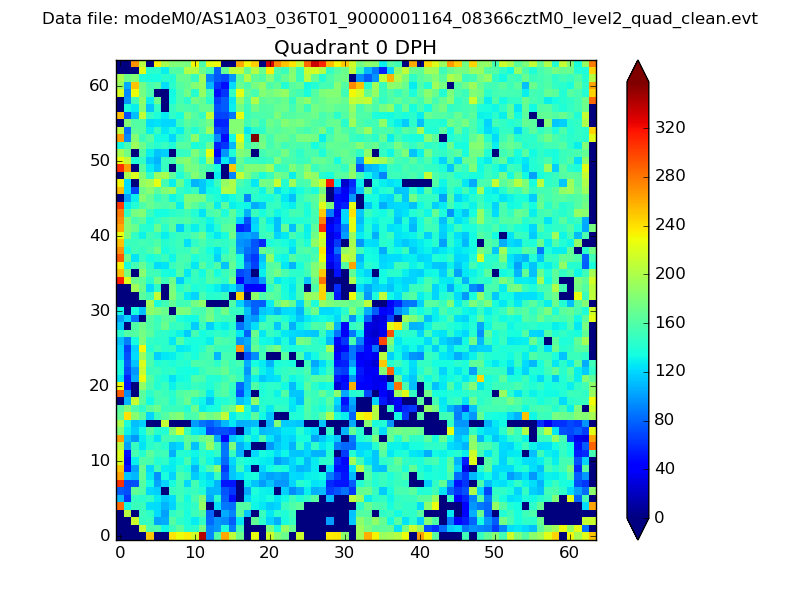 |
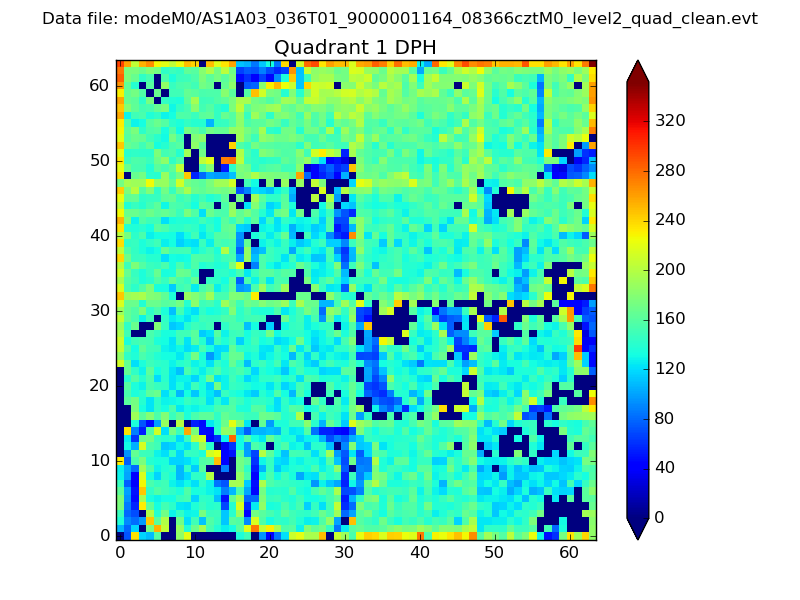 |
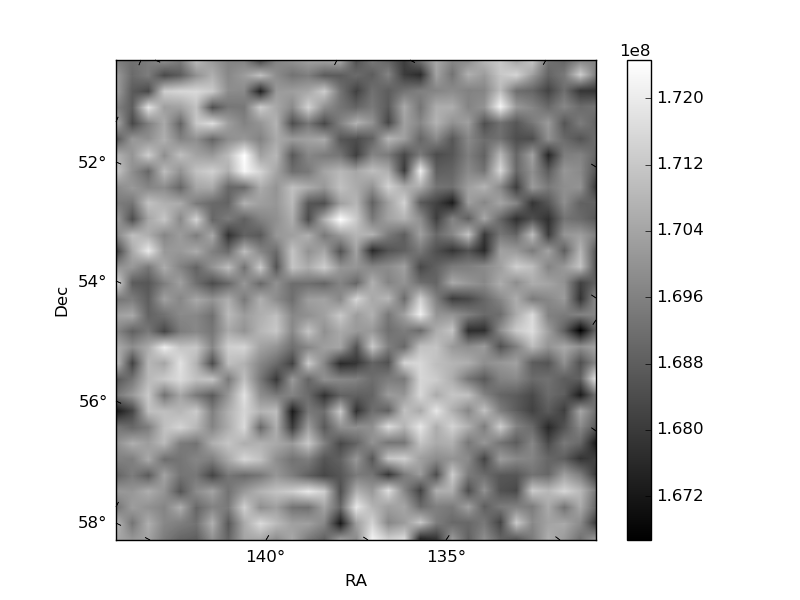
Quadrant B |
|---|---|---|---|
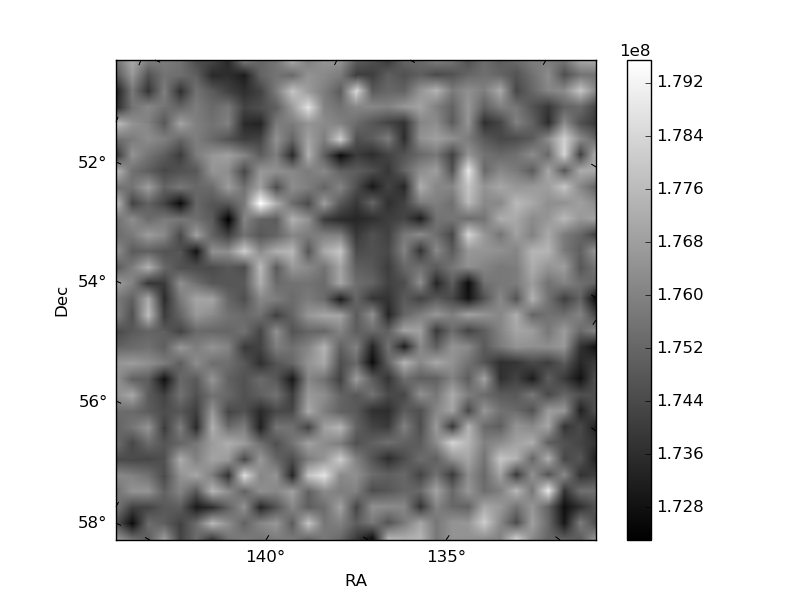
| Quadrant D | 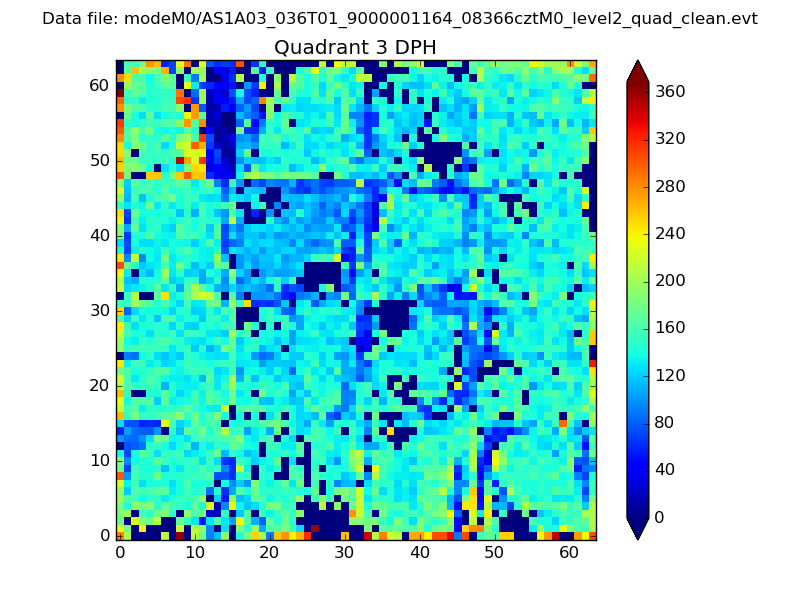 |
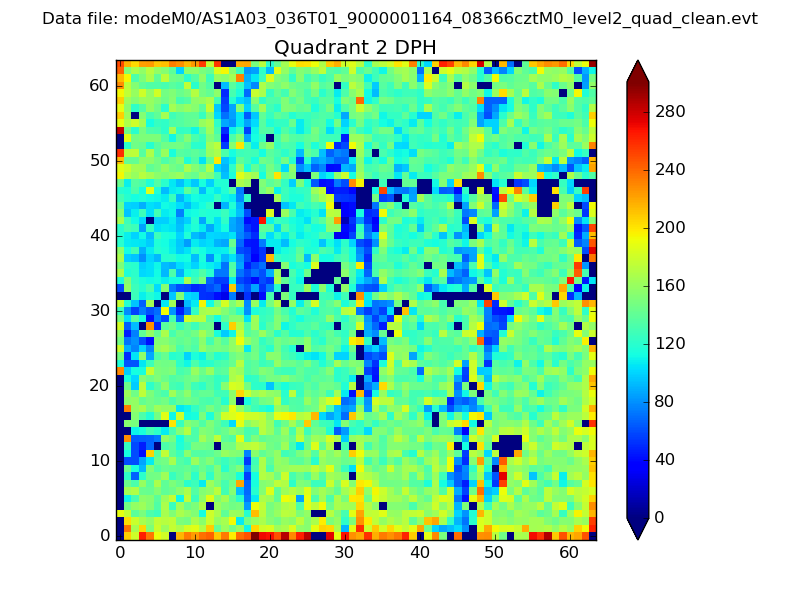 |
Quadrant C |
| Plot type | Count rate plots | Images |
|---|---|---|
| Comparison with Poisson distribution Blue bars denote a histogram of data divided into 1 sec bins. Red curve is a Poisson curve with rate = median count rate of data. |
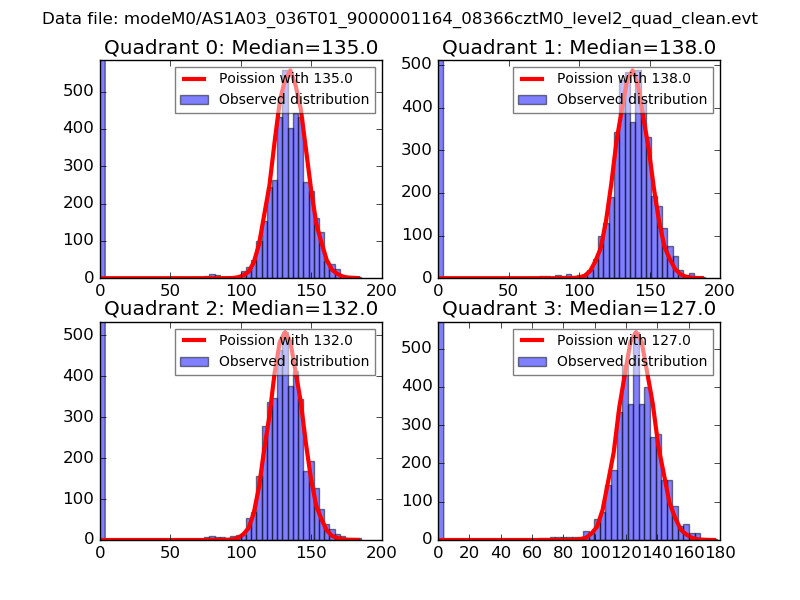 |
 |
| Quadrant-wise count rates Data is divided into 100 sec bins |
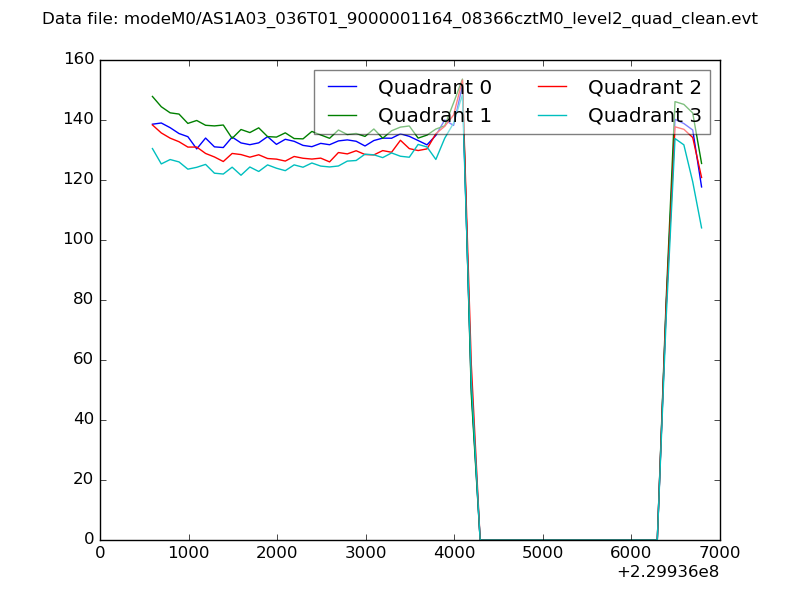 |
|
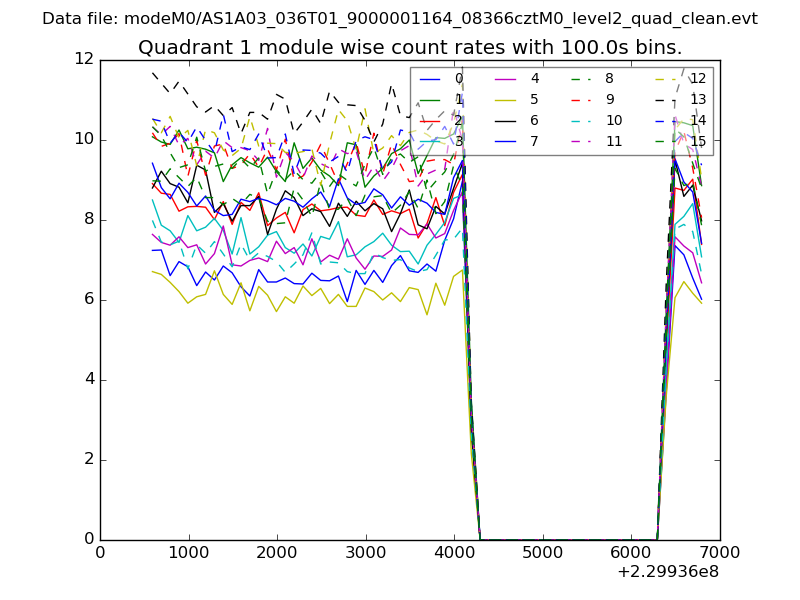
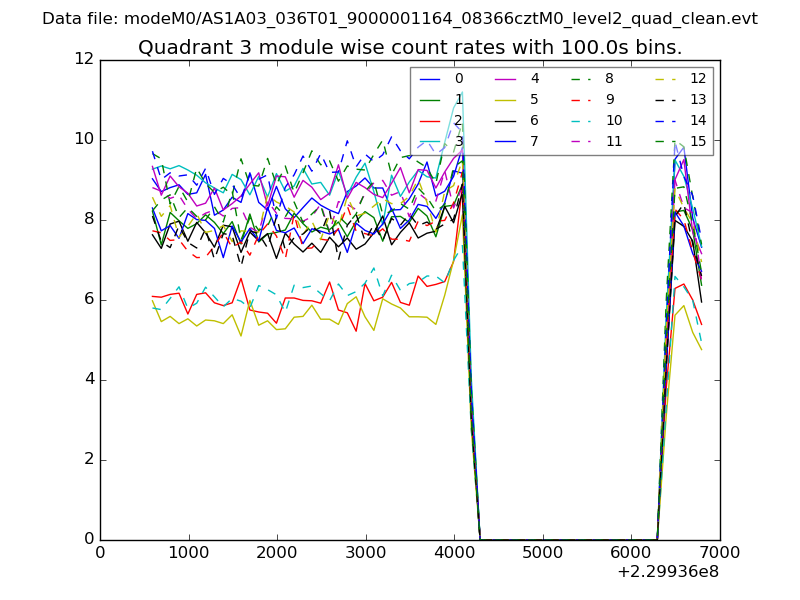
| Module-wise count rates for Quadrant A Data is divided into 100 sec bins |
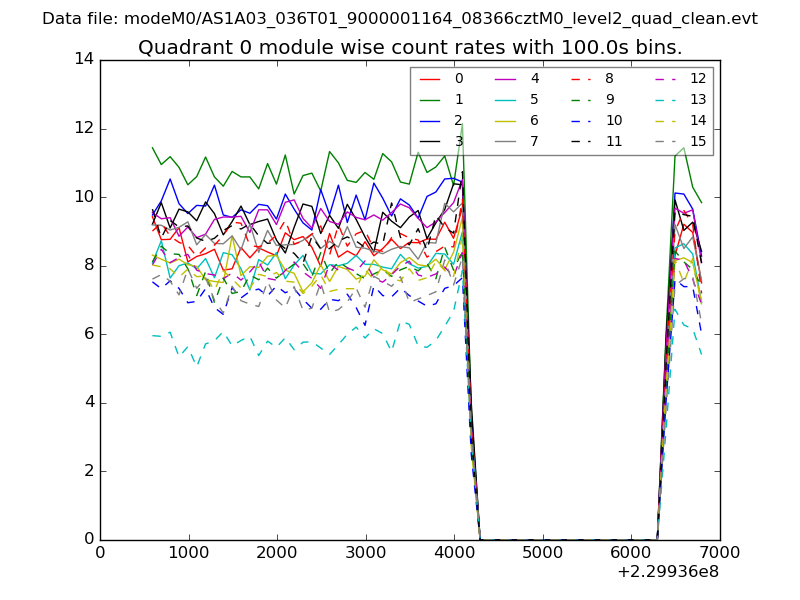 |
 |
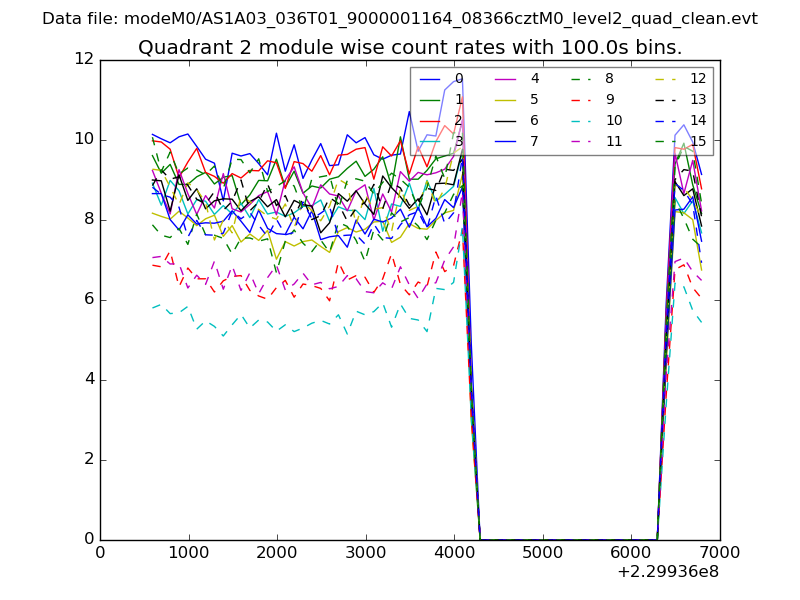
| Module-wise count rates for Quadrant B Data is divided into 100 sec bins |
 |
 |
| Module-wise count rates for Quadrant C Data is divided into 100 sec bins |
 |
 |
| Module-wise count rates for Quadrant D Data is divided into 100 sec bins |
 |
 |
| Parameter | Plot |
|---|---|
| CZT HV Monitor | 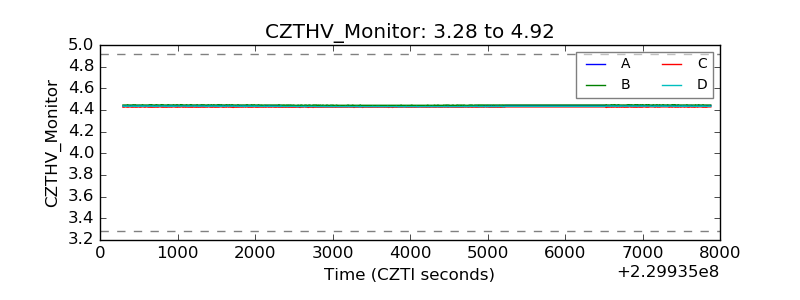 |
| D_VDD | 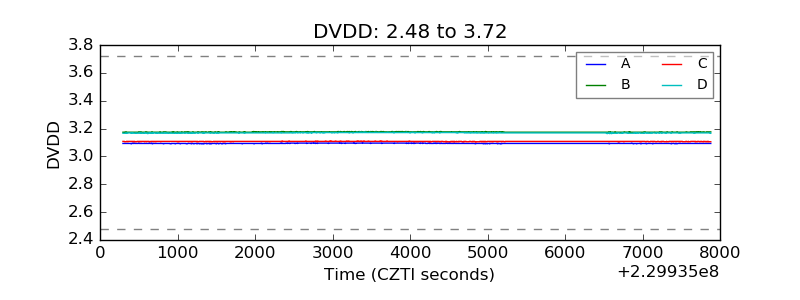 |
| Temperature 1 | 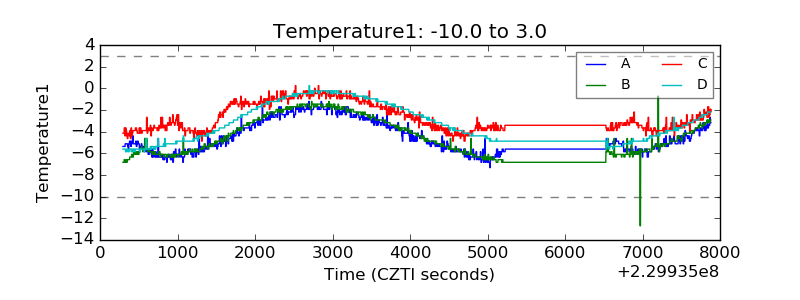 |
| Veto HV Monitor | 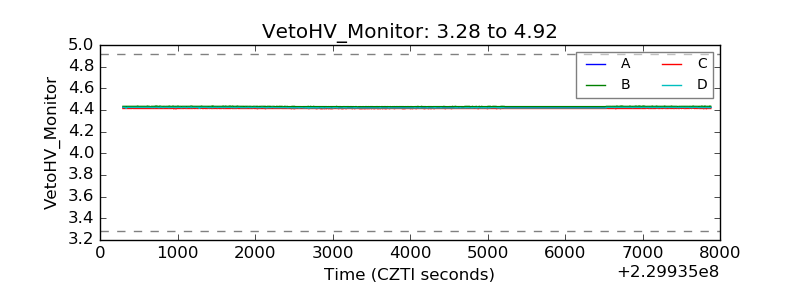 |
| Veto LLD | 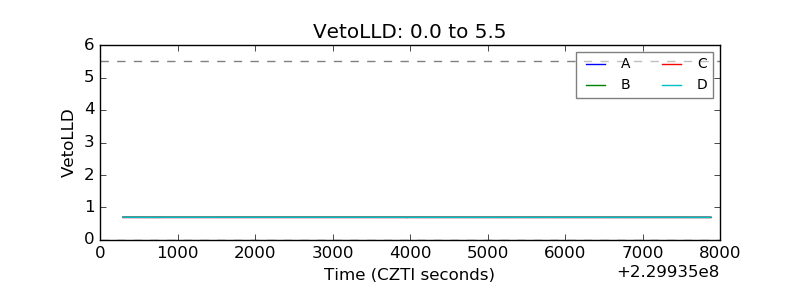 |
| Alpha Counter | 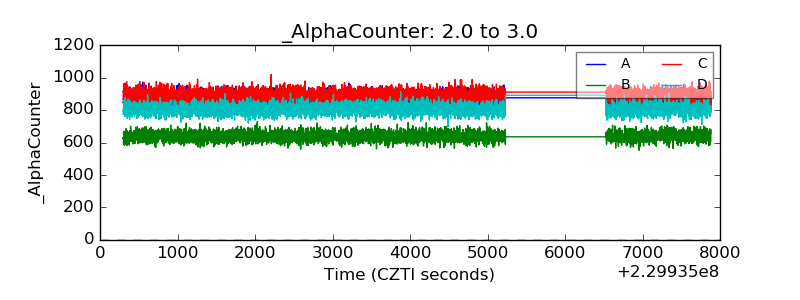 |
| _CPM_Rate | 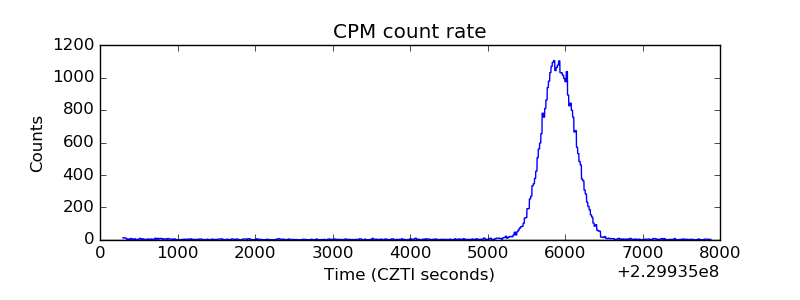 |
| CZT Counter | 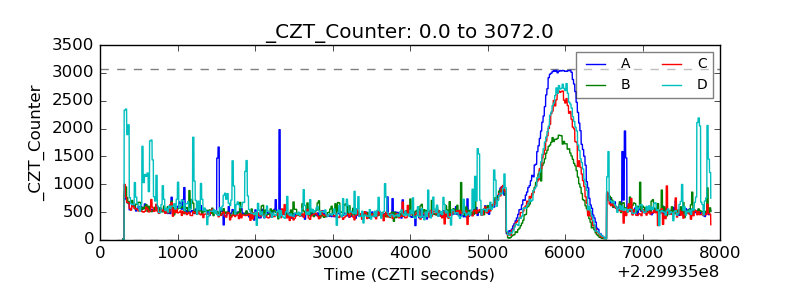 |
| +2.5 Volts monitor |  |
| +5 Volts monitor |  |
| _ROLL_ROT | 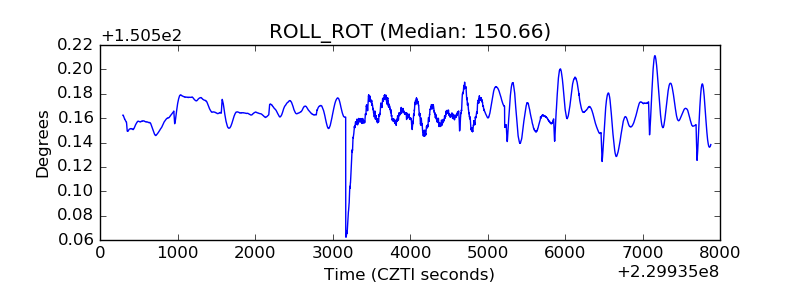 |
| _Roll_DEC | 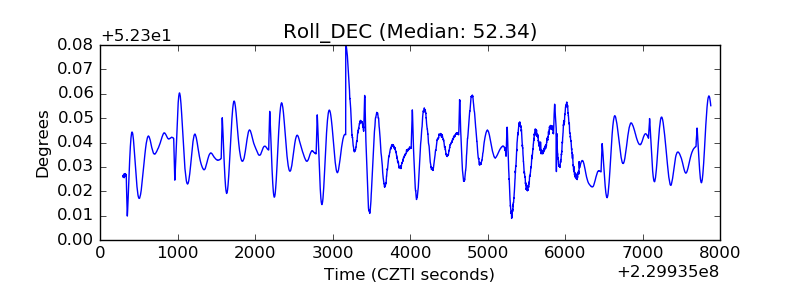 |
| _Roll_RA | 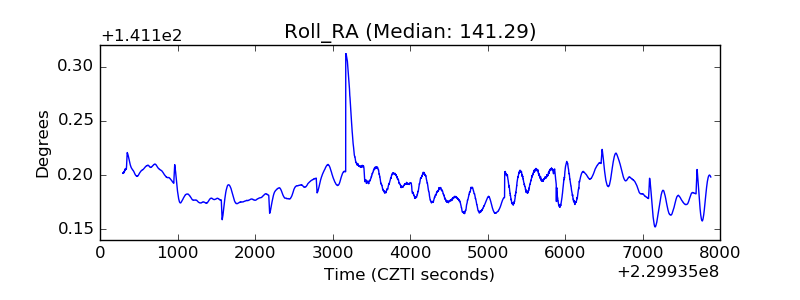 |
| Veto Counter | 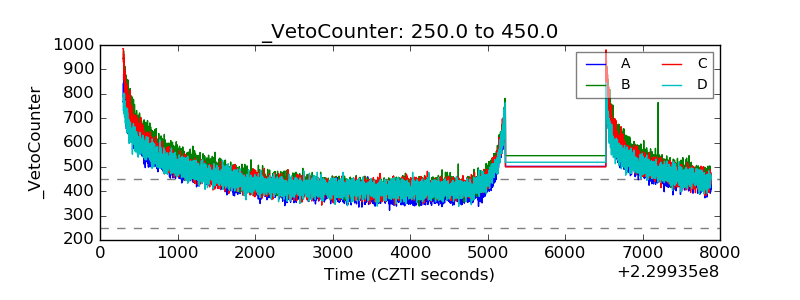 |