| Param | Original file | Final file |
|---|---|---|
| Filename | modeM0/AS1A03_036T01_9000001164_08369cztM0_level2.evt | modeM0/AS1A03_036T01_9000001164_08369cztM0_level2_quad_clean.evt |
| Size (bytes) | 475,104,960 | 94,541,760 |
| Size | 453.1 MB | 90.2 MB |
| Events in quadrant A | 4,065,390 | 583,993 |
| Events in quadrant B | 3,279,531 | 623,420 |
| Events in quadrant C | 3,054,516 | 602,699 |
| Events in quadrant D | 3,529,732 | 582,019 |
| Mode SS | |||
|---|---|---|---|
| Quadrant | BADHDUFLAG | Total packets | Discarded packets |
| A | 0 | 140 | 0 |
| B | 0 | 140 | 0 |
| C | 0 | 140 | 0 |
| D | 0 | 140 | 0 |
| Mode M0 | |||
|---|---|---|---|
| Quadrant | BADHDUFLAG | Total packets | Discarded packets |
| A | 0 | 16784 | 2 |
| B | 0 | 14174 | 1 |
| C | 0 | 13918 | 1 |
| D | 0 | 15087 | 1 |
| Mode M9 | |||
|---|---|---|---|
| Quadrant | BADHDUFLAG | Total packets | Discarded packets |
| A | 0 | 3 | 0 |
| B | 0 | 3 | 0 |
| C | 0 | 3 | 0 |
| D | 0 | 3 | 0 |
| Quadrant | Total seconds | Saturated seconds | Saturation percentage |
|---|---|---|---|
| A | 6746 | 578 | 8.568040% |
| B | 6746 | 148 | 2.193893% |
| C | 6746 | 121 | 1.793655% |
| D | 6746 | 165 | 2.445894% |
Noise dominated data is calculated using 1-second bins in cleaned event files. If a bin has >2000 counts, and if more than 50% of those come from <1% of pixels, then it is considered to be noise-dominated and hence unusable.
| Quadrant | # 1 sec bins | Bins with >0 counts | Bins with >2000 counts | High rate bins dominated by noise | Noise dominated (total time) | Noise dominated (detector-on time) | Marked lightcurve |
|---|---|---|---|---|---|---|---|
| A | 7115 | 6745 | 384 | 384 | 5.40% | 5.69% | 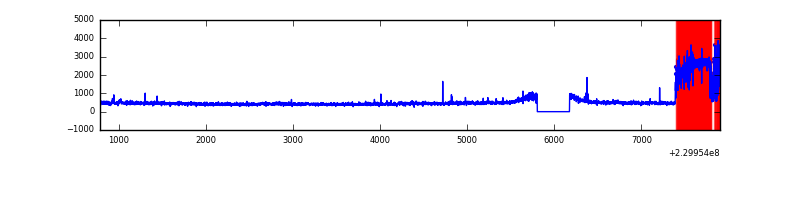 |
| B | 7116 | 6747 | 5 | 5 | 0.07% | 0.07% | 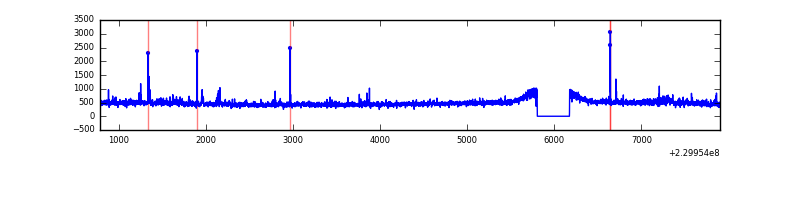 |
| C | 7116 | 6747 | 0 | 0 | 0.00% | 0.00% | 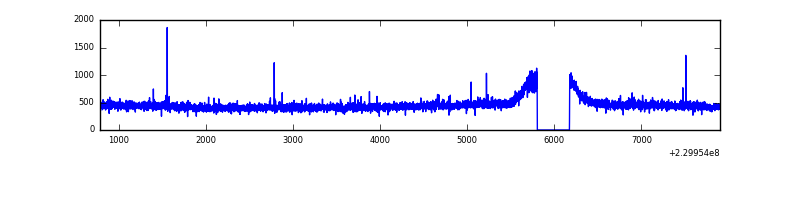 |
| D | 7116 | 6747 | 19 | 19 | 0.27% | 0.28% | 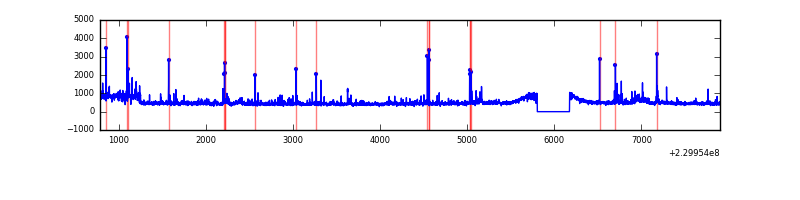 |
Top three noisy pixels from each quadrant. If the there are fewer than three noisy pixels in the level2.evt file, extra rows are filled as -1
| Pixel properties | Quadrant properties | ||||||
|---|---|---|---|---|---|---|---|
| Quadrant | DetID | PixID | Counts | Sigma | Mean | Median | Sigma |
| A | 15 | 236 | 1023357 | 6389.25 | 779 | 760 | 160.0 |
| A | 13 | 251 | 13397 | 78.95 | 779 | 760 | 160.0 |
| A | 1 | 162 | 9707 | 55.9 | 779 | 760 | 160.0 |
| B | 0 | 214 | 91735 | 594.93 | 803 | 784 | 152.9 |
| B | 15 | 204 | 17917 | 112.07 | 803 | 784 | 152.9 |
| B | 12 | 111 | 16109 | 100.24 | 803 | 784 | 152.9 |
| C | 1 | 16 | 17158 | 90.25 | 779 | 779 | 181.5 |
| C | 13 | 61 | 5855 | 27.97 | 779 | 779 | 181.5 |
| C | 3 | 202 | 1994 | 6.69 | 779 | 779 | 181.5 |
| D | 1 | 52 | 191902 | 920.78 | 776 | 757 | 207.6 |
| D | 8 | 195 | 62512 | 297.48 | 776 | 757 | 207.6 |
| D | 7 | 71 | 61958 | 294.82 | 776 | 757 | 207.6 |
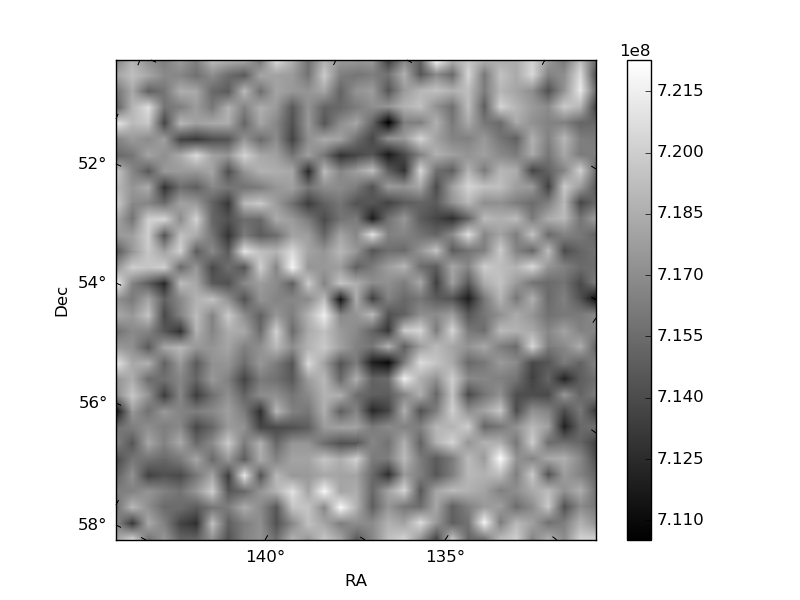
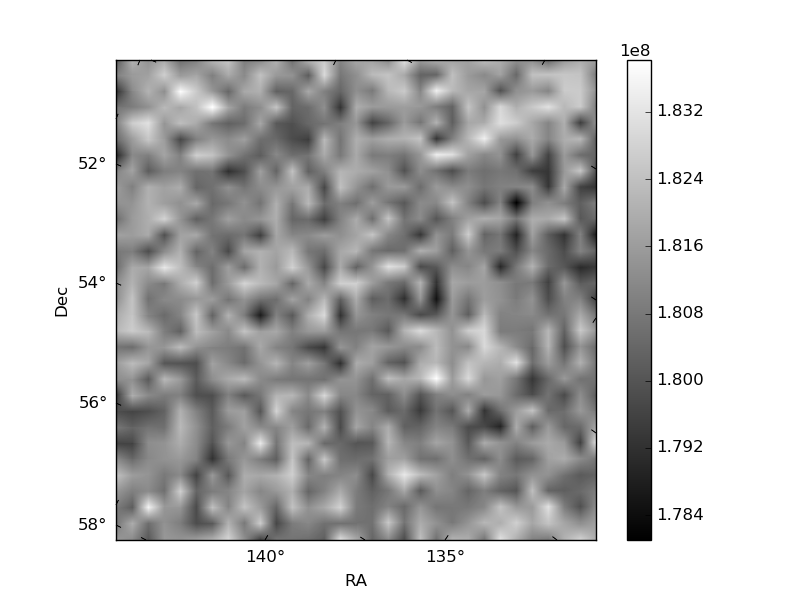
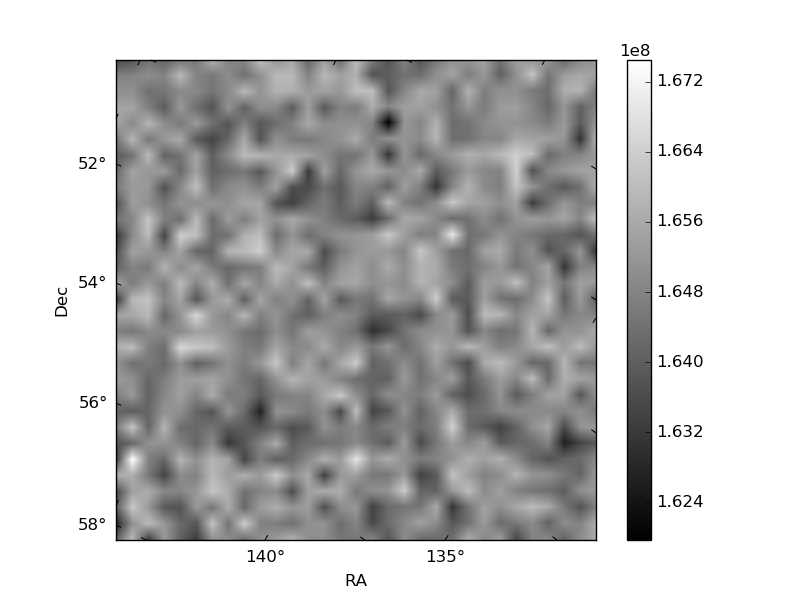
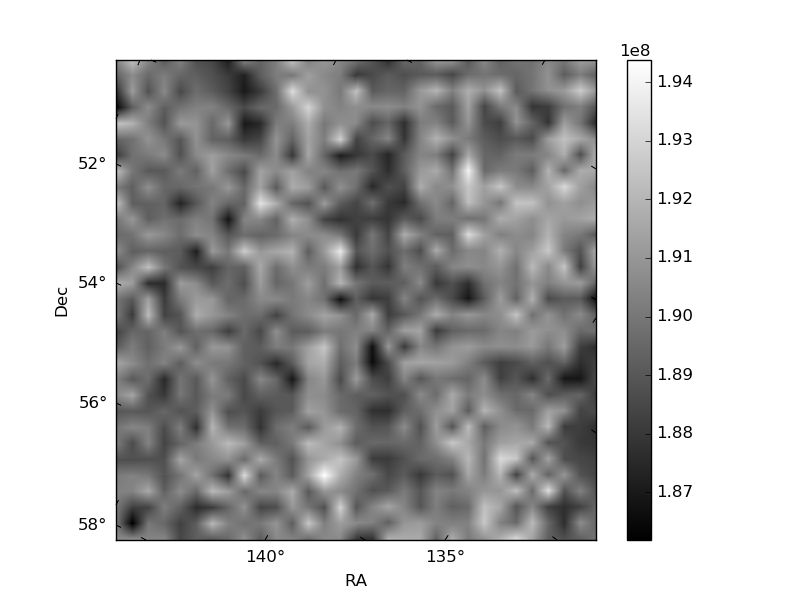
Histogram calculated using DETX and DETY for each event in the final _common_clean file
| Quadrant A | 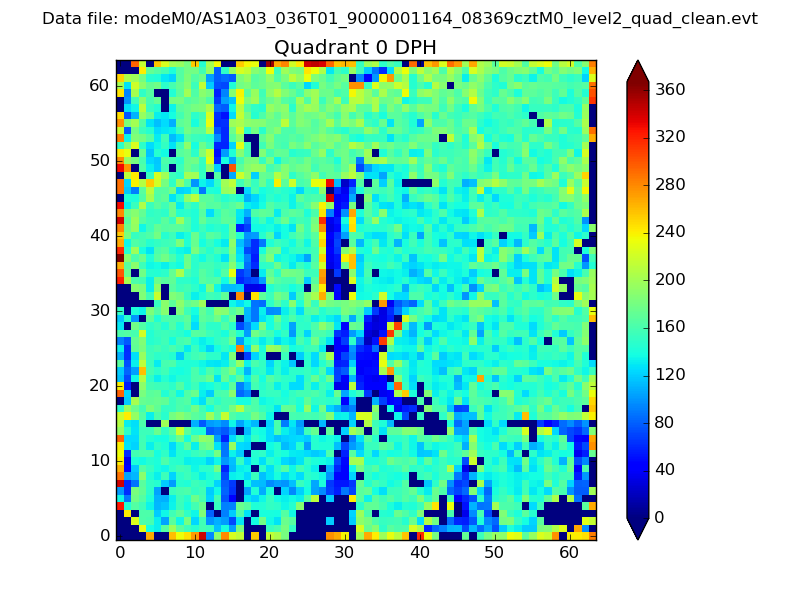 |
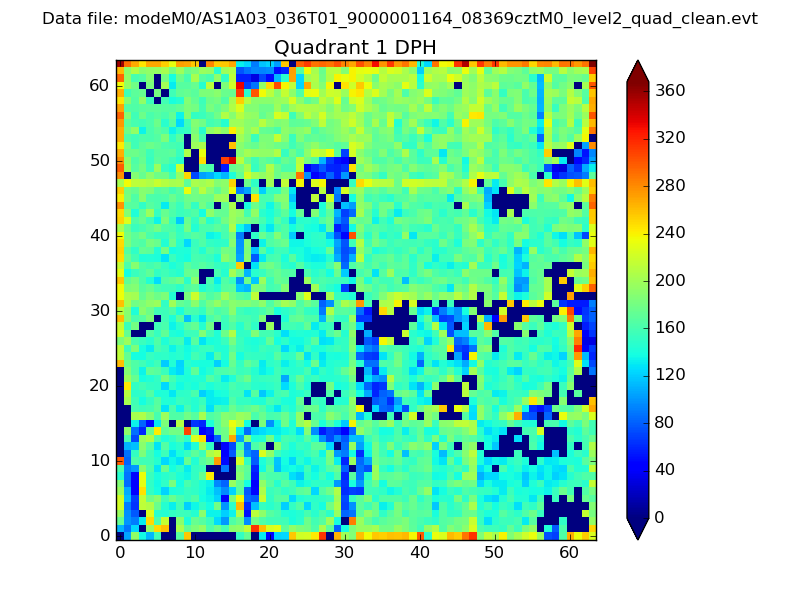 |
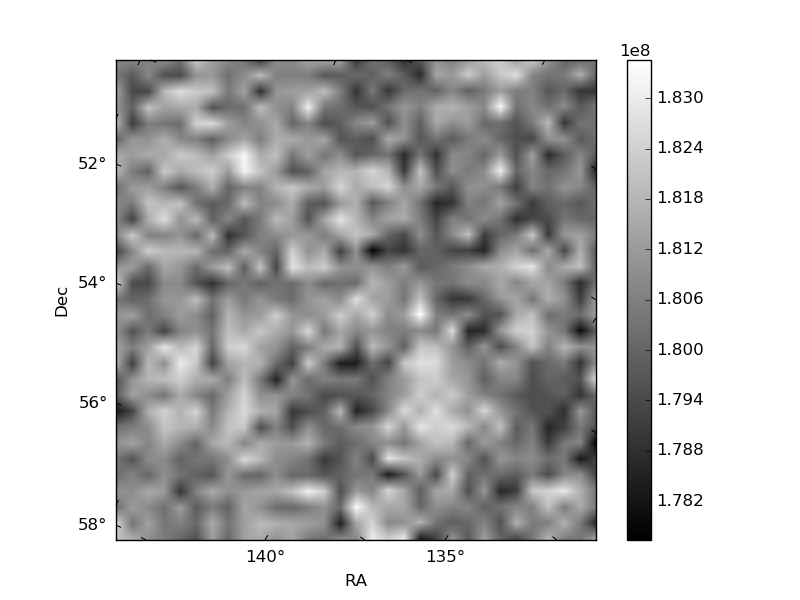
Quadrant B |
|---|---|---|---|
| Quadrant D | 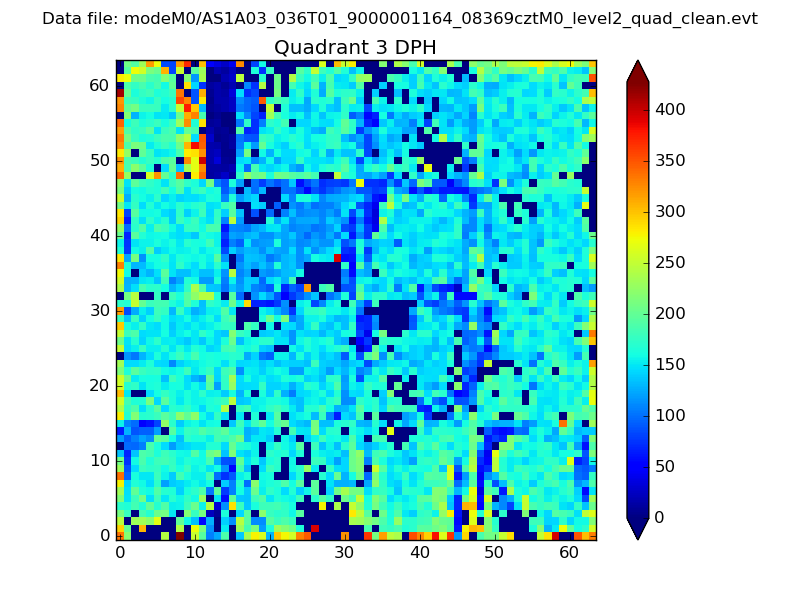 |
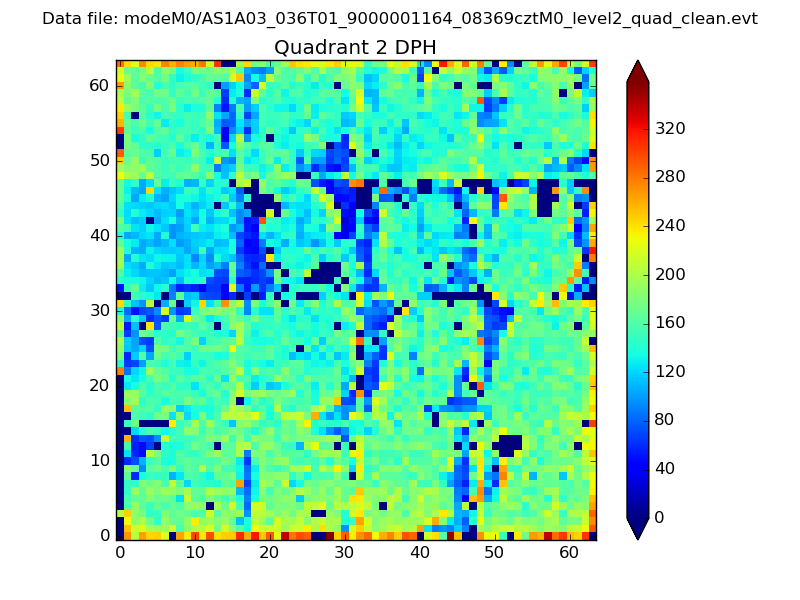 |
Quadrant C |
| Plot type | Count rate plots | Images |
|---|---|---|
| Comparison with Poisson distribution Blue bars denote a histogram of data divided into 1 sec bins. Red curve is a Poisson curve with rate = median count rate of data. |
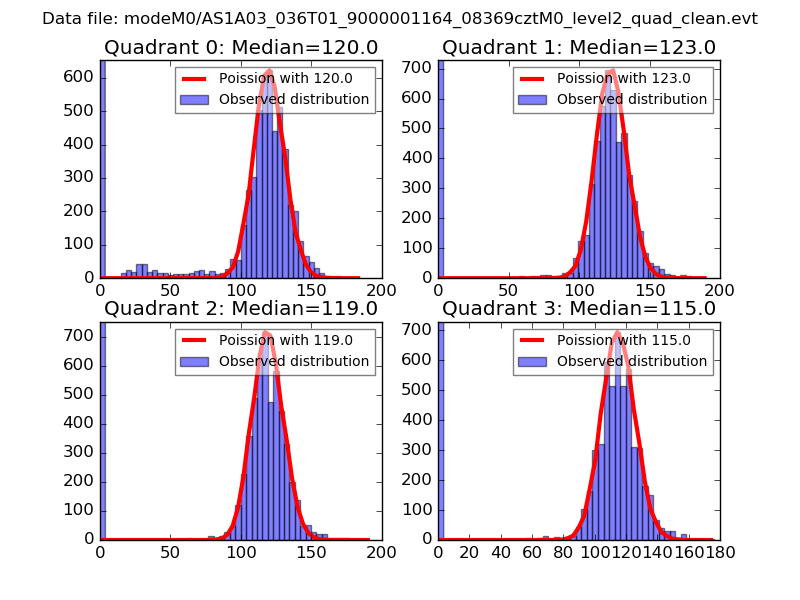 |
 |
| Quadrant-wise count rates Data is divided into 100 sec bins |
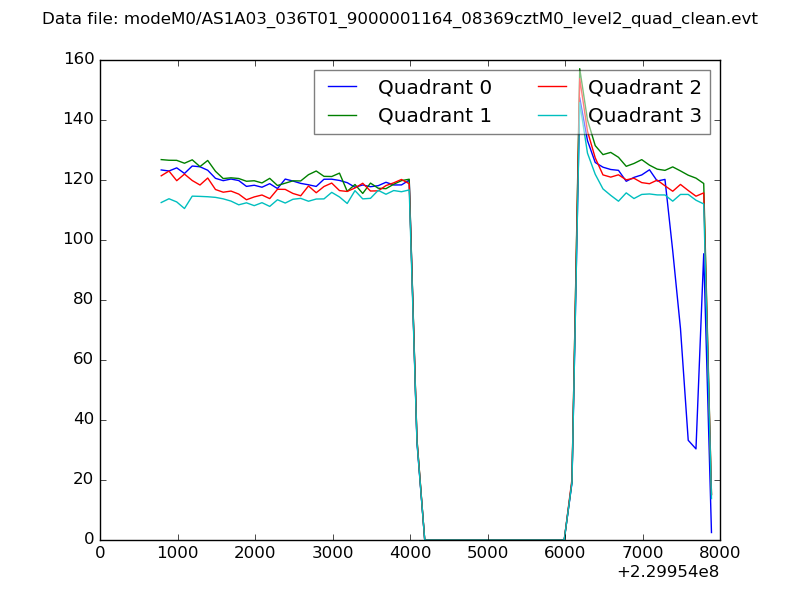 |
|
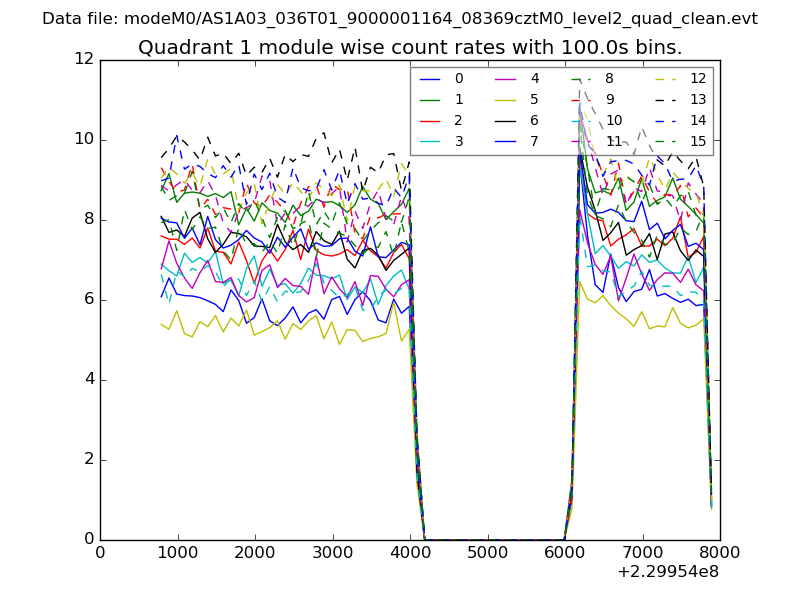
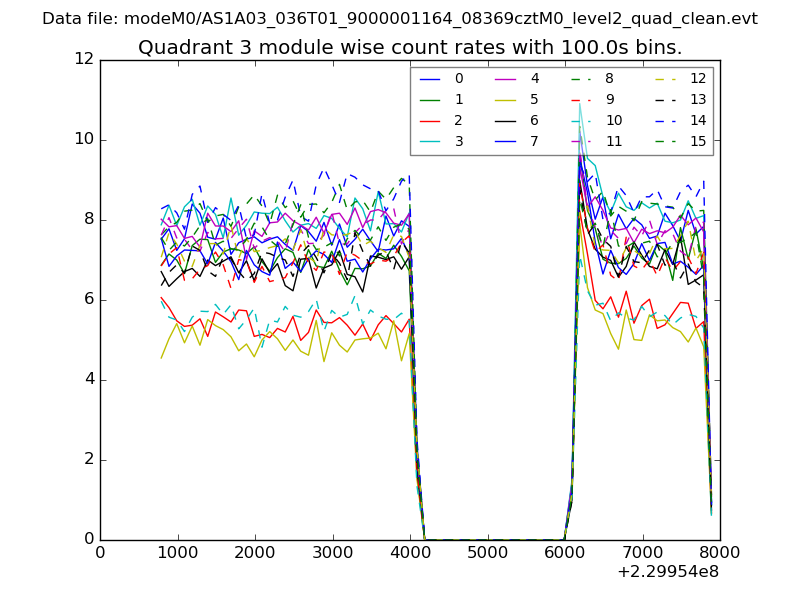
| Module-wise count rates for Quadrant A Data is divided into 100 sec bins |
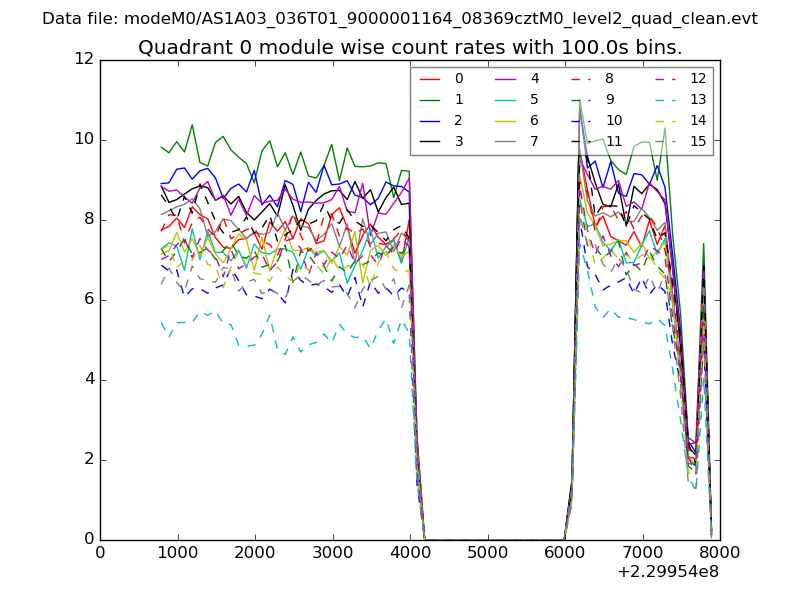 |
 |
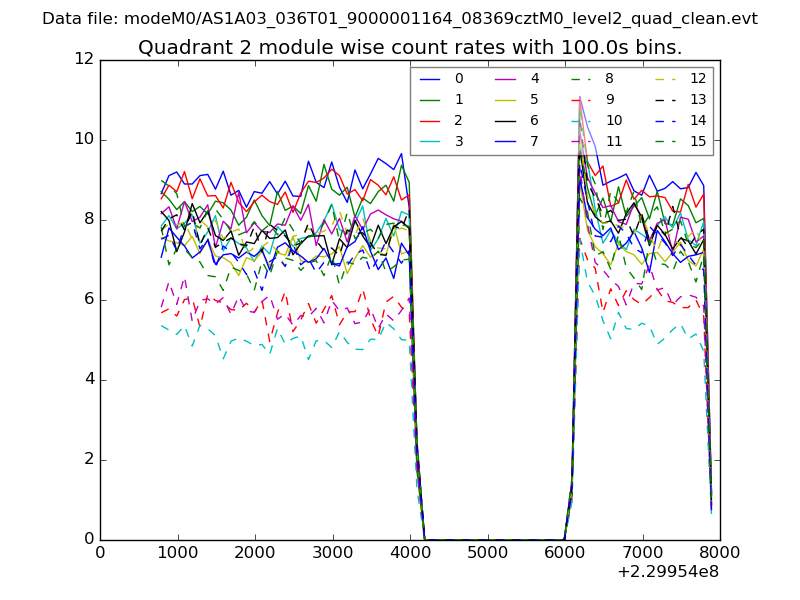
| Module-wise count rates for Quadrant B Data is divided into 100 sec bins |
 |
 |
| Module-wise count rates for Quadrant C Data is divided into 100 sec bins |
 |
 |
| Module-wise count rates for Quadrant D Data is divided into 100 sec bins |
 |
 |
| Parameter | Plot |
|---|---|
| CZT HV Monitor | 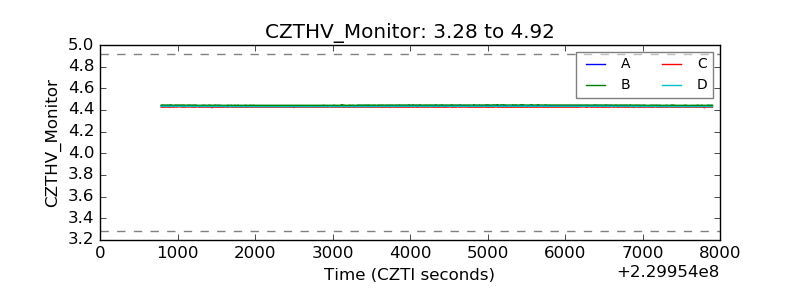 |
| D_VDD | 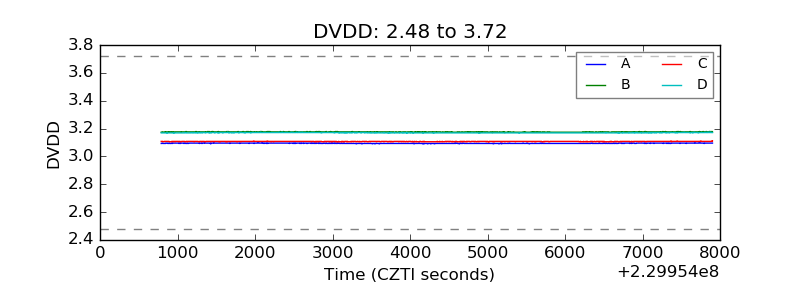 |
| Temperature 1 | 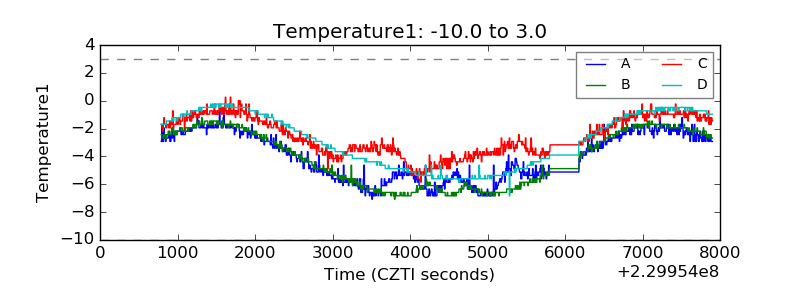 |
| Veto HV Monitor | 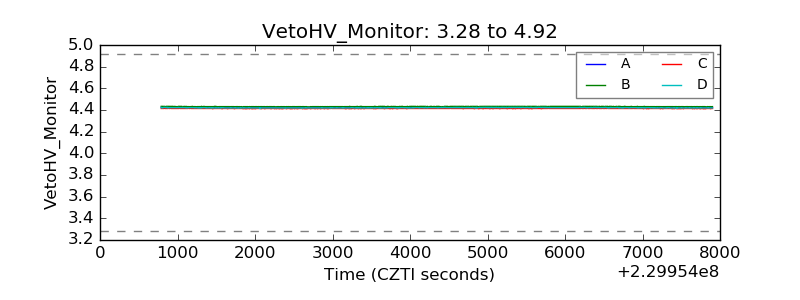 |
| Veto LLD | 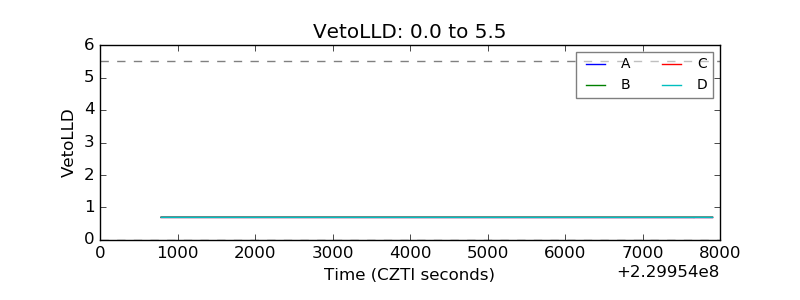 |
| Alpha Counter | 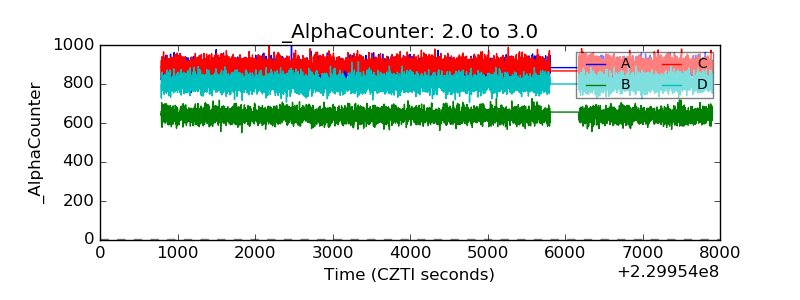 |
| _CPM_Rate | 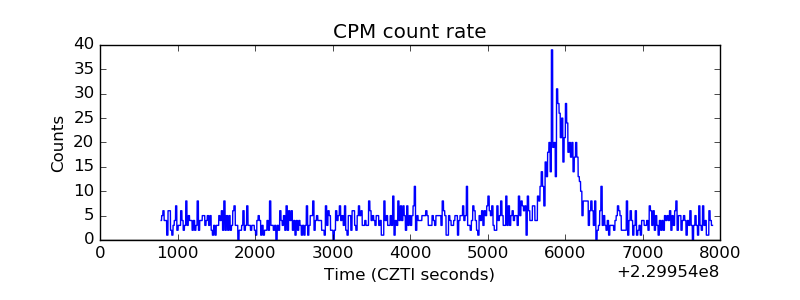 |
| CZT Counter | 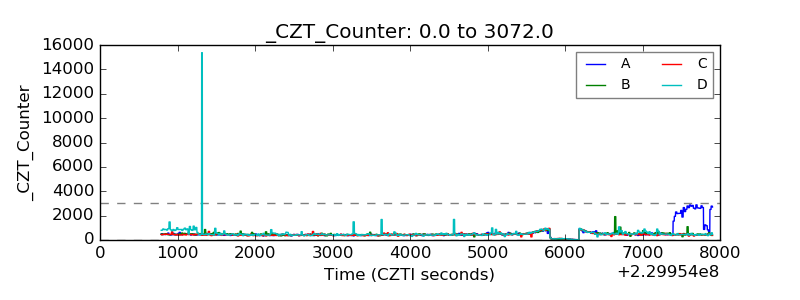 |
| +2.5 Volts monitor |  |
| +5 Volts monitor | 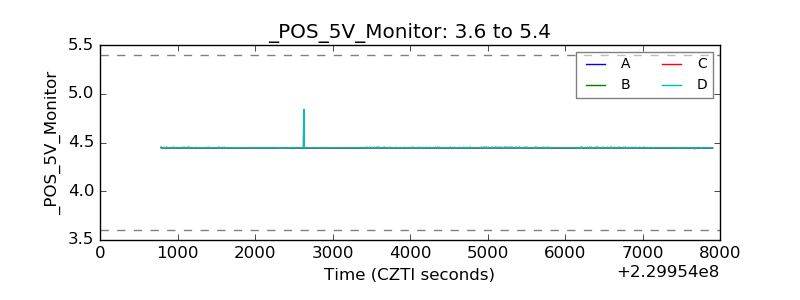 |
| _ROLL_ROT | 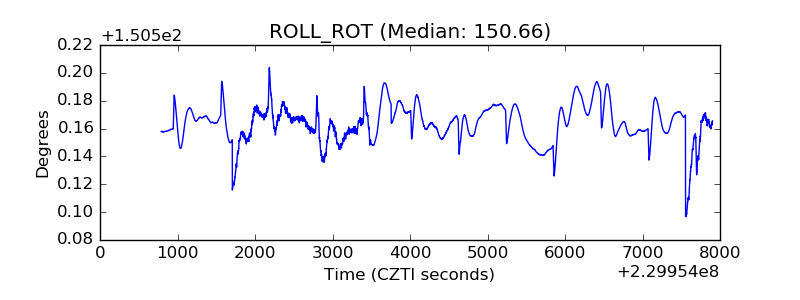 |
| _Roll_DEC | 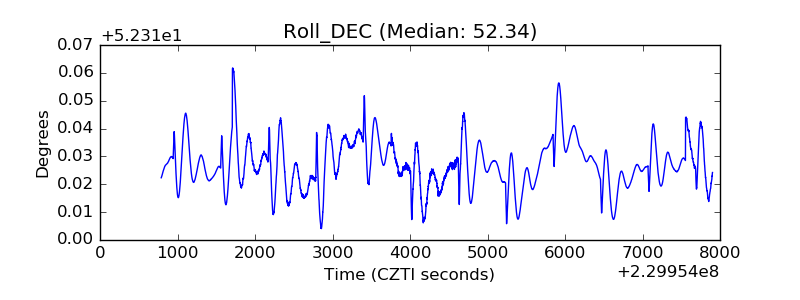 |
| _Roll_RA | 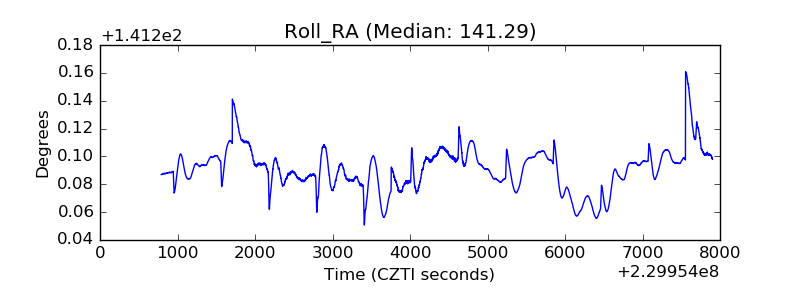 |
| Veto Counter | 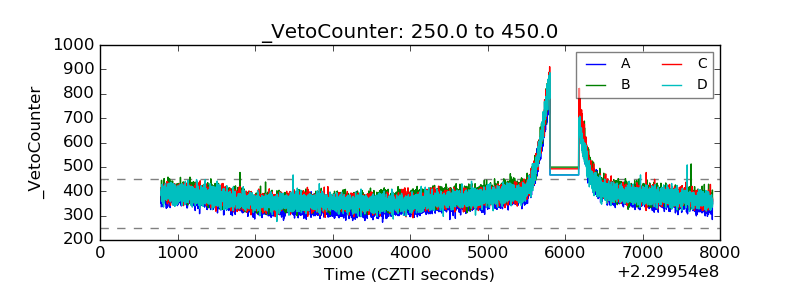 |