| Param | Original file | Final file |
|---|---|---|
| Filename | modeM0/AS1A03_036T01_9000001164_08370cztM0_level2.evt | modeM0/AS1A03_036T01_9000001164_08370cztM0_level2_quad_clean.evt |
| Size (bytes) | 536,227,200 | 106,038,720 |
| Size | 511.4 MB | 101.1 MB |
| Events in quadrant A | 4,435,604 | 656,355 |
| Events in quadrant B | 3,715,793 | 701,074 |
| Events in quadrant C | 3,579,370 | 678,667 |
| Events in quadrant D | 3,998,448 | 652,000 |
| Mode SS | |||
|---|---|---|---|
| Quadrant | BADHDUFLAG | Total packets | Discarded packets |
| A | 0 | 152 | 0 |
| B | 0 | 152 | 0 |
| C | 0 | 152 | 0 |
| D | 0 | 152 | 0 |
| Mode M0 | |||
|---|---|---|---|
| Quadrant | BADHDUFLAG | Total packets | Discarded packets |
| A | 0 | 18429 | 2 |
| B | 0 | 15982 | 1 |
| C | 0 | 16011 | 1 |
| D | 0 | 17083 | 1 |
| Mode M9 | |||
|---|---|---|---|
| Quadrant | BADHDUFLAG | Total packets | Discarded packets |
| A | 0 | 1 | 0 |
| B | 0 | 1 | 0 |
| C | 0 | 1 | 0 |
| D | 0 | 1 | 0 |
| Quadrant | Total seconds | Saturated seconds | Saturation percentage |
|---|---|---|---|
| A | 7518 | 521 | 6.930035% |
| B | 7518 | 101 | 1.343442% |
| C | 7518 | 94 | 1.250333% |
| D | 7518 | 150 | 1.995211% |
Noise dominated data is calculated using 1-second bins in cleaned event files. If a bin has >2000 counts, and if more than 50% of those come from <1% of pixels, then it is considered to be noise-dominated and hence unusable.
| Quadrant | # 1 sec bins | Bins with >0 counts | Bins with >2000 counts | High rate bins dominated by noise | Noise dominated (total time) | Noise dominated (detector-on time) | Marked lightcurve |
|---|---|---|---|---|---|---|---|
| A | 7568 | 7520 | 394 | 394 | 5.21% | 5.24% | 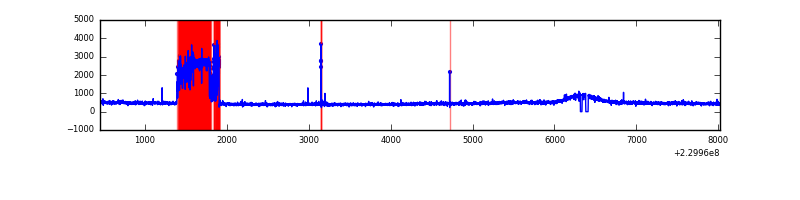 |
| B | 7568 | 7520 | 2 | 2 | 0.03% | 0.03% | 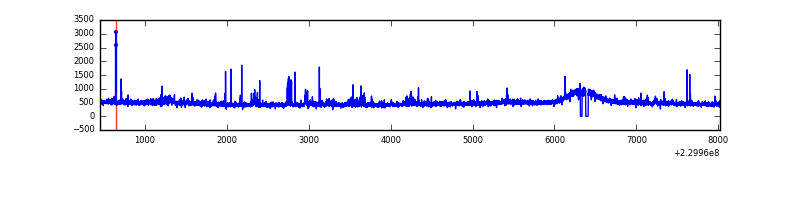 |
| C | 7568 | 7520 | 25 | 25 | 0.33% | 0.33% | 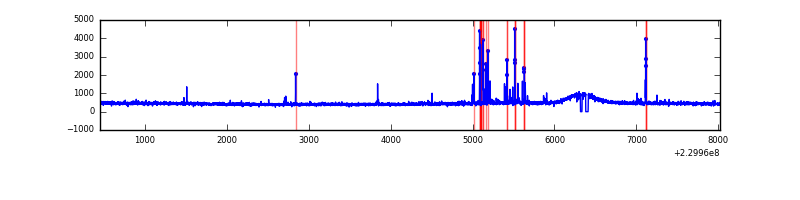 |
| D | 7568 | 7520 | 61 | 61 | 0.81% | 0.81% | 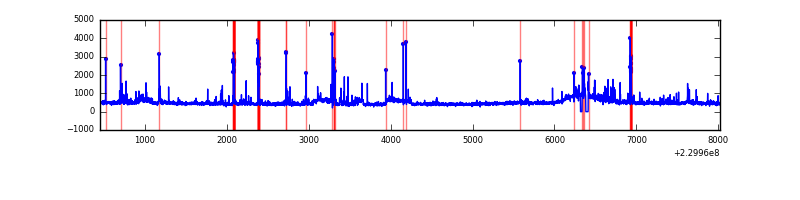 |
Top three noisy pixels from each quadrant. If the there are fewer than three noisy pixels in the level2.evt file, extra rows are filled as -1
| Pixel properties | Quadrant properties | ||||||
|---|---|---|---|---|---|---|---|
| Quadrant | DetID | PixID | Counts | Sigma | Mean | Median | Sigma |
| A | 15 | 236 | 1041059 | 5821.24 | 875 | 854 | 178.7 |
| A | 5 | 16 | 21999 | 118.33 | 875 | 854 | 178.7 |
| A | 0 | 226 | 8304 | 41.69 | 875 | 854 | 178.7 |
| B | 0 | 214 | 71234 | 404.61 | 901 | 877 | 173.9 |
| B | 4 | 81 | 44540 | 251.1 | 901 | 877 | 173.9 |
| B | 0 | 230 | 30920 | 172.77 | 901 | 877 | 173.9 |
| C | 1 | 16 | 177284 | 862.3 | 872 | 872 | 204.6 |
| C | 13 | 61 | 6678 | 28.38 | 872 | 872 | 204.6 |
| C | 3 | 202 | 2258 | 6.77 | 872 | 872 | 204.6 |
| D | 1 | 52 | 178545 | 772.85 | 867 | 843 | 229.9 |
| D | 7 | 71 | 119468 | 515.91 | 867 | 843 | 229.9 |
| D | 2 | 14 | 117318 | 506.56 | 867 | 843 | 229.9 |
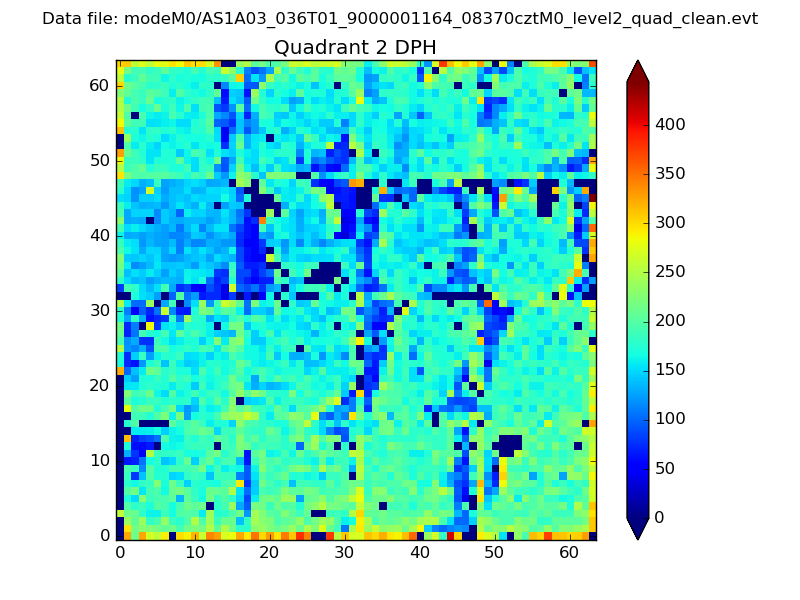
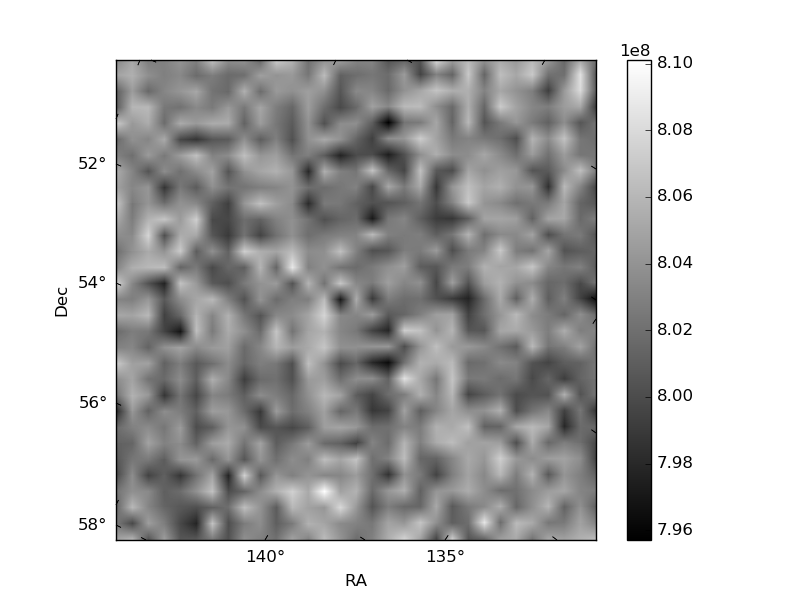
Histogram calculated using DETX and DETY for each event in the final _common_clean file
| Quadrant A | 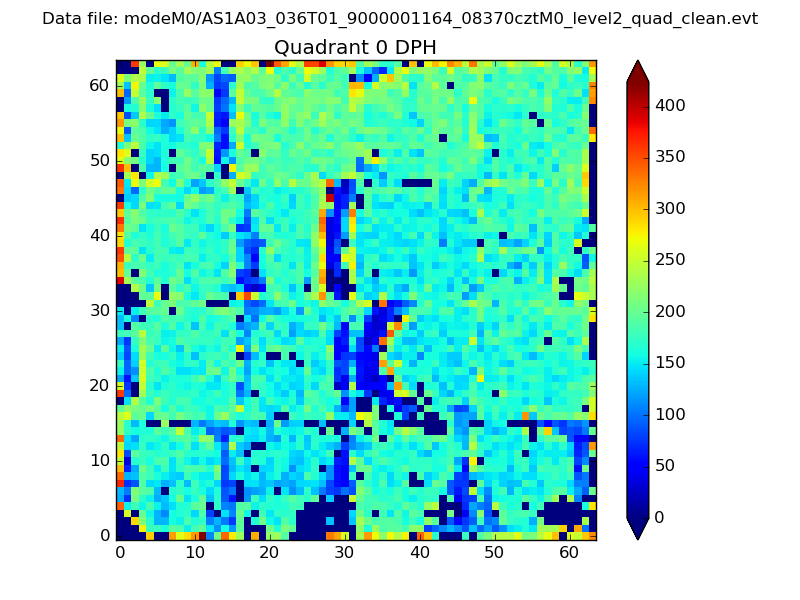 |
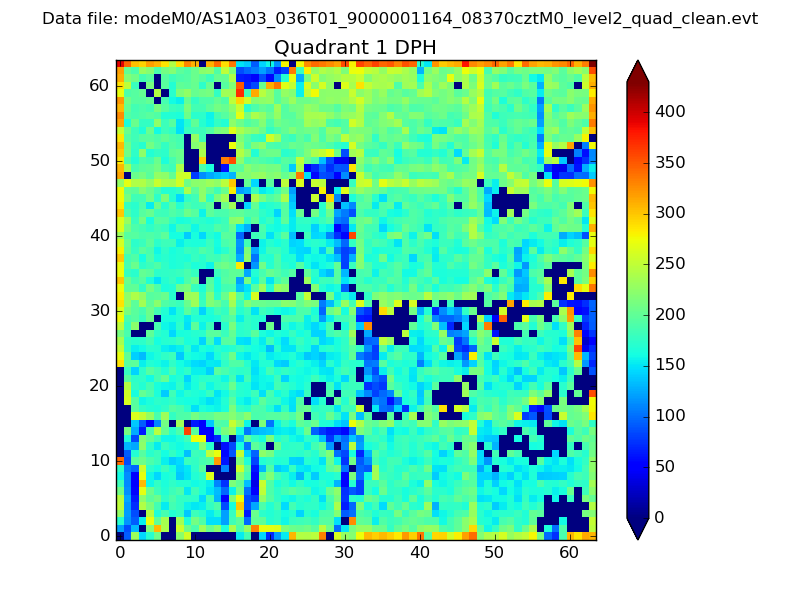 |
Quadrant B |
|---|---|---|---|
| Quadrant D | 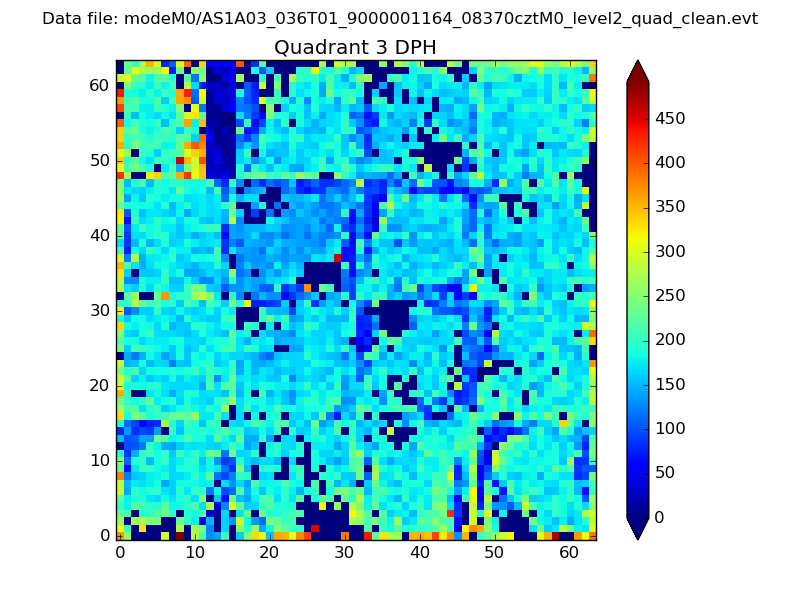 |
 |
Quadrant C |
| Plot type | Count rate plots | Images |
|---|---|---|
| Comparison with Poisson distribution Blue bars denote a histogram of data divided into 1 sec bins. Red curve is a Poisson curve with rate = median count rate of data. |
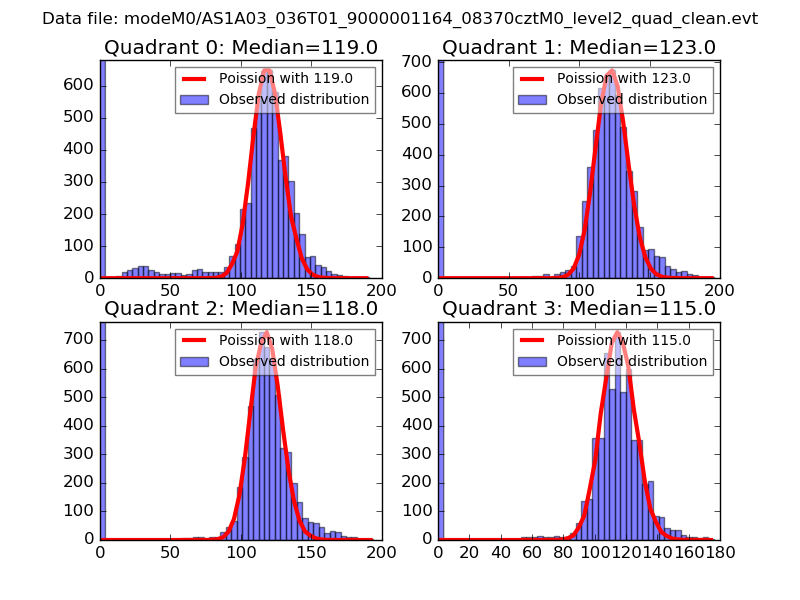 |
 |
| Quadrant-wise count rates Data is divided into 100 sec bins |
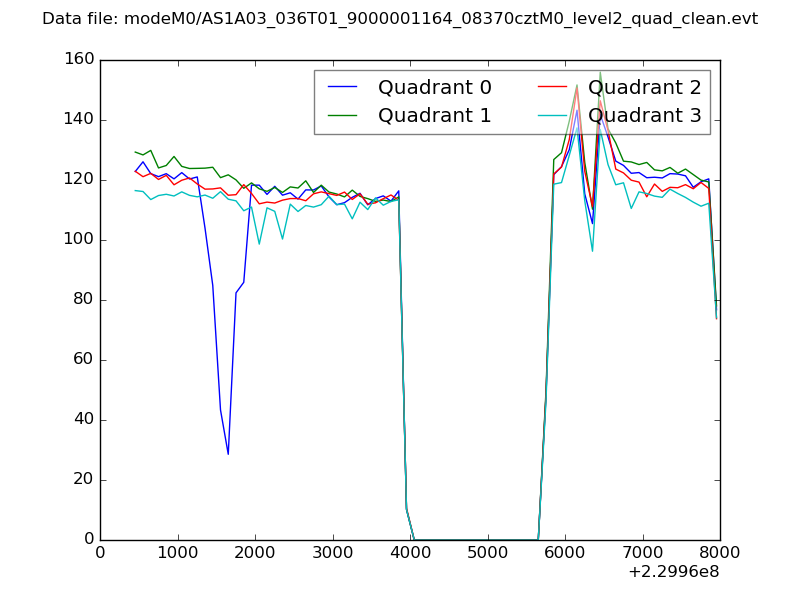 |
|
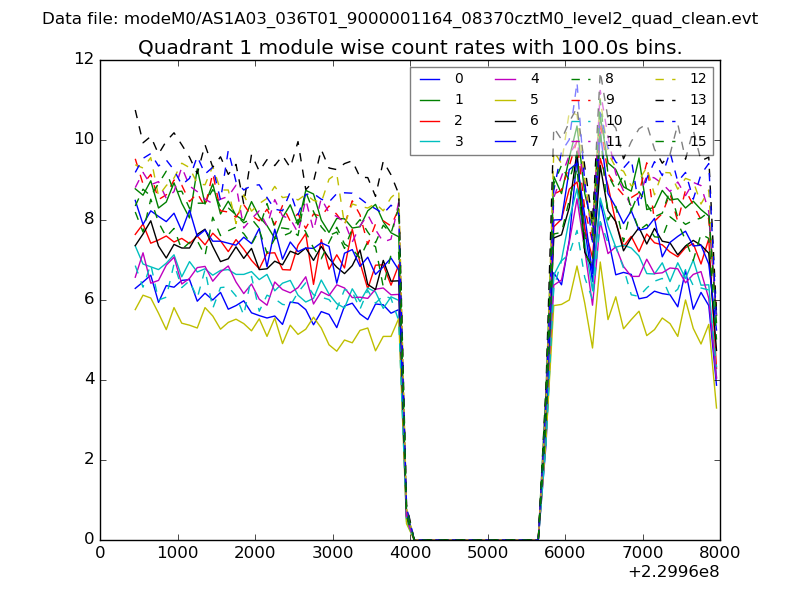
| Module-wise count rates for Quadrant A Data is divided into 100 sec bins |
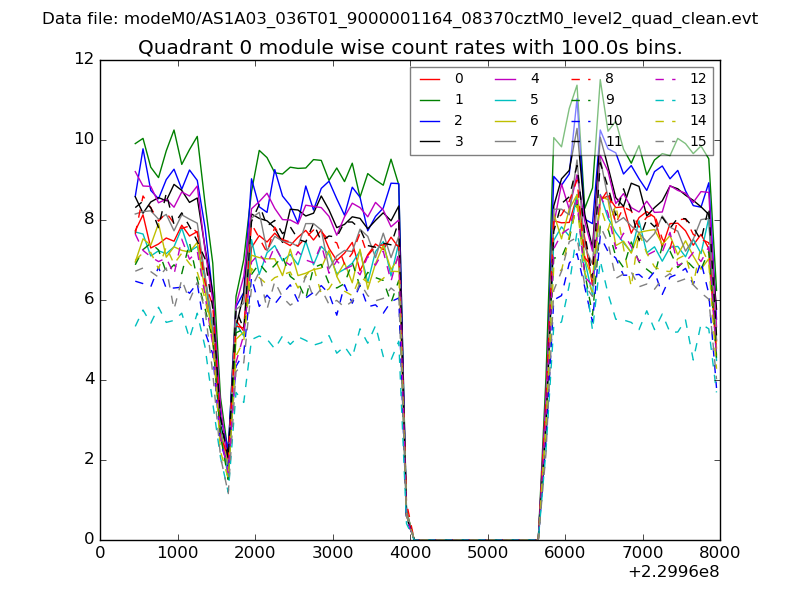 |
 |
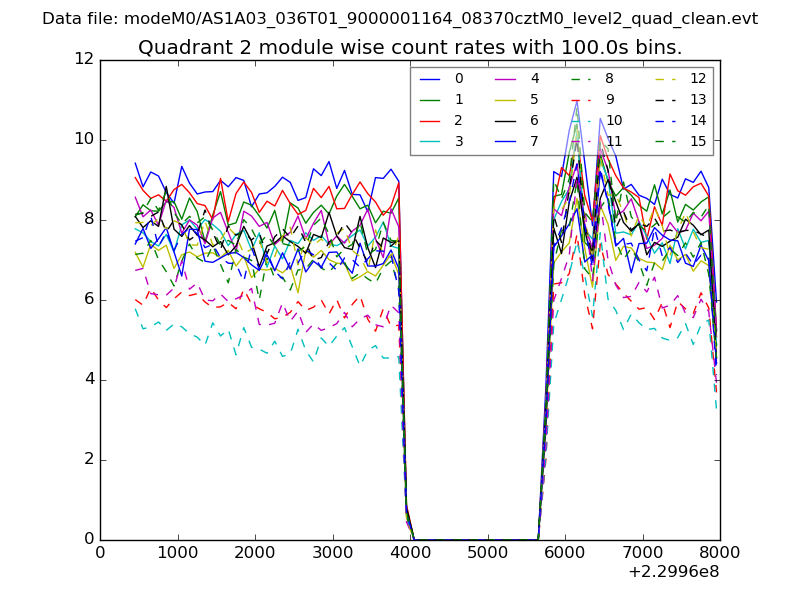
| Module-wise count rates for Quadrant B Data is divided into 100 sec bins |
 |
 |
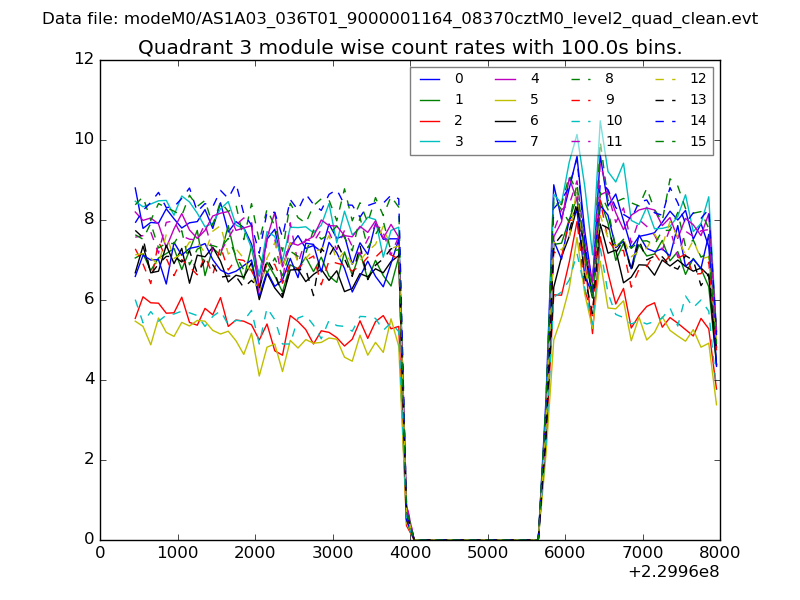
| Module-wise count rates for Quadrant C Data is divided into 100 sec bins |
 |
 |
| Module-wise count rates for Quadrant D Data is divided into 100 sec bins |
 |
 |
| Parameter | Plot |
|---|---|
| CZT HV Monitor | 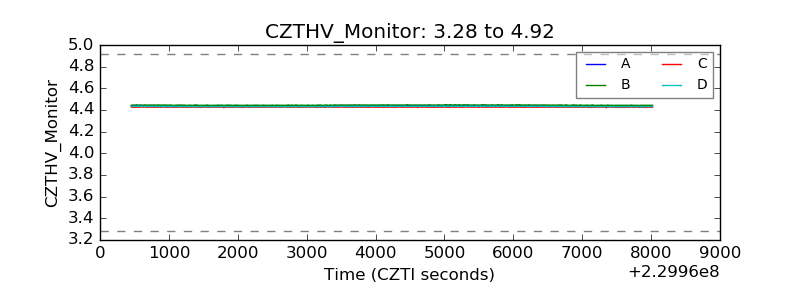 |
| D_VDD |  |
| Temperature 1 | 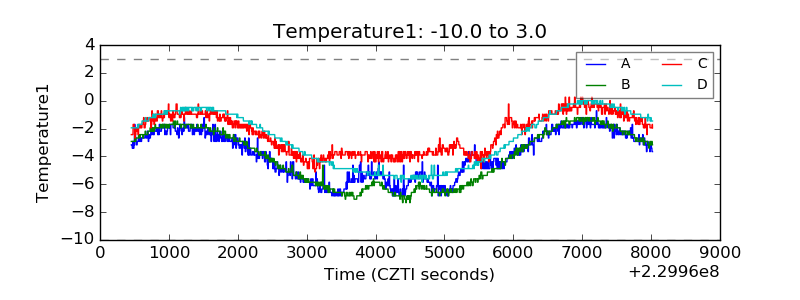 |
| Veto HV Monitor | 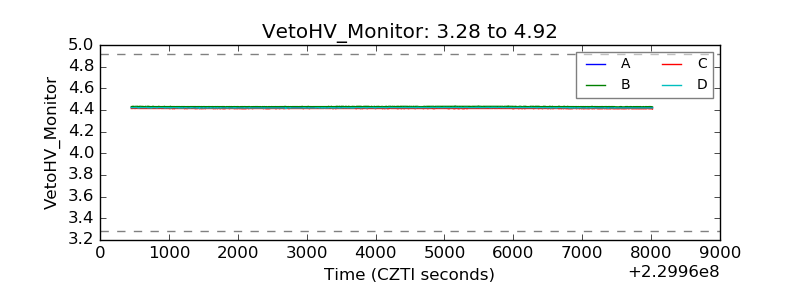 |
| Veto LLD | 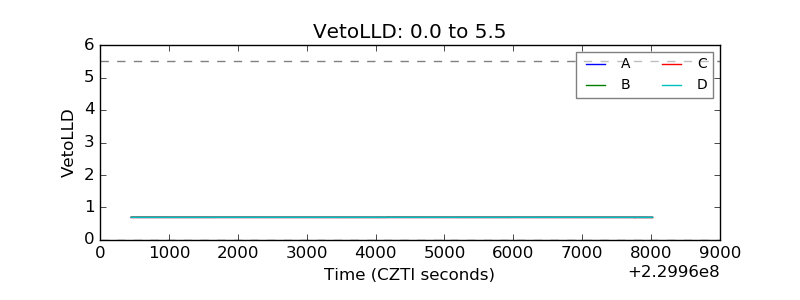 |
| Alpha Counter | 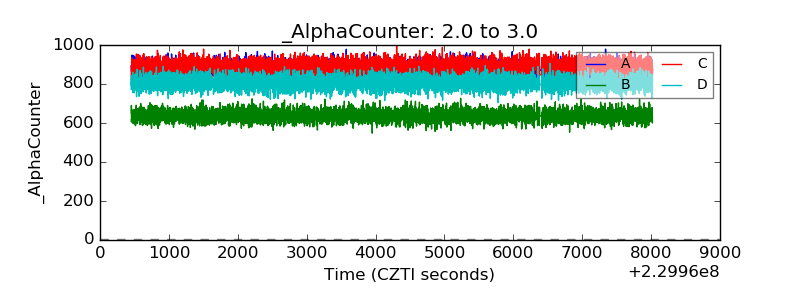 |
| _CPM_Rate | 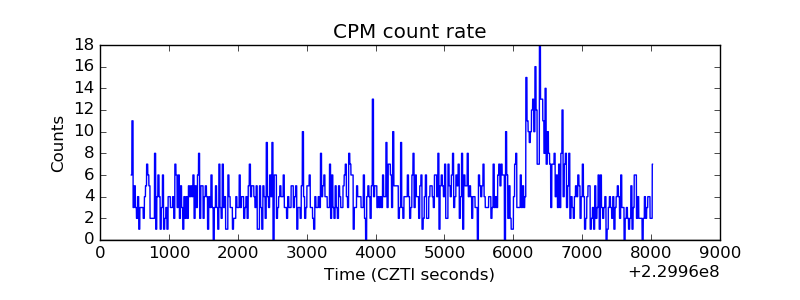 |
| CZT Counter | 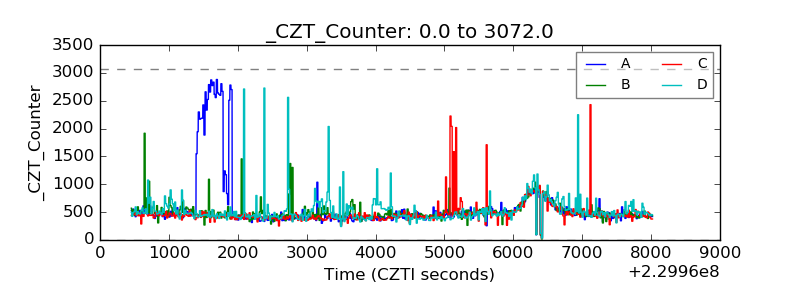 |
| +2.5 Volts monitor |  |
| +5 Volts monitor |  |
| _ROLL_ROT | 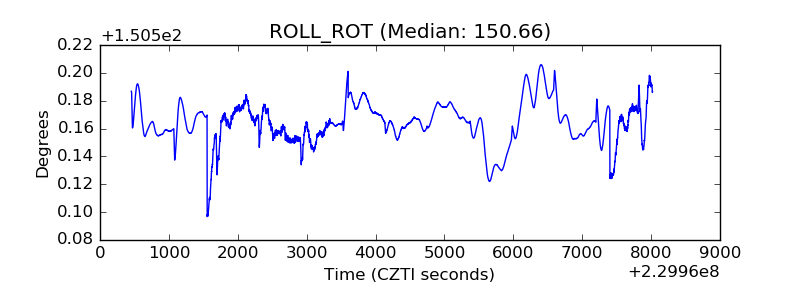 |
| _Roll_DEC | 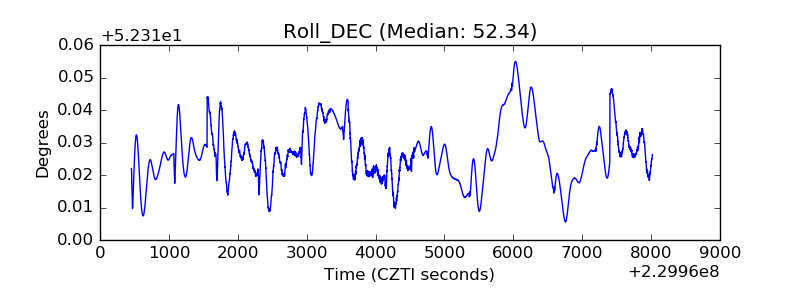 |
| _Roll_RA |  |
| Veto Counter | 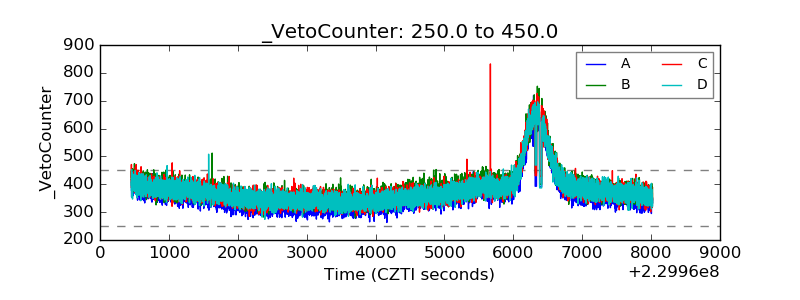 |