| Param | Original file | Final file |
|---|---|---|
| Filename | modeM0/AS1A03_036T01_9000001164_08371cztM0_level2.evt | modeM0/AS1A03_036T01_9000001164_08371cztM0_level2_quad_clean.evt |
| Size (bytes) | 466,879,680 | 101,920,320 |
| Size | 445.3 MB | 97.2 MB |
| Events in quadrant A | 3,271,280 | 651,753 |
| Events in quadrant B | 3,471,834 | 664,579 |
| Events in quadrant C | 3,321,850 | 643,925 |
| Events in quadrant D | 3,580,775 | 620,691 |
| Mode SS | |||
|---|---|---|---|
| Quadrant | BADHDUFLAG | Total packets | Discarded packets |
| A | 0 | 146 | 0 |
| B | 0 | 146 | 0 |
| C | 0 | 146 | 0 |
| D | 0 | 146 | 0 |
| Mode M0 | |||
|---|---|---|---|
| Quadrant | BADHDUFLAG | Total packets | Discarded packets |
| A | 0 | 14899 | 2 |
| B | 0 | 15212 | 1 |
| C | 0 | 15090 | 1 |
| D | 0 | 15581 | 1 |
| Mode M9 | |||
|---|---|---|---|
| Quadrant | BADHDUFLAG | Total packets | Discarded packets |
| A | 0 | 2 | 0 |
| B | 0 | 2 | 0 |
| C | 0 | 2 | 0 |
| D | 0 | 2 | 0 |
| Quadrant | Total seconds | Saturated seconds | Saturation percentage |
|---|---|---|---|
| A | 7268 | 57 | 0.784260% |
| B | 7268 | 62 | 0.853054% |
| C | 7268 | 44 | 0.605394% |
| D | 7268 | 73 | 1.004403% |
Noise dominated data is calculated using 1-second bins in cleaned event files. If a bin has >2000 counts, and if more than 50% of those come from <1% of pixels, then it is considered to be noise-dominated and hence unusable.
| Quadrant | # 1 sec bins | Bins with >0 counts | Bins with >2000 counts | High rate bins dominated by noise | Noise dominated (total time) | Noise dominated (detector-on time) | Marked lightcurve |
|---|---|---|---|---|---|---|---|
| A | 7453 | 7269 | 0 | 0 | 0.00% | 0.00% | 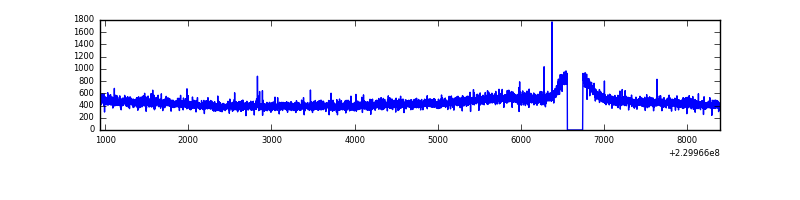 |
| B | 7453 | 7269 | 1 | 1 | 0.01% | 0.01% | 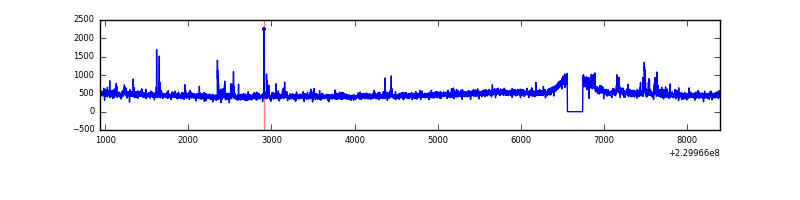 |
| C | 7453 | 7269 | 8 | 8 | 0.11% | 0.11% | 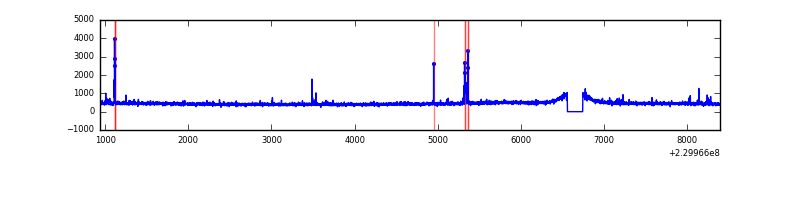 |
| D | 7453 | 7269 | 21 | 21 | 0.28% | 0.29% | 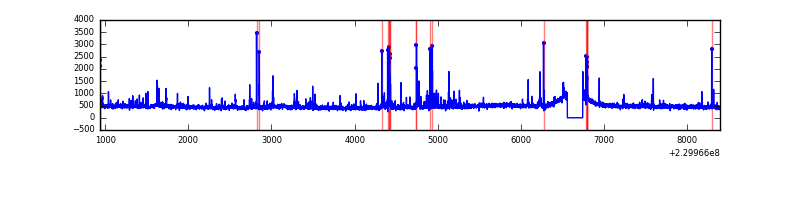 |
Top three noisy pixels from each quadrant. If the there are fewer than three noisy pixels in the level2.evt file, extra rows are filled as -1
| Pixel properties | Quadrant properties | ||||||
|---|---|---|---|---|---|---|---|
| Quadrant | DetID | PixID | Counts | Sigma | Mean | Median | Sigma |
| A | 0 | 226 | 8039 | 41.27 | 847 | 826 | 174.8 |
| A | 12 | 194 | 7583 | 38.66 | 847 | 826 | 174.8 |
| A | 14 | 111 | 7231 | 36.65 | 847 | 826 | 174.8 |
| B | 0 | 214 | 65343 | 393.48 | 853 | 831 | 164.0 |
| B | 10 | 16 | 20845 | 122.07 | 853 | 831 | 164.0 |
| B | 4 | 81 | 20014 | 117.0 | 853 | 831 | 164.0 |
| C | 1 | 16 | 93202 | 482.35 | 826 | 830 | 191.5 |
| C | 13 | 61 | 6393 | 29.05 | 826 | 830 | 191.5 |
| C | 12 | 4 | 6263 | 28.37 | 826 | 830 | 191.5 |
| D | 8 | 195 | 108251 | 526.98 | 828 | 801 | 203.9 |
| D | 1 | 52 | 90735 | 441.07 | 828 | 801 | 203.9 |
| D | 7 | 71 | 77599 | 376.65 | 828 | 801 | 203.9 |
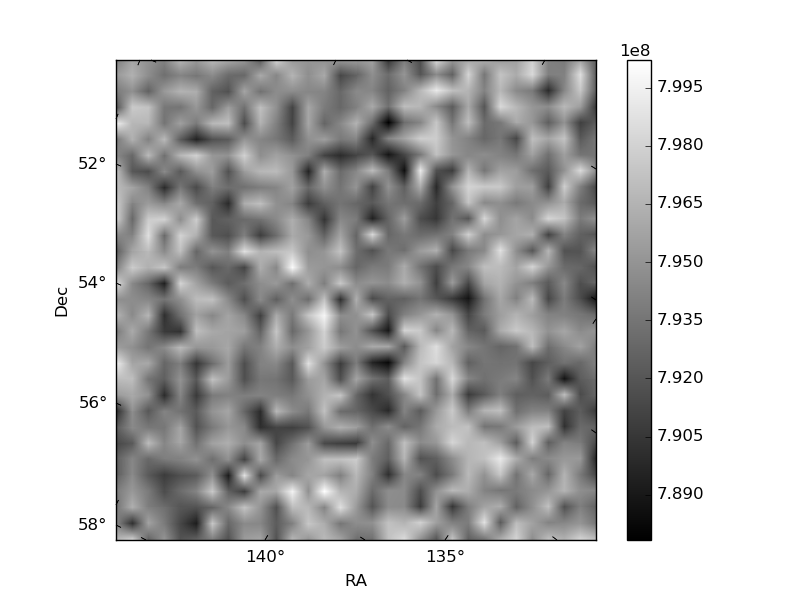
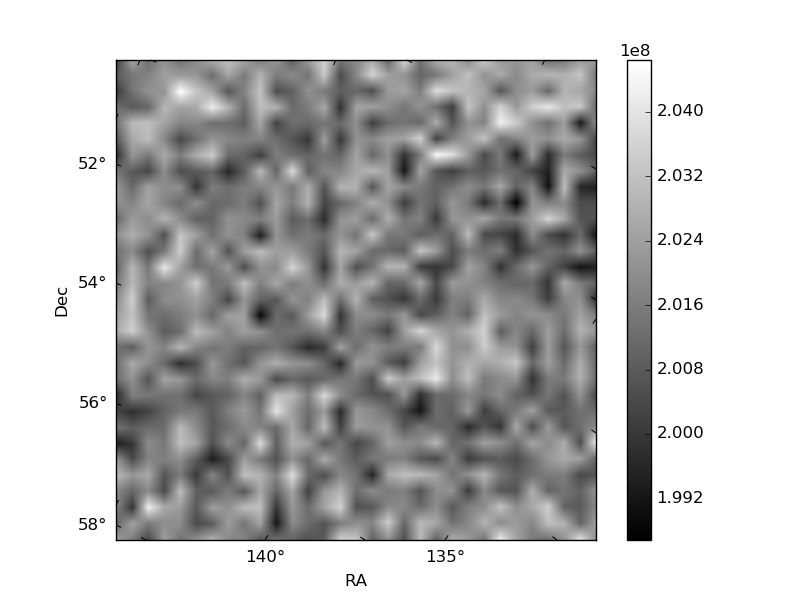
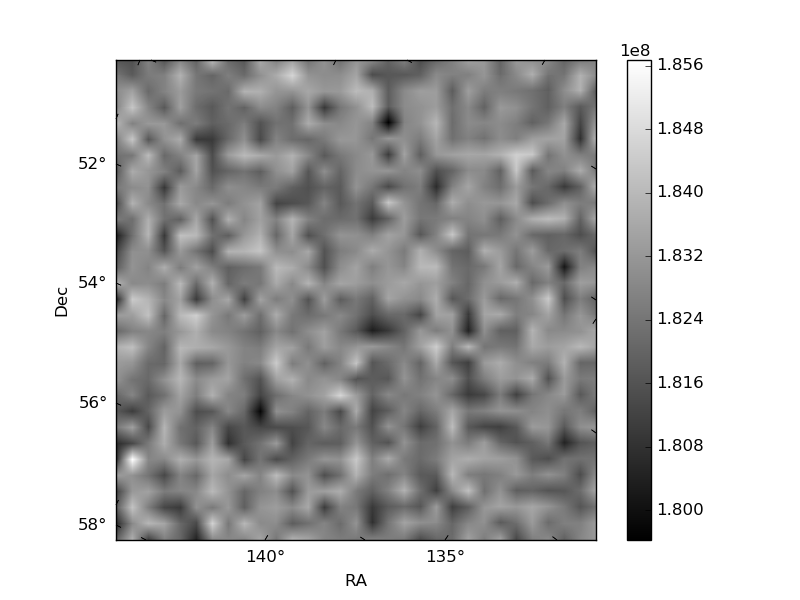
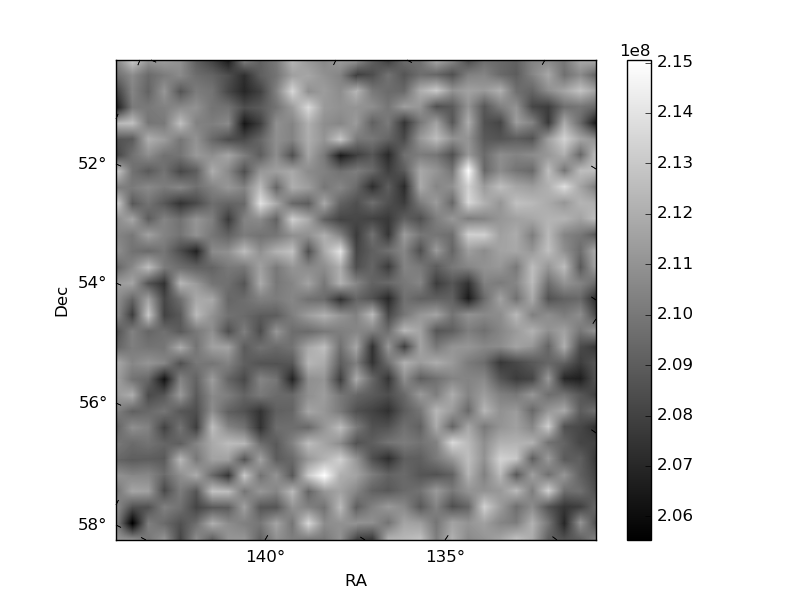
Histogram calculated using DETX and DETY for each event in the final _common_clean file
| Quadrant A | 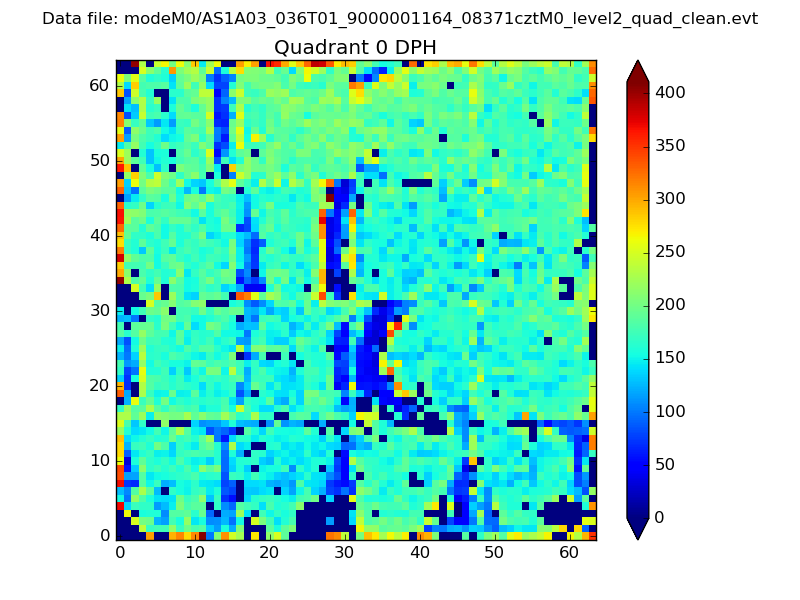 |
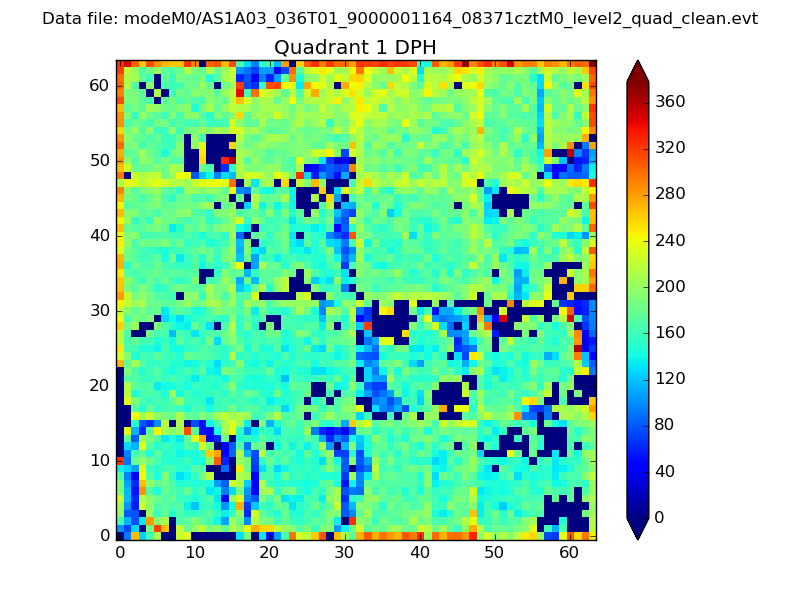 |
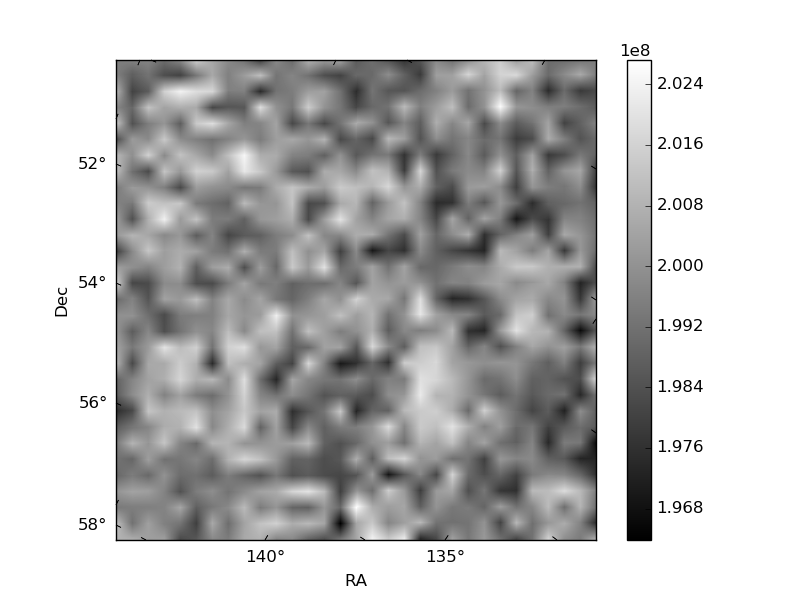
Quadrant B |
|---|---|---|---|
| Quadrant D | 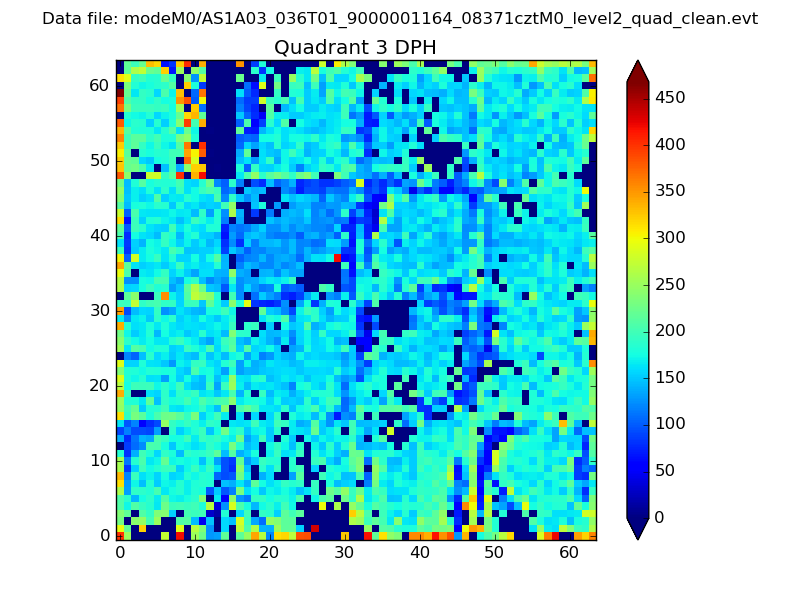 |
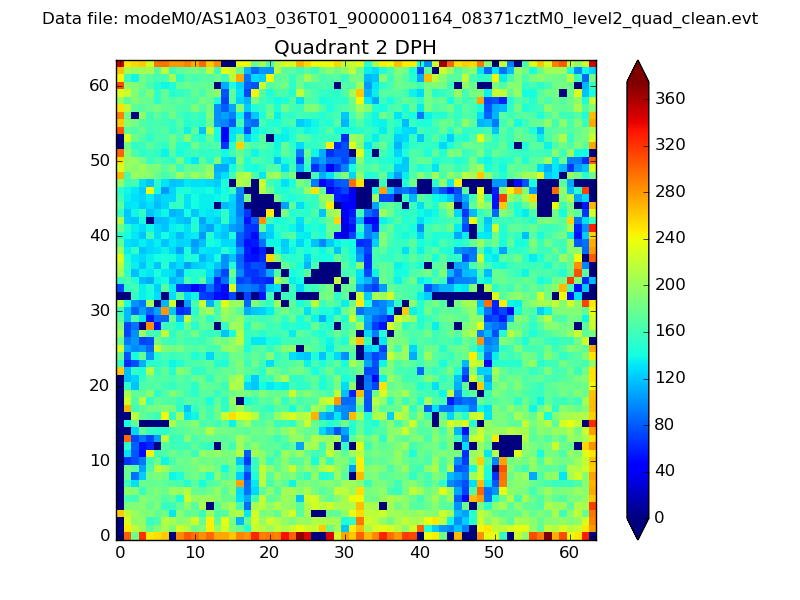 |
Quadrant C |
| Plot type | Count rate plots | Images |
|---|---|---|
| Comparison with Poisson distribution Blue bars denote a histogram of data divided into 1 sec bins. Red curve is a Poisson curve with rate = median count rate of data. |
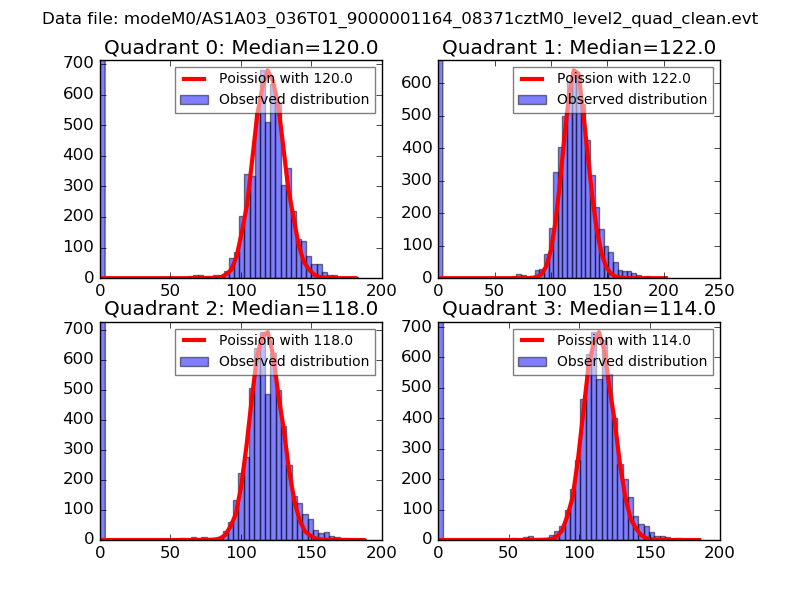 |
 |
| Quadrant-wise count rates Data is divided into 100 sec bins |
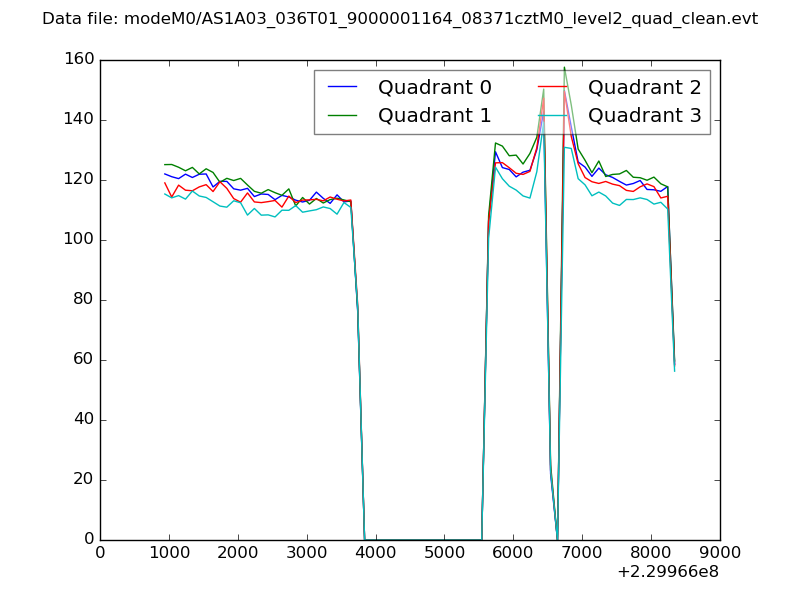 |
|
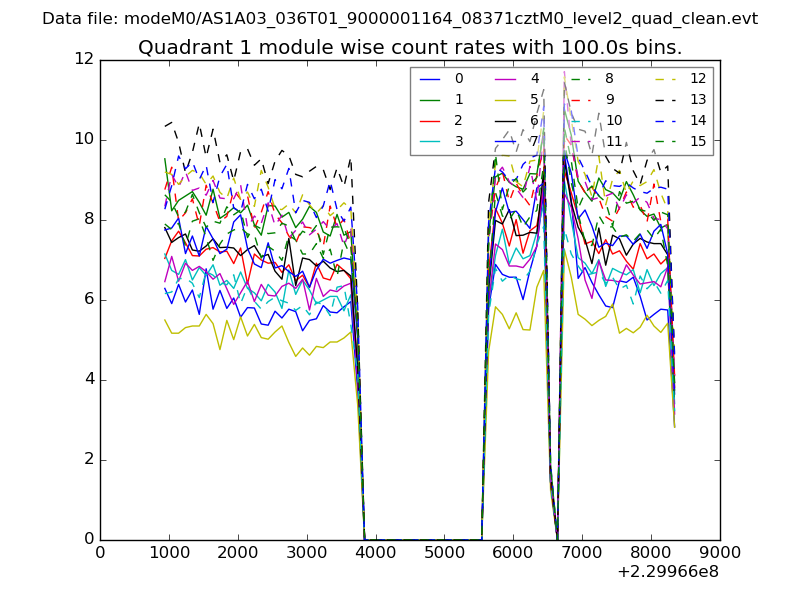
| Module-wise count rates for Quadrant A Data is divided into 100 sec bins |
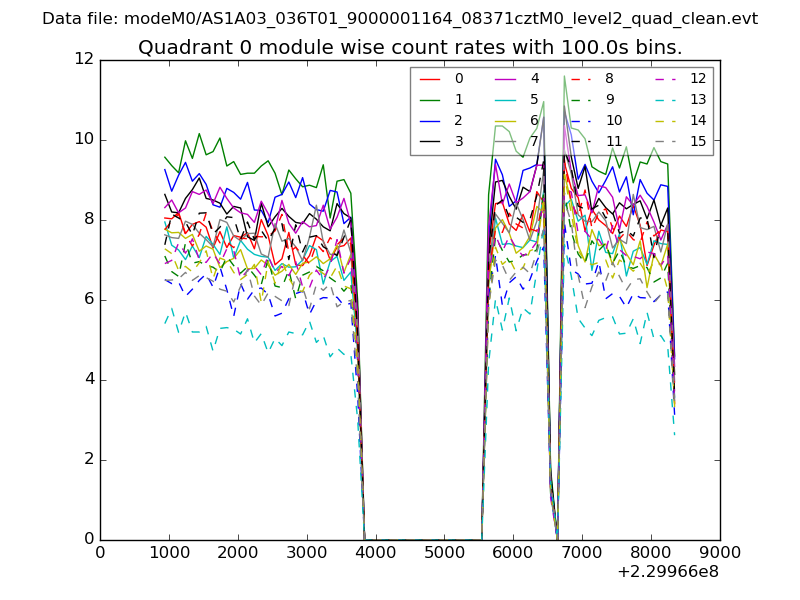 |
 |
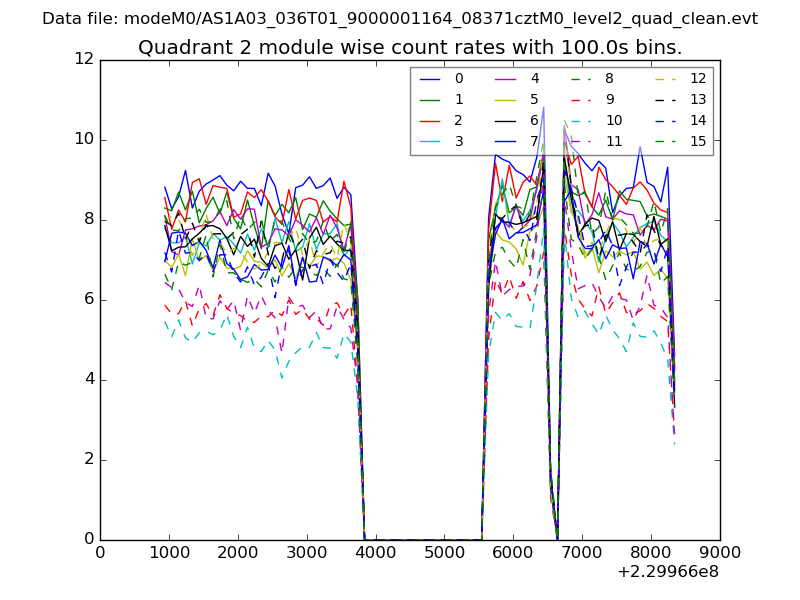
| Module-wise count rates for Quadrant B Data is divided into 100 sec bins |
 |
 |
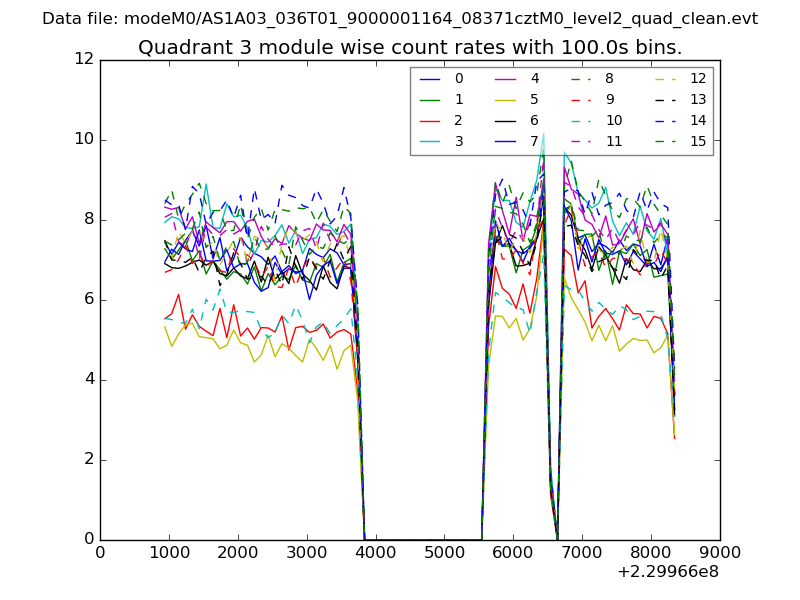
| Module-wise count rates for Quadrant C Data is divided into 100 sec bins |
 |
 |
| Module-wise count rates for Quadrant D Data is divided into 100 sec bins |
 |
 |
| Parameter | Plot |
|---|---|
| CZT HV Monitor | 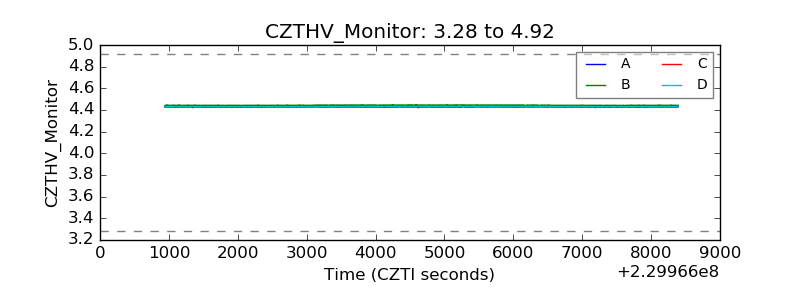 |
| D_VDD | 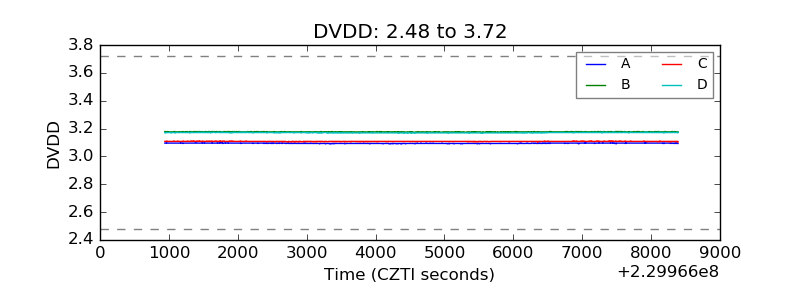 |
| Temperature 1 | 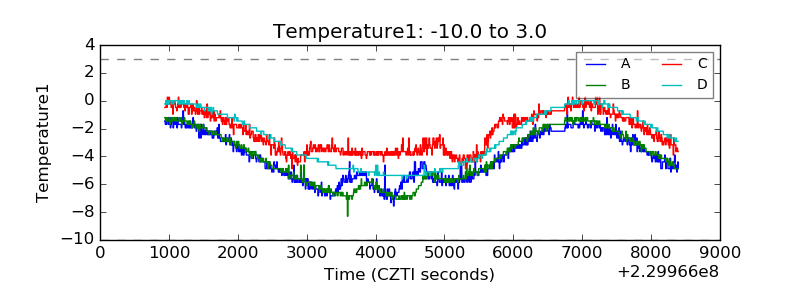 |
| Veto HV Monitor | 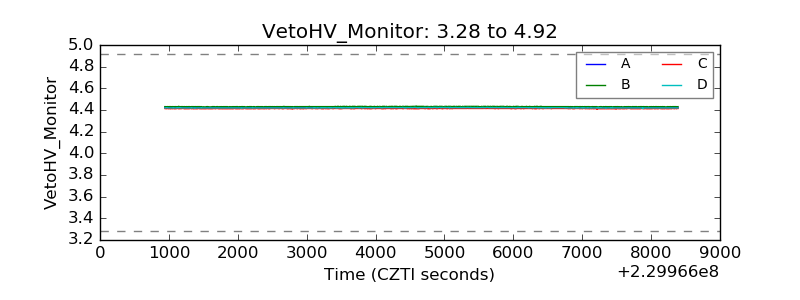 |
| Veto LLD | 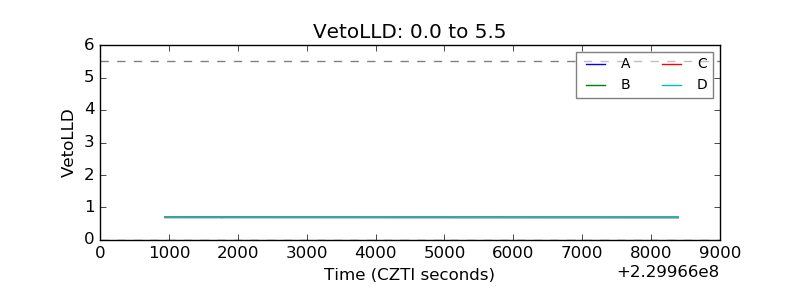 |
| Alpha Counter | 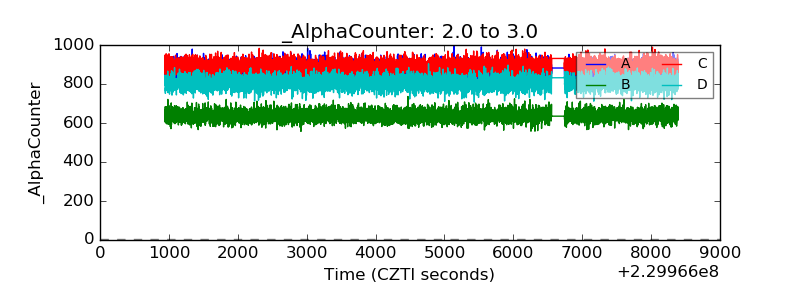 |
| _CPM_Rate | 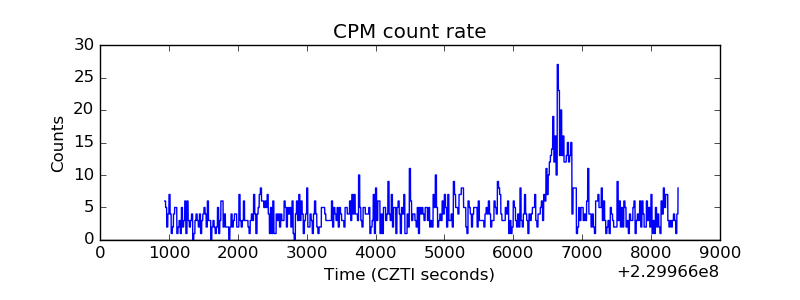 |
| CZT Counter | 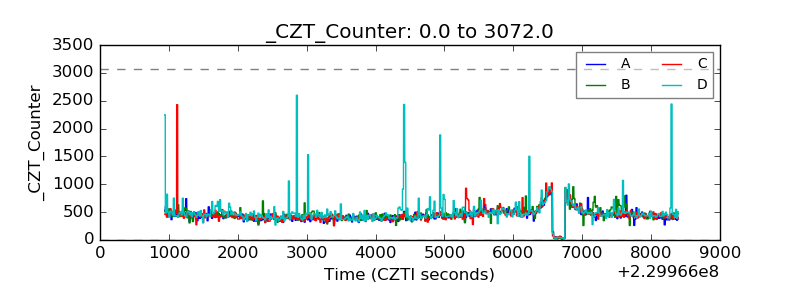 |
| +2.5 Volts monitor |  |
| +5 Volts monitor |  |
| _ROLL_ROT | 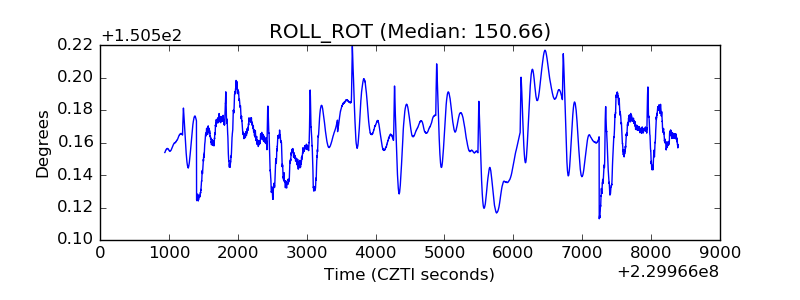 |
| _Roll_DEC | 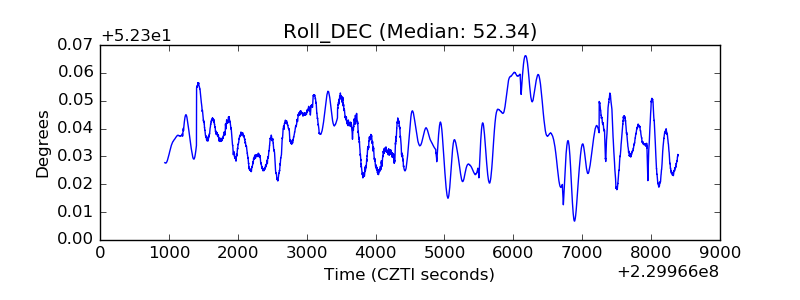 |
| _Roll_RA | 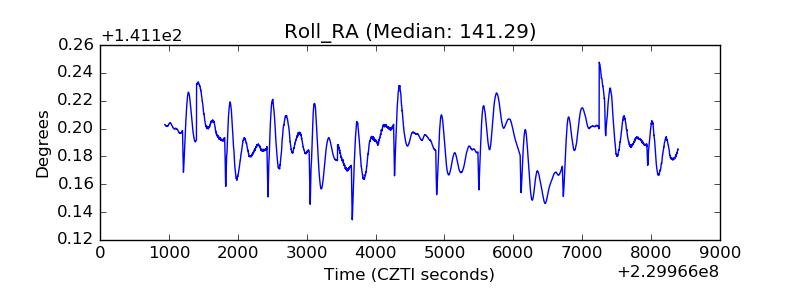 |
| Veto Counter | 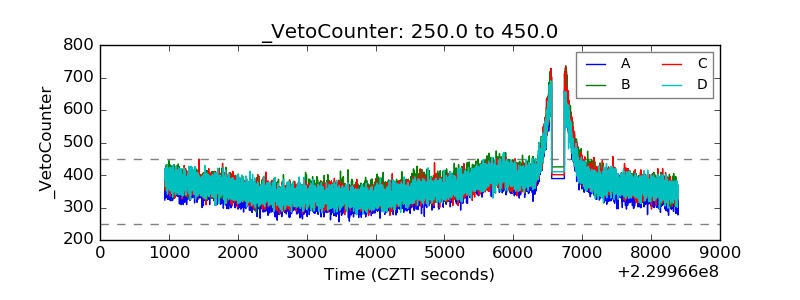 |