| Param | Original file | Final file |
|---|---|---|
| Filename | modeM0/AS1G07_028T01_9000001166cztM0_level2.fits | modeM0/AS1G07_028T01_9000001166cztM0_level2_quad_clean.evt |
| Size (bytes) | 156,628,800 | 174,931,200 |
| Size | 149.4 MB | 166.8 MB |
| Events in quadrant A | 944,048 | 1,088,206 |
| Events in quadrant B | 882,868 | 1,022,110 |
| Events in quadrant C | 928,274 | 1,050,420 |
| Events in quadrant D | 804,412 | 952,900 |
| Mode M0 | |||
|---|---|---|---|
| Quadrant | BADHDUFLAG | Total packets | Discarded packets |
| A | 0 | 34904 | 0 |
| B | 0 | 41695 | 0 |
| C | 0 | 34922 | 0 |
| D | 0 | 37911 | 0 |
| Mode SS | |||
|---|---|---|---|
| Quadrant | BADHDUFLAG | Total packets | Discarded packets |
| A | 0 | 350 | 0 |
| B | 0 | 350 | 0 |
| C | 0 | 350 | 0 |
| D | 0 | 350 | 0 |
| Mode M9 | |||
|---|---|---|---|
| Quadrant | BADHDUFLAG | Total packets | Discarded packets |
| A | 0 | 24 | 0 |
| B | 0 | 24 | 0 |
| C | 0 | 24 | 0 |
| D | 0 | 24 | 0 |
| Quadrant | Total seconds | Saturated seconds | Saturation percentage |
|---|---|---|---|
| A | 17168 | 52 | 0.302889% |
| B | 17167 | 722 | 4.205744% |
| C | 17169 | 40 | 0.232978% |
| D | 17168 | 216 | 1.258155% |
Noise dominated data is calculated using 1-second bins in cleaned event files. If a bin has >2000 counts, and if more than 50% of those come from <1% of pixels, then it is considered to be noise-dominated and hence unusable.
| Quadrant | # 1 sec bins | Bins with >0 counts | Bins with >2000 counts | High rate bins dominated by noise | Noise dominated (total time) | Noise dominated (detector-on time) | Marked lightcurve |
|---|---|---|---|---|---|---|---|
| A | 19577 | 17172 | 0 | 0 | 0.00% | 0.00% |  |
| B | 19577 | 17152 | 0 | 0 | 0.00% | 0.00% |  |
| C | 19577 | 17172 | 0 | 0 | 0.00% | 0.00% |  |
| D | 19577 | 17172 | 0 | 0 | 0.00% | 0.00% |  |
Top three noisy pixels from each quadrant. If the there are fewer than three noisy pixels in the level2.evt file, extra rows are filled as -1
| Pixel properties | Quadrant properties | ||||||
|---|---|---|---|---|---|---|---|
| Quadrant | DetID | PixID | Counts | Sigma | Mean | Median | Sigma |
| A | 14 | 188 | 909 | 10.75 | 245 | 229 | 63.3 |
| A | 0 | 29 | 891 | 10.46 | 245 | 229 | 63.3 |
| A | 14 | 204 | 810 | 9.18 | 245 | 229 | 63.3 |
| B | 2 | 9 | 772 | 11.13 | 233 | 221 | 49.5 |
| B | 14 | 254 | 607 | 7.8 | 233 | 221 | 49.5 |
| B | 12 | 226 | 601 | 7.68 | 233 | 221 | 49.5 |
| C | 12 | 241 | 672 | 6.64 | 245 | 226 | 67.2 |
| C | 2 | 191 | 624 | 5.92 | 245 | 226 | 67.2 |
| C | 4 | 254 | 614 | 5.77 | 245 | 226 | 67.2 |
| D | 10 | 189 | 582 | 5.98 | 228 | 207 | 62.7 |
| D | 6 | 231 | 577 | 5.9 | 228 | 207 | 62.7 |
| D | 1 | 19 | 573 | 5.84 | 228 | 207 | 62.7 |
Histogram calculated using DETX and DETY for each event in the final _common_clean file
| Quadrant A | 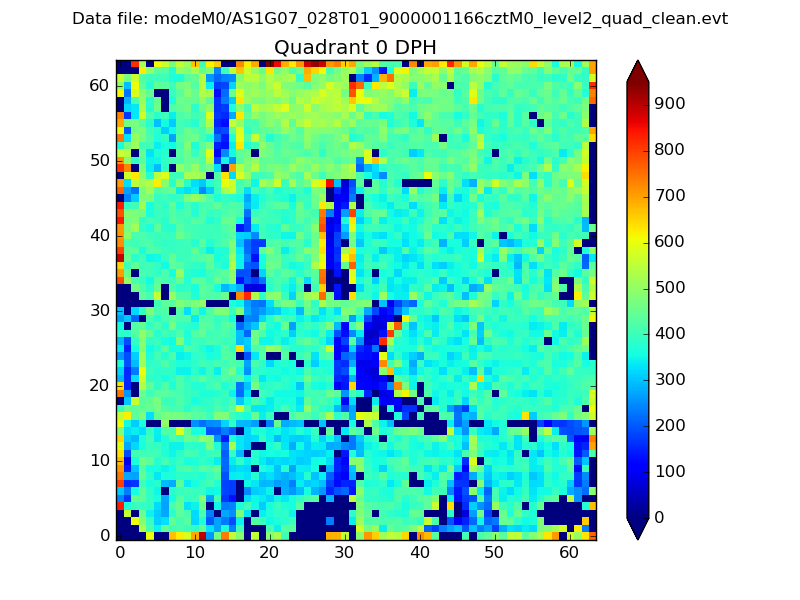 |
 |
Quadrant B |
|---|---|---|---|
| Quadrant D |  |
 |
Quadrant C |
| Plot type | Count rate plots | Images |
|---|---|---|
| Comparison with Poisson distribution Blue bars denote a histogram of data divided into 1 sec bins. Red curve is a Poisson curve with rate = median count rate of data. |
 |
 |
| Quadrant-wise count rates Data is divided into 100 sec bins |
 |
|
| Module-wise count rates for Quadrant A Data is divided into 100 sec bins |
 |
 |
| Module-wise count rates for Quadrant B Data is divided into 100 sec bins |
 |
 |
| Module-wise count rates for Quadrant C Data is divided into 100 sec bins |
 |
 |
| Module-wise count rates for Quadrant D Data is divided into 100 sec bins |
 |
 |
| Parameter | Plot |
|---|---|
| CZT HV Monitor |  |
| D_VDD |  |
| Temperature 1 |  |
| Veto HV Monitor |  |
| Veto LLD |  |
| Alpha Counter |  |
| _CPM_Rate |  |
| CZT Counter |  |
| +2.5 Volts monitor |  |
| +5 Volts monitor |  |
| _ROLL_ROT |  |
| _Roll_DEC |  |
| _Roll_RA |  |
| Veto Counter |  |