| Param | Original file | Final file |
|---|---|---|
| Filename | modeM0/AS1G07_028T01_9000001166_08377cztM0_level2.evt | modeM0/AS1G07_028T01_9000001166_08377cztM0_level2_quad_clean.evt |
| Size (bytes) | 239,558,400 | 62,896,320 |
| Size | 228.5 MB | 60.0 MB |
| Events in quadrant A | 1,550,982 | 419,443 |
| Events in quadrant B | 2,194,053 | 410,866 |
| Events in quadrant C | 1,570,109 | 422,197 |
| Events in quadrant D | 1,698,720 | 402,627 |
| Mode M0 | |||
|---|---|---|---|
| Quadrant | BADHDUFLAG | Total packets | Discarded packets |
| A | 0 | 7169 | 1 |
| B | 0 | 8968 | 1 |
| C | 0 | 7239 | 1 |
| D | 0 | 7603 | 1 |
| Mode SS | |||
|---|---|---|---|
| Quadrant | BADHDUFLAG | Total packets | Discarded packets |
| A | 0 | 70 | 0 |
| B | 0 | 70 | 0 |
| C | 0 | 70 | 0 |
| D | 0 | 70 | 0 |
| Mode M9 | |||
|---|---|---|---|
| Quadrant | BADHDUFLAG | Total packets | Discarded packets |
| A | 0 | 7 | 0 |
| B | 0 | 7 | 0 |
| C | 0 | 7 | 0 |
| D | 0 | 8 | 0 |
| Quadrant | Total seconds | Saturated seconds | Saturation percentage |
|---|---|---|---|
| A | 3522 | 4 | 0.113572% |
| B | 3522 | 187 | 5.309483% |
| C | 3522 | 4 | 0.113572% |
| D | 3522 | 21 | 0.596252% |
Noise dominated data is calculated using 1-second bins in cleaned event files. If a bin has >2000 counts, and if more than 50% of those come from <1% of pixels, then it is considered to be noise-dominated and hence unusable.
| Quadrant | # 1 sec bins | Bins with >0 counts | Bins with >2000 counts | High rate bins dominated by noise | Noise dominated (total time) | Noise dominated (detector-on time) | Marked lightcurve |
|---|---|---|---|---|---|---|---|
| A | 3522 | 3522 | 0 | 0 | 0.00% | 0.00% | 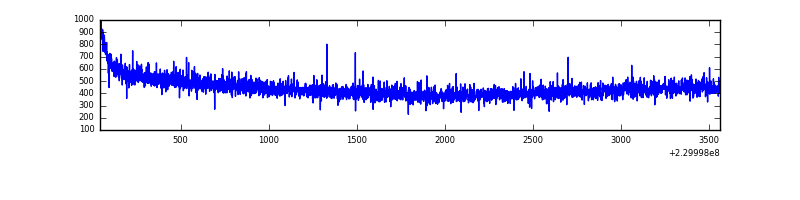 |
| B | 3522 | 3522 | 141 | 141 | 4.00% | 4.00% | 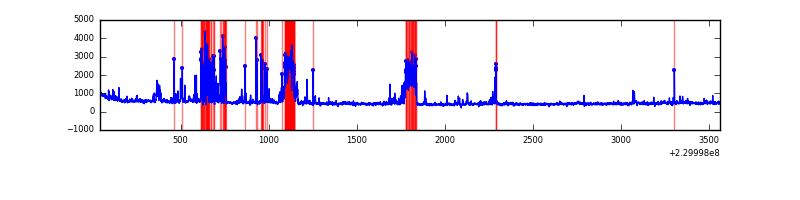 |
| C | 3522 | 3522 | 2 | 2 | 0.06% | 0.06% | 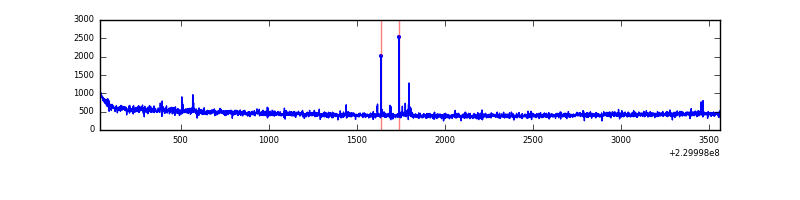 |
| D | 3522 | 3522 | 7 | 7 | 0.20% | 0.20% | 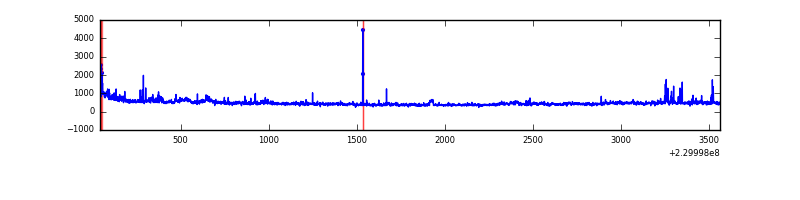 |
Top three noisy pixels from each quadrant. If the there are fewer than three noisy pixels in the level2.evt file, extra rows are filled as -1
| Pixel properties | Quadrant properties | ||||||
|---|---|---|---|---|---|---|---|
| Quadrant | DetID | PixID | Counts | Sigma | Mean | Median | Sigma |
| A | 0 | 226 | 3564 | 37.72 | 402 | 394 | 84.0 |
| A | 12 | 194 | 3523 | 37.23 | 402 | 394 | 84.0 |
| A | 13 | 14 | 2904 | 29.86 | 402 | 394 | 84.0 |
| B | 10 | 16 | 419175 | 5387.12 | 398 | 388 | 77.7 |
| B | 4 | 81 | 170762 | 2191.63 | 398 | 388 | 77.7 |
| B | 0 | 219 | 24873 | 314.97 | 398 | 388 | 77.7 |
| C | 1 | 16 | 26005 | 274.41 | 396 | 399 | 93.3 |
| C | 13 | 61 | 2963 | 27.48 | 396 | 399 | 93.3 |
| C | 8 | 208 | 1121 | 7.74 | 396 | 399 | 93.3 |
| D | 12 | 221 | 120998 | 1187.22 | 387 | 379 | 101.6 |
| D | 1 | 52 | 21111 | 204.06 | 387 | 379 | 101.6 |
| D | 2 | 14 | 18389 | 177.27 | 387 | 379 | 101.6 |
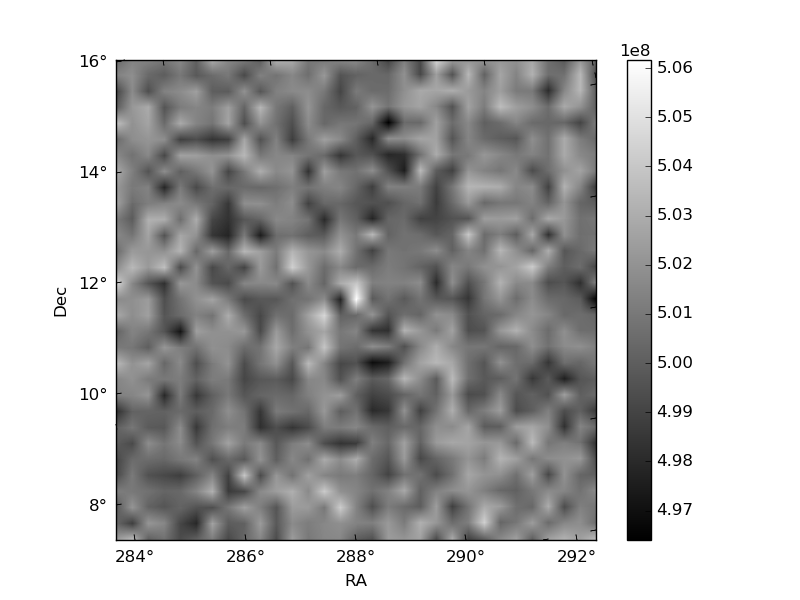
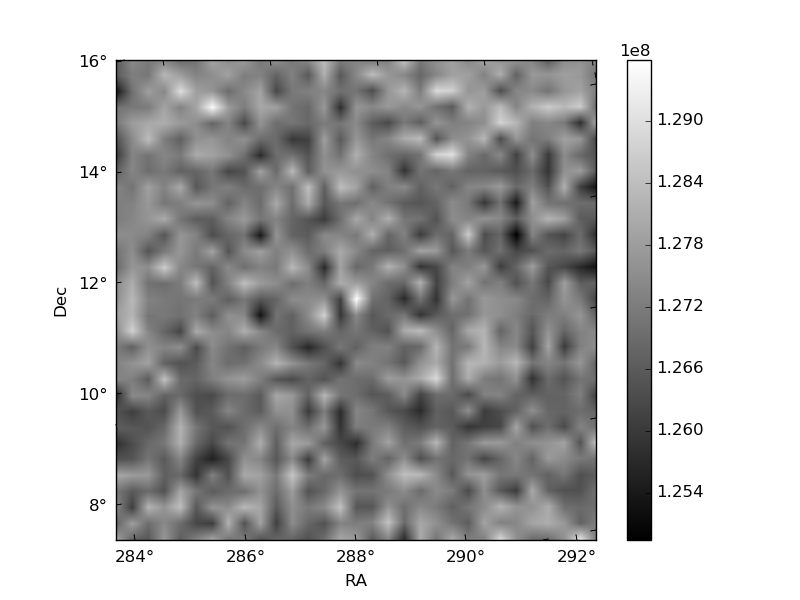
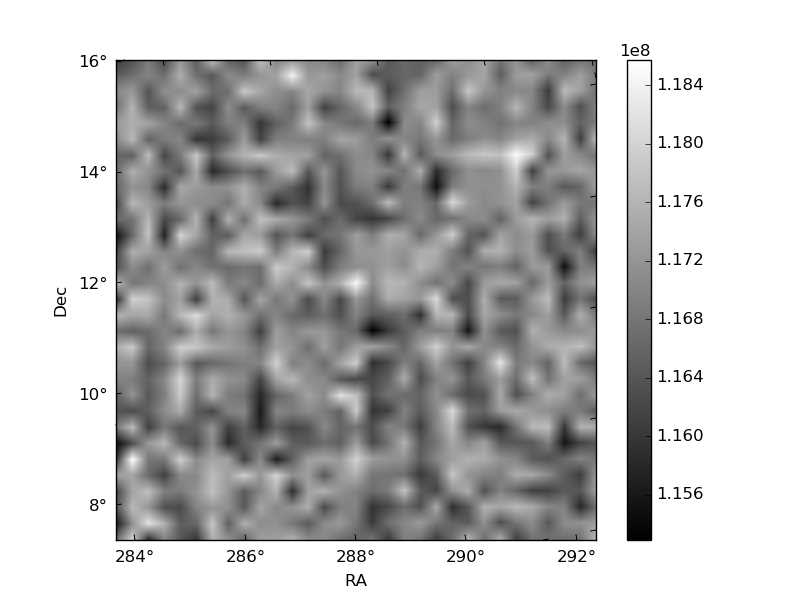
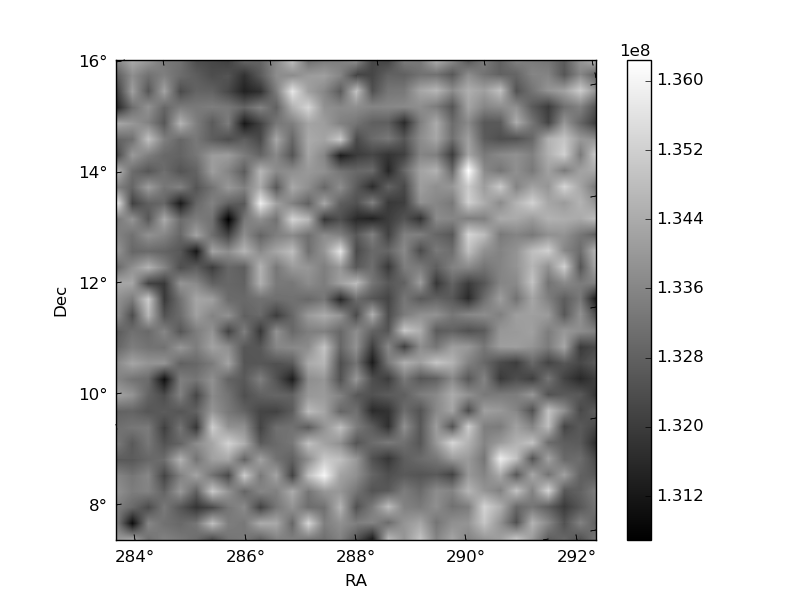
Histogram calculated using DETX and DETY for each event in the final _common_clean file
| Quadrant A | 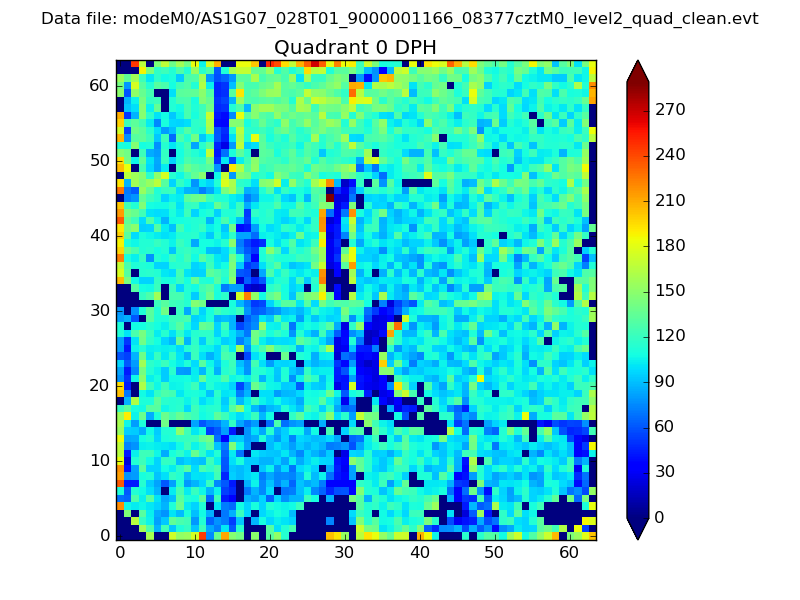 |
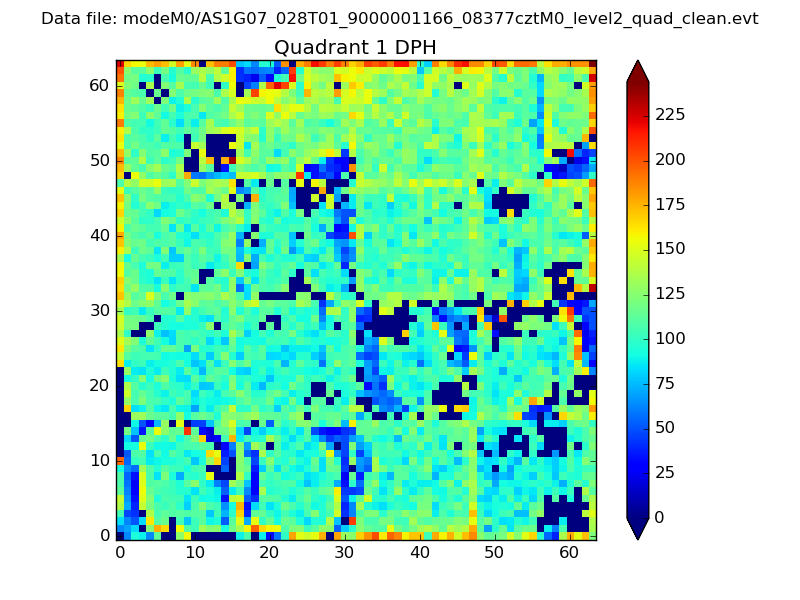 |
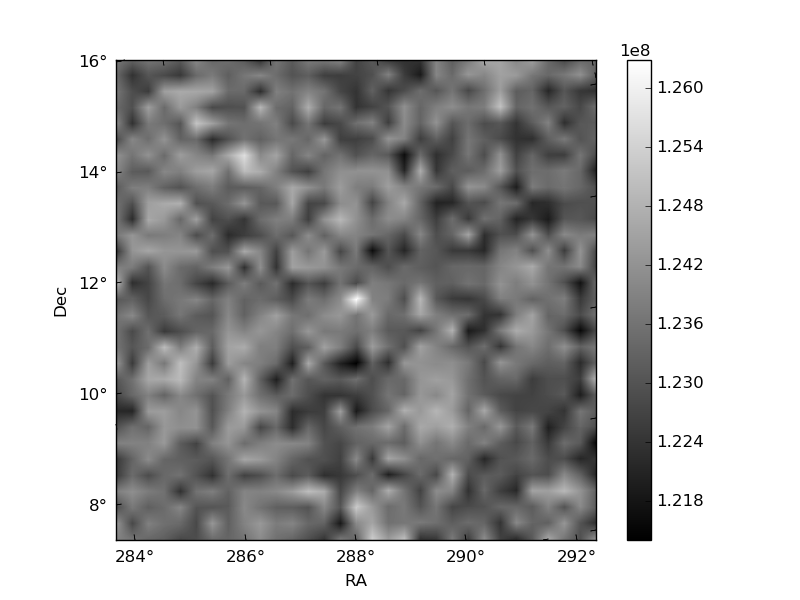
Quadrant B |
|---|---|---|---|
| Quadrant D | 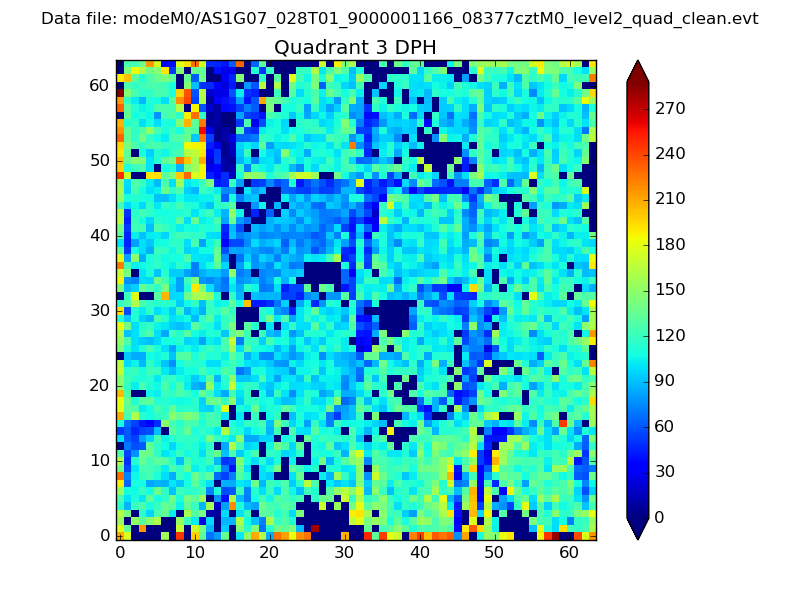 |
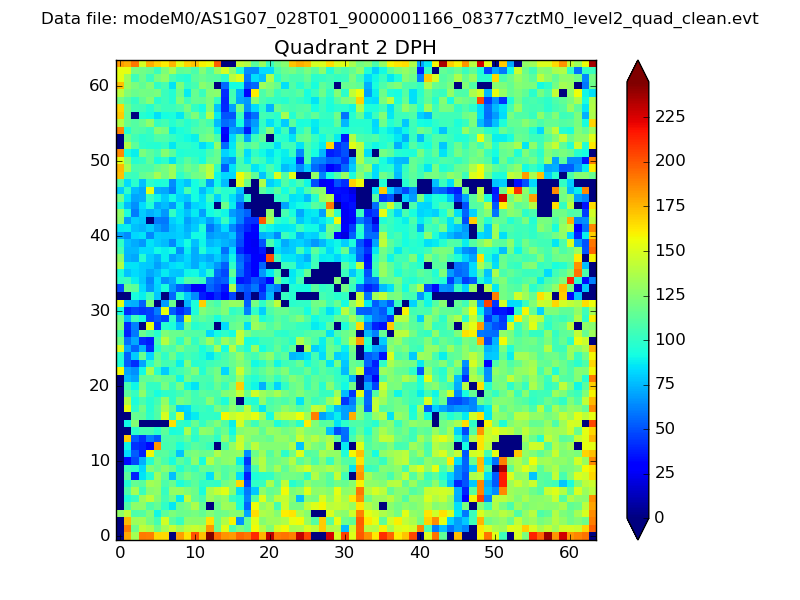 |
Quadrant C |
| Plot type | Count rate plots | Images |
|---|---|---|
| Comparison with Poisson distribution Blue bars denote a histogram of data divided into 1 sec bins. Red curve is a Poisson curve with rate = median count rate of data. |
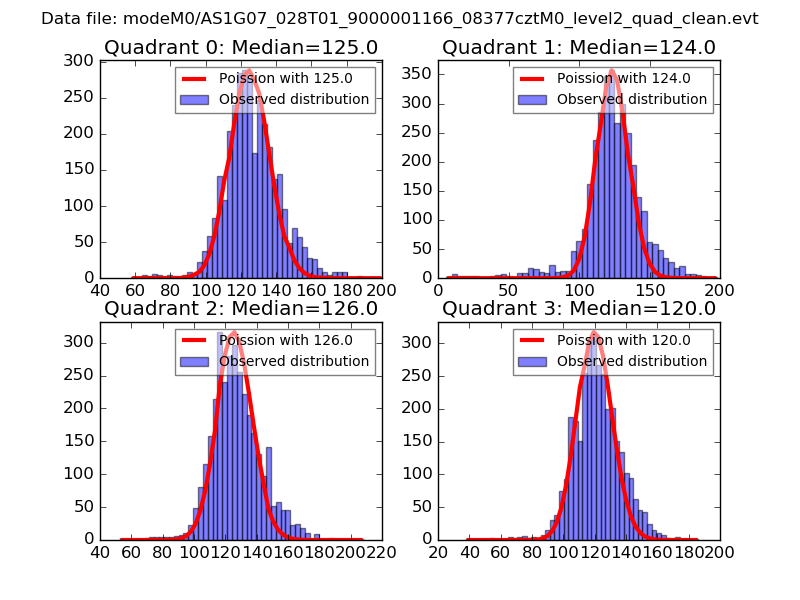 |
 |
| Quadrant-wise count rates Data is divided into 100 sec bins |
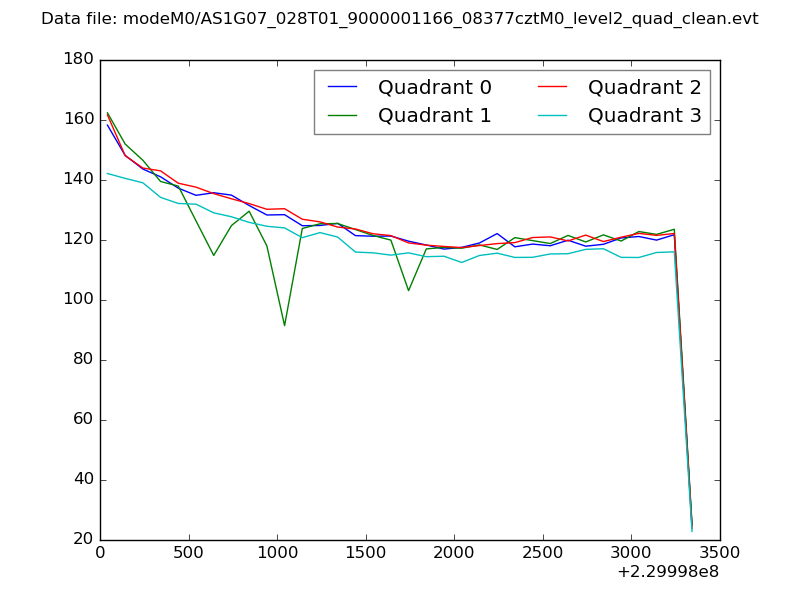 |
|
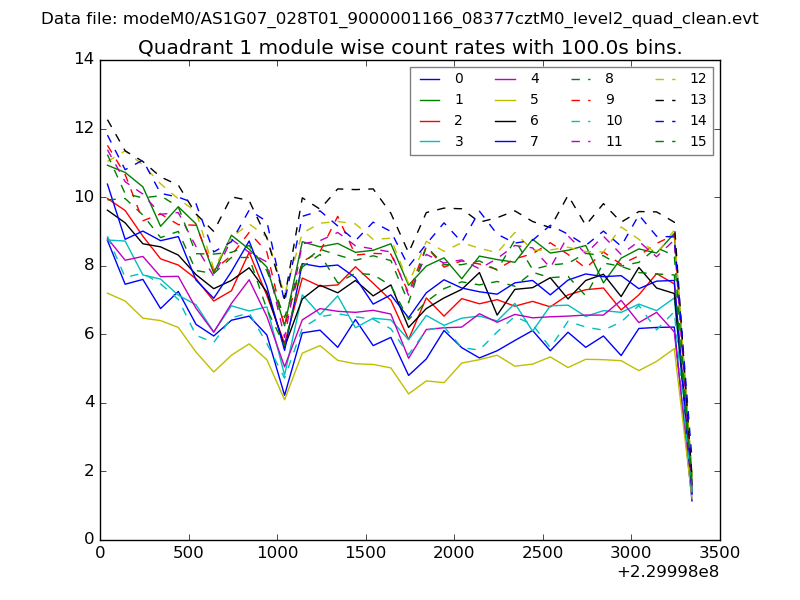
| Module-wise count rates for Quadrant A Data is divided into 100 sec bins |
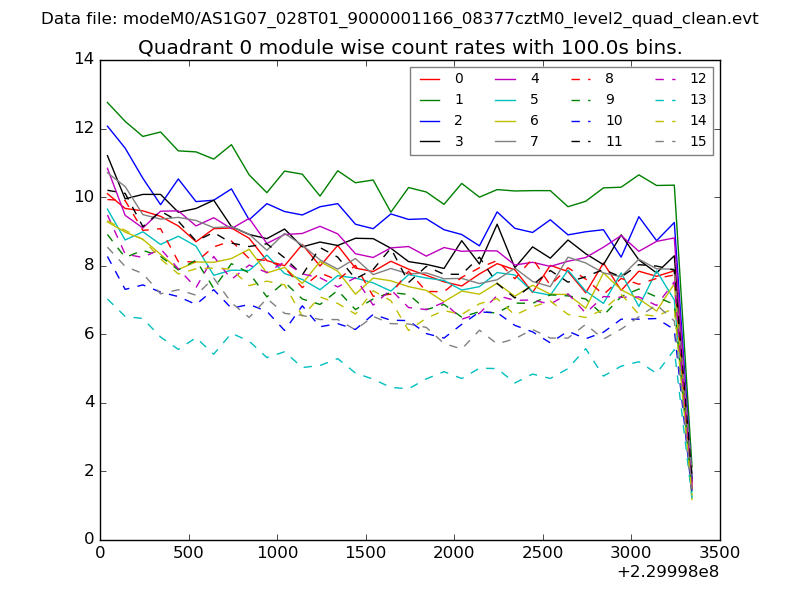 |
 |
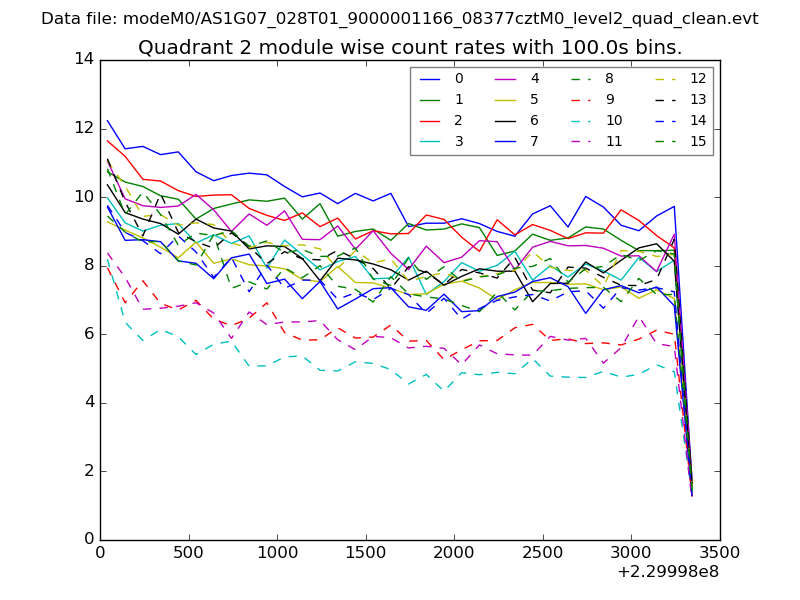
| Module-wise count rates for Quadrant B Data is divided into 100 sec bins |
 |
 |
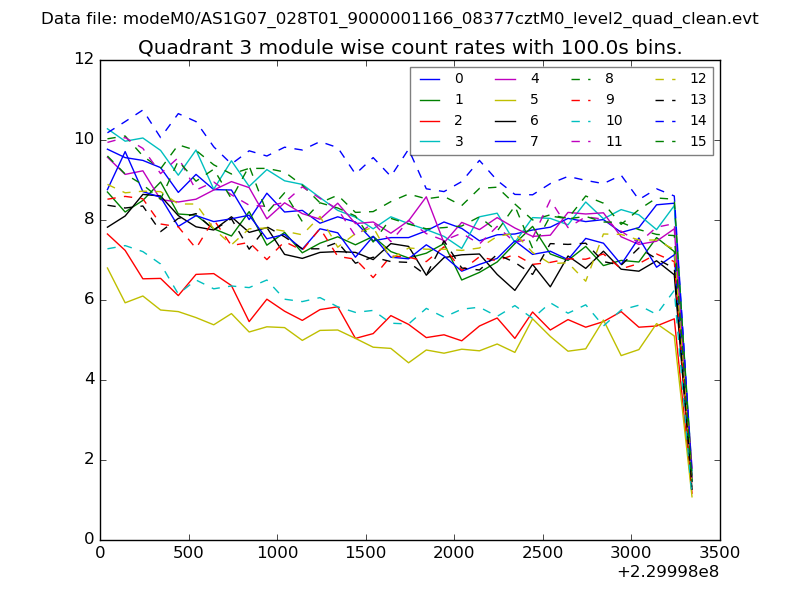
| Module-wise count rates for Quadrant C Data is divided into 100 sec bins |
 |
 |
| Module-wise count rates for Quadrant D Data is divided into 100 sec bins |
 |
 |
| Parameter | Plot |
|---|---|
| CZT HV Monitor | 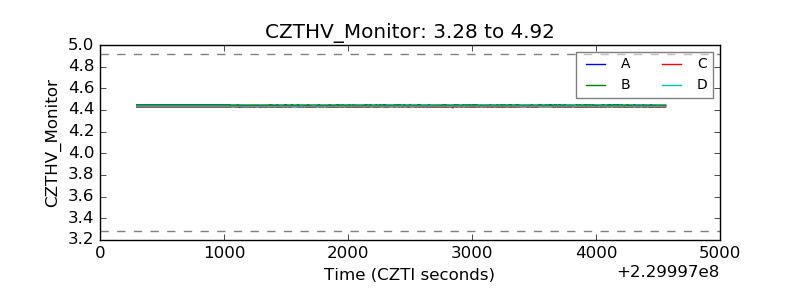 |
| D_VDD | 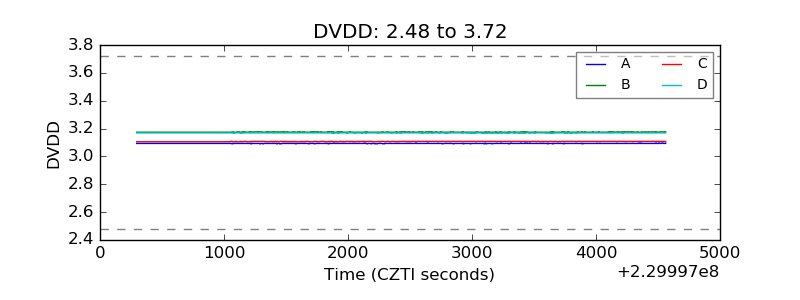 |
| Temperature 1 | 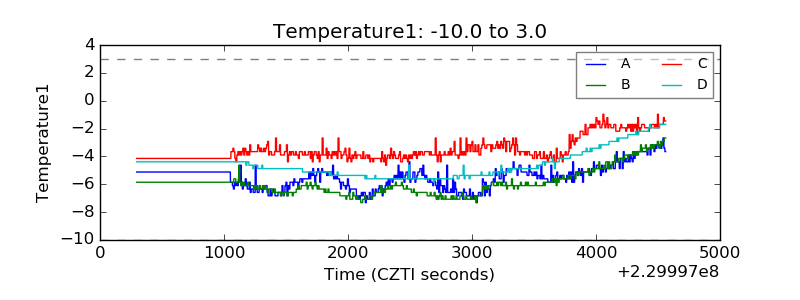 |
| Veto HV Monitor | 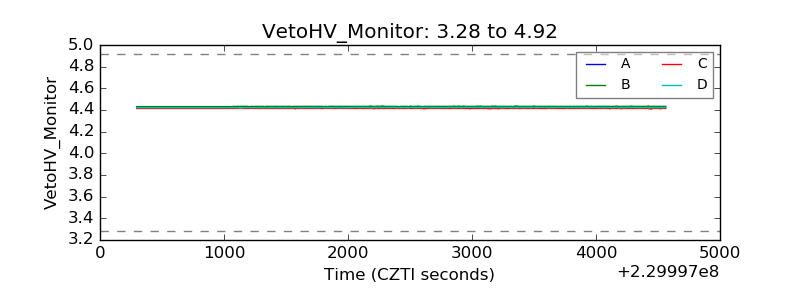 |
| Veto LLD | 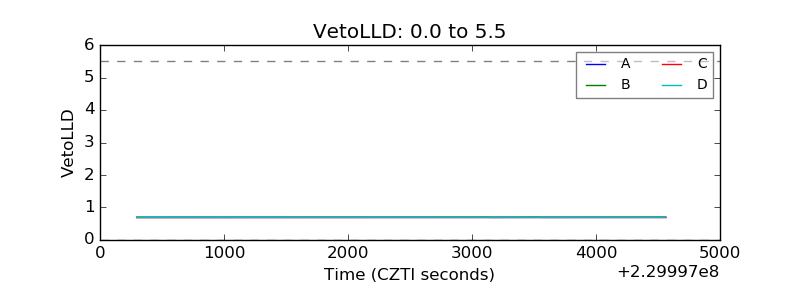 |
| Alpha Counter | 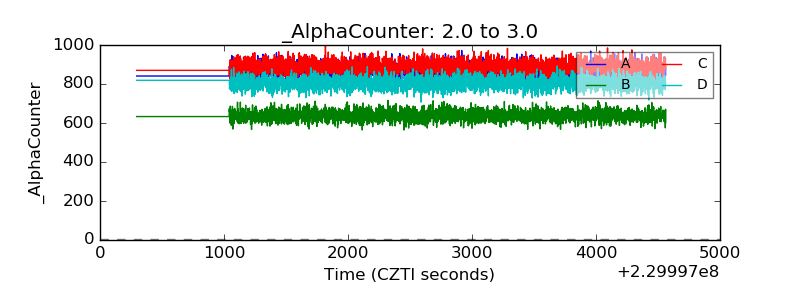 |
| _CPM_Rate | 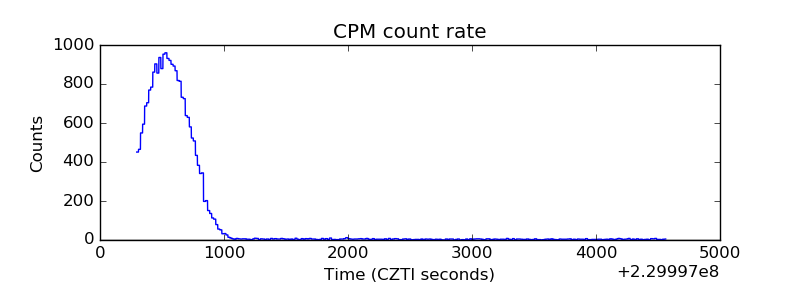 |
| CZT Counter | 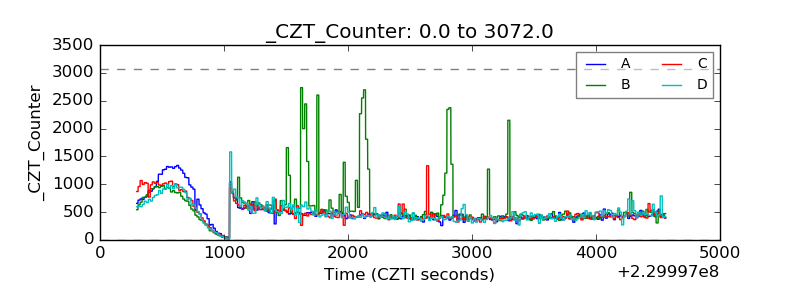 |
| +2.5 Volts monitor | 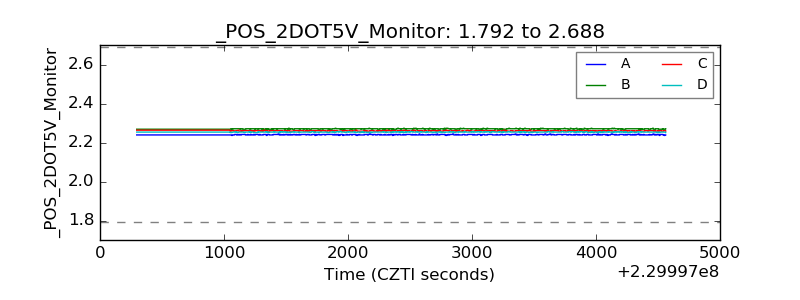 |
| +5 Volts monitor |  |
| _ROLL_ROT | 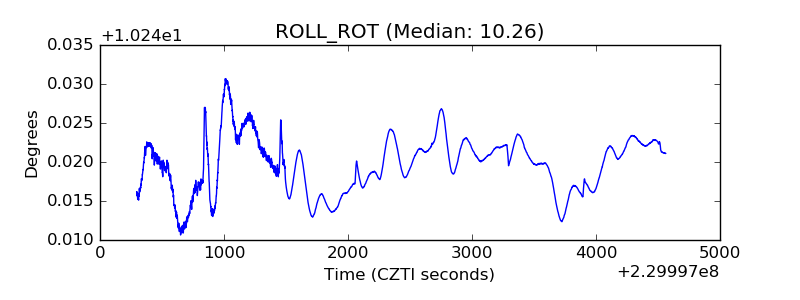 |
| _Roll_DEC | 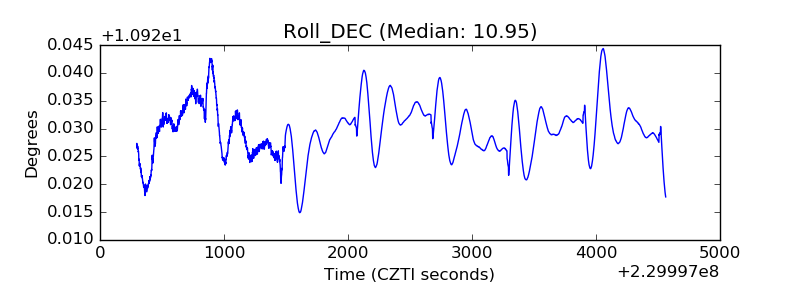 |
| _Roll_RA | 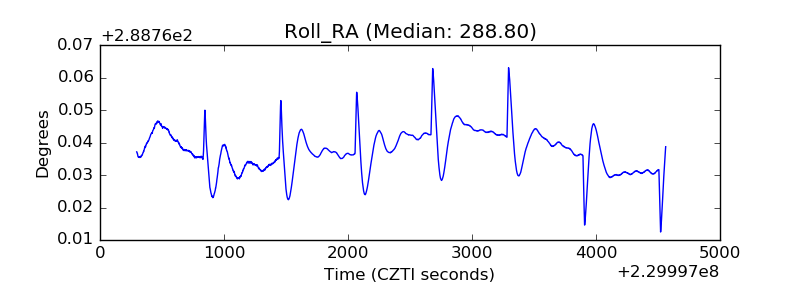 |
| Veto Counter | 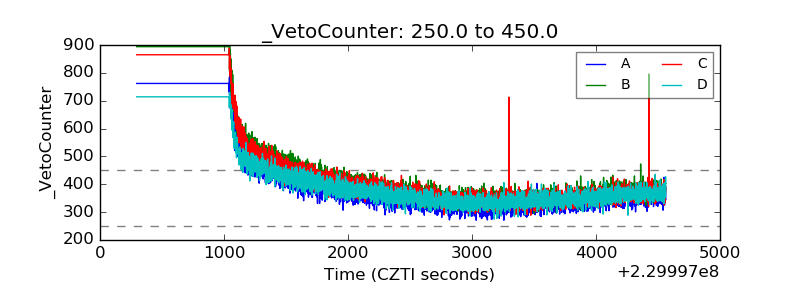 |