| Param | Original file | Final file |
|---|---|---|
| Filename | modeM0/AS1A03_062T01_9000001176cztM0_level2.fits | modeM0/AS1A03_062T01_9000001176cztM0_level2_quad_clean.evt |
| Size (bytes) | 360,987,840 | 286,148,160 |
| Size | 344.3 MB | 272.9 MB |
| Events in quadrant A | 2,229,790 | 1,608,336 |
| Events in quadrant B | 2,152,610 | 1,627,381 |
| Events in quadrant C | 2,166,102 | 1,518,349 |
| Events in quadrant D | 1,870,970 | 1,397,376 |
| Mode M0 | |||
|---|---|---|---|
| Quadrant | BADHDUFLAG | Total packets | Discarded packets |
| A | 0 | 76505 | 0 |
| B | 0 | 78008 | 0 |
| C | 0 | 75321 | 0 |
| D | 0 | 81962 | 0 |
| Mode SS | |||
|---|---|---|---|
| Quadrant | BADHDUFLAG | Total packets | Discarded packets |
| A | 0 | 748 | 0 |
| B | 0 | 748 | 0 |
| C | 0 | 748 | 0 |
| D | 0 | 748 | 0 |
| Mode M9 | |||
|---|---|---|---|
| Quadrant | BADHDUFLAG | Total packets | Discarded packets |
| A | 0 | 84 | 0 |
| B | 0 | 84 | 0 |
| C | 0 | 84 | 0 |
| D | 0 | 84 | 0 |
| Quadrant | Total seconds | Saturated seconds | Saturation percentage |
|---|---|---|---|
| A | 36595 | 525 | 1.434622% |
| B | 36595 | 467 | 1.276131% |
| C | 36595 | 191 | 0.521929% |
| D | 36595 | 484 | 1.322585% |
Noise dominated data is calculated using 1-second bins in cleaned event files. If a bin has >2000 counts, and if more than 50% of those come from <1% of pixels, then it is considered to be noise-dominated and hence unusable.
| Quadrant | # 1 sec bins | Bins with >0 counts | Bins with >2000 counts | High rate bins dominated by noise | Noise dominated (total time) | Noise dominated (detector-on time) | Marked lightcurve |
|---|---|---|---|---|---|---|---|
| A | 44925 | 36595 | 0 | 0 | 0.00% | 0.00% |  |
| B | 44925 | 36591 | 0 | 0 | 0.00% | 0.00% |  |
| C | 44925 | 36594 | 0 | 0 | 0.00% | 0.00% | 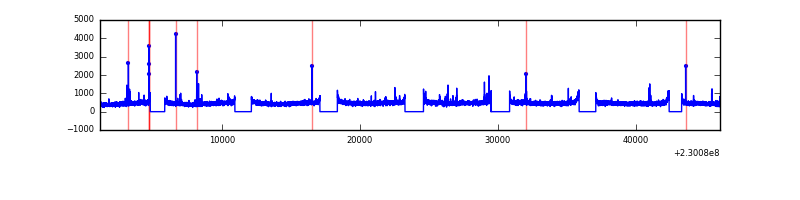 |
| D | 44925 | 36592 | 0 | 0 | 0.00% | 0.00% | 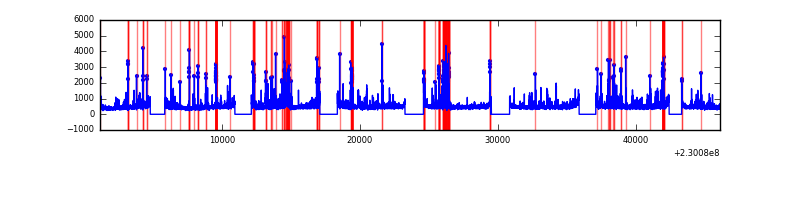 |
Top three noisy pixels from each quadrant. If the there are fewer than three noisy pixels in the level2.evt file, extra rows are filled as -1
| Pixel properties | Quadrant properties | ||||||
|---|---|---|---|---|---|---|---|
| Quadrant | DetID | PixID | Counts | Sigma | Mean | Median | Sigma |
| A | 0 | 29 | 2082 | 10.43 | 580 | 544 | 147.5 |
| A | 7 | 110 | 1759 | 8.24 | 580 | 544 | 147.5 |
| A | 9 | 19 | 1637 | 7.41 | 580 | 544 | 147.5 |
| B | 2 | 9 | 1808 | 11.1 | 568 | 542 | 114.1 |
| B | 5 | 128 | 1475 | 8.18 | 568 | 542 | 114.1 |
| B | 12 | 226 | 1423 | 7.72 | 568 | 542 | 114.1 |
| C | 1 | 81 | 1562 | 6.77 | 572 | 532 | 152.0 |
| C | 1 | 80 | 1541 | 6.64 | 572 | 532 | 152.0 |
| C | 2 | 191 | 1464 | 6.13 | 572 | 532 | 152.0 |
| D | 6 | 231 | 1447 | 6.73 | 533 | 485 | 142.9 |
| D | 6 | 83 | 1324 | 5.87 | 533 | 485 | 142.9 |
| D | 7 | 5 | 1316 | 5.82 | 533 | 485 | 142.9 |
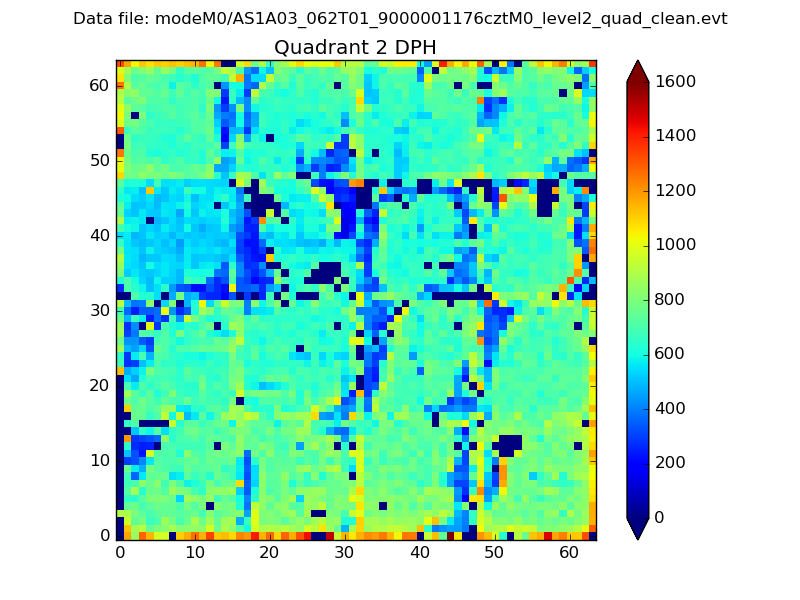
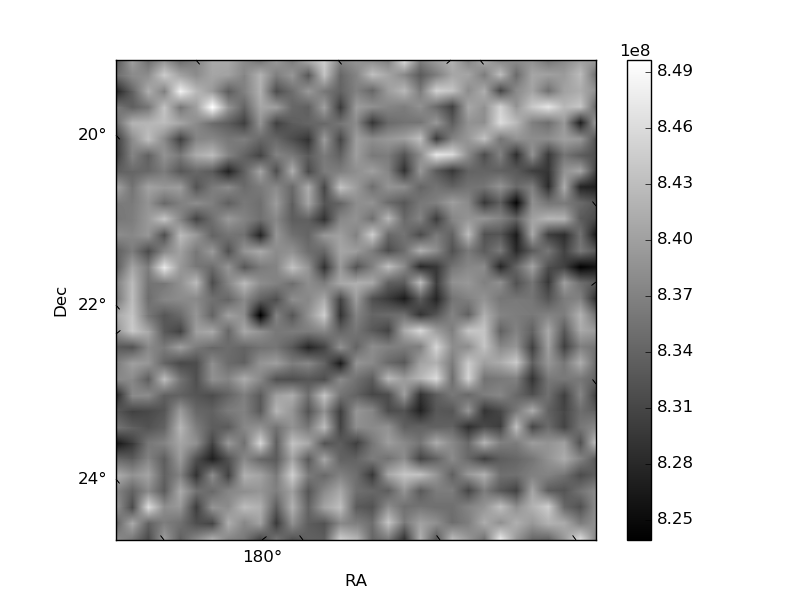
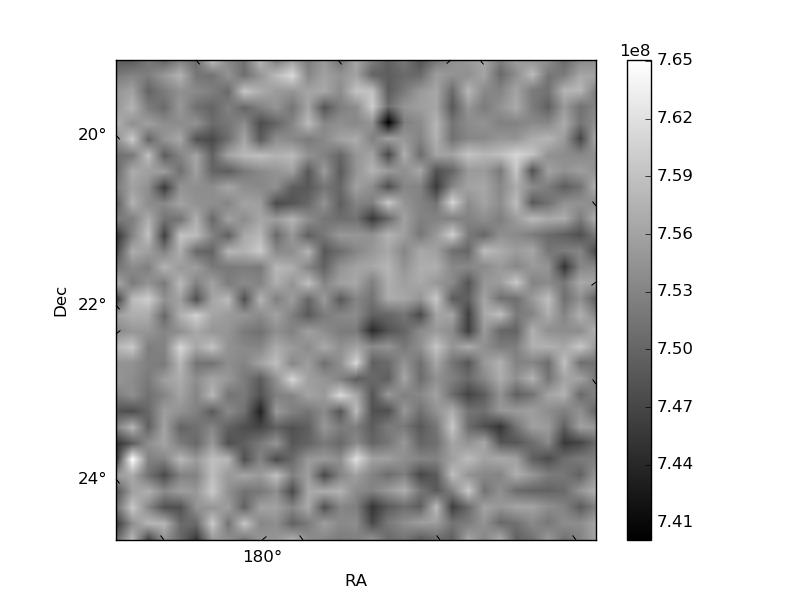
Histogram calculated using DETX and DETY for each event in the final _common_clean file
| Quadrant A | 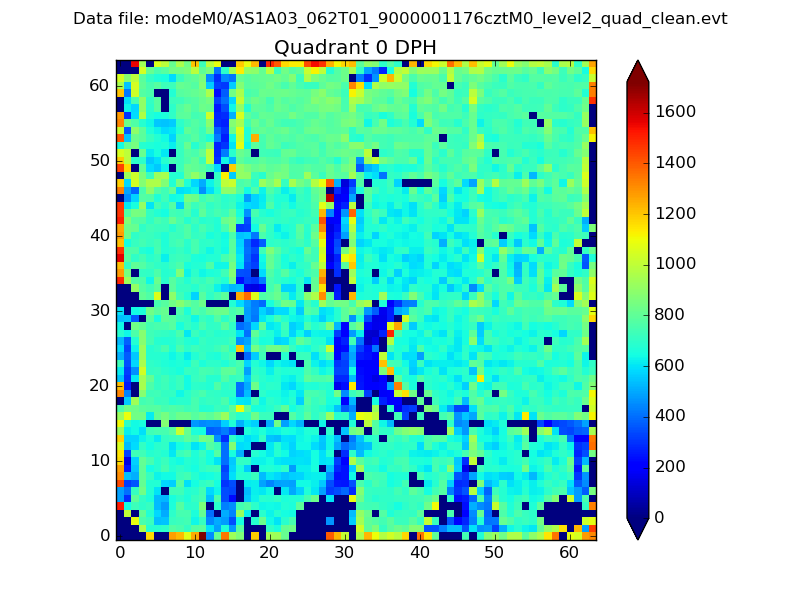 |
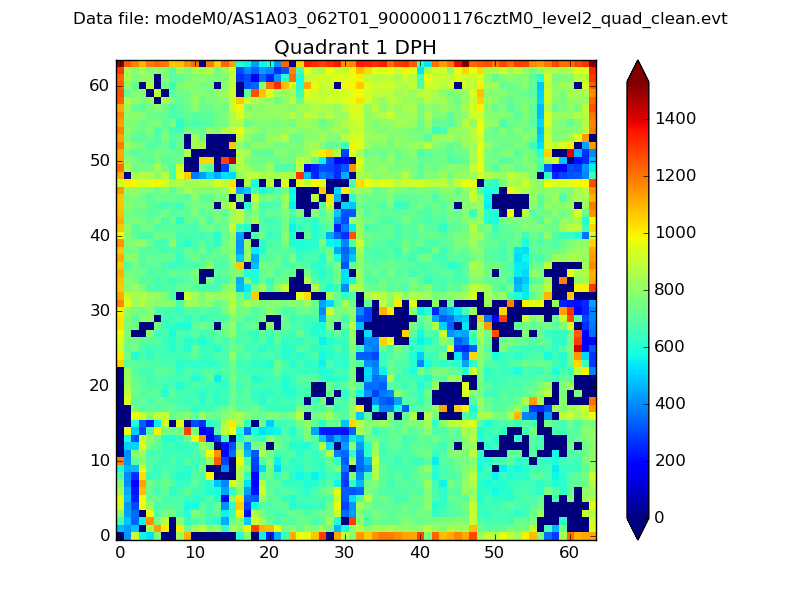 |
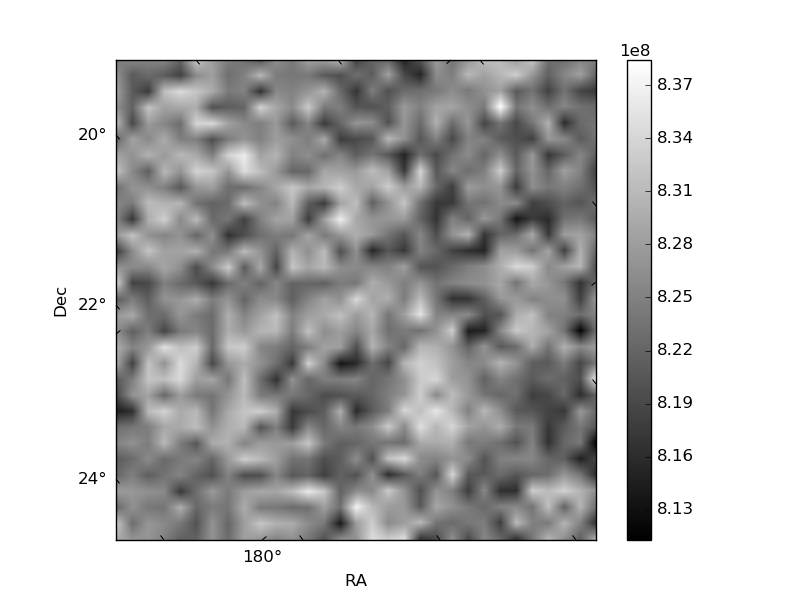
Quadrant B |
|---|---|---|---|
| Quadrant D | 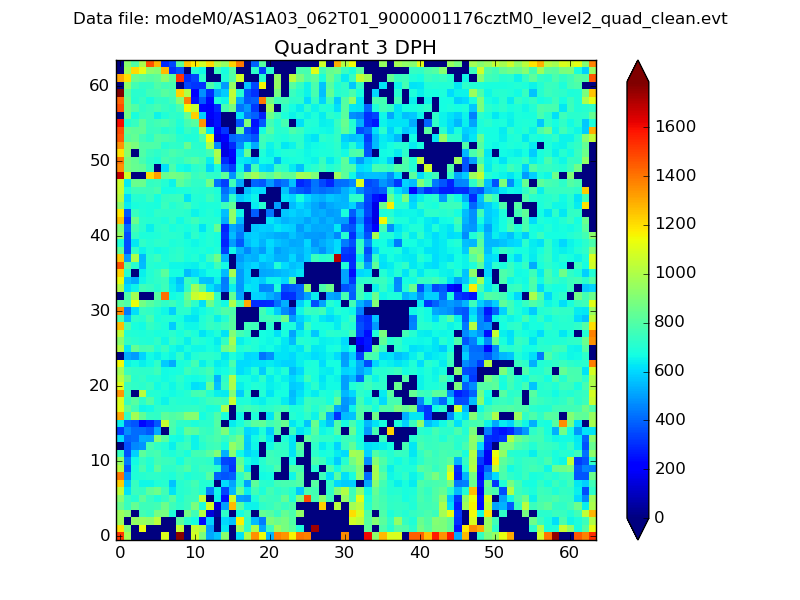 |
 |
Quadrant C |
| Plot type | Count rate plots | Images |
|---|---|---|
| Comparison with Poisson distribution Blue bars denote a histogram of data divided into 1 sec bins. Red curve is a Poisson curve with rate = median count rate of data. |
 |
 |
| Quadrant-wise count rates Data is divided into 100 sec bins |
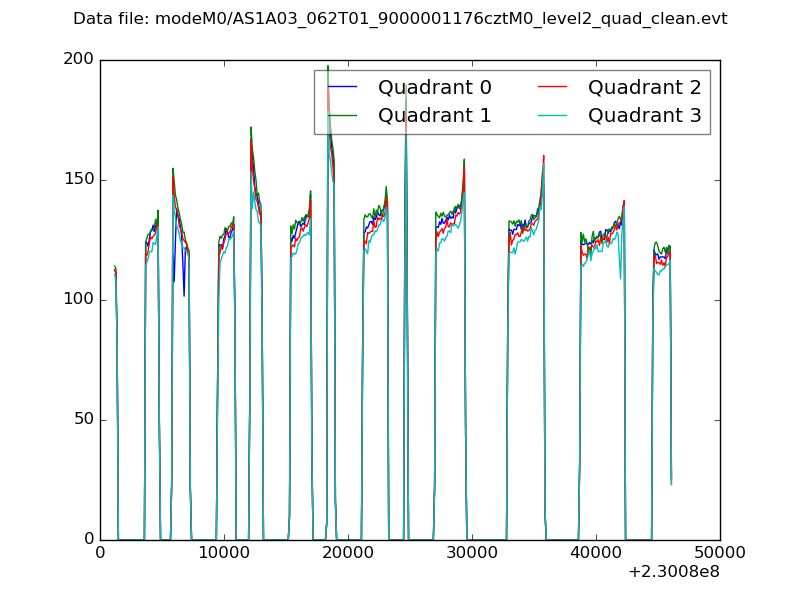 |
|
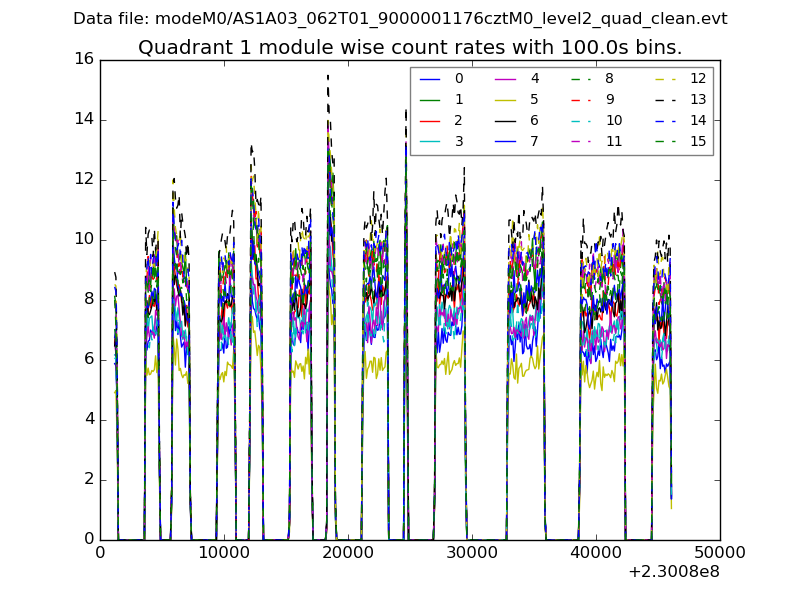
| Module-wise count rates for Quadrant A Data is divided into 100 sec bins |
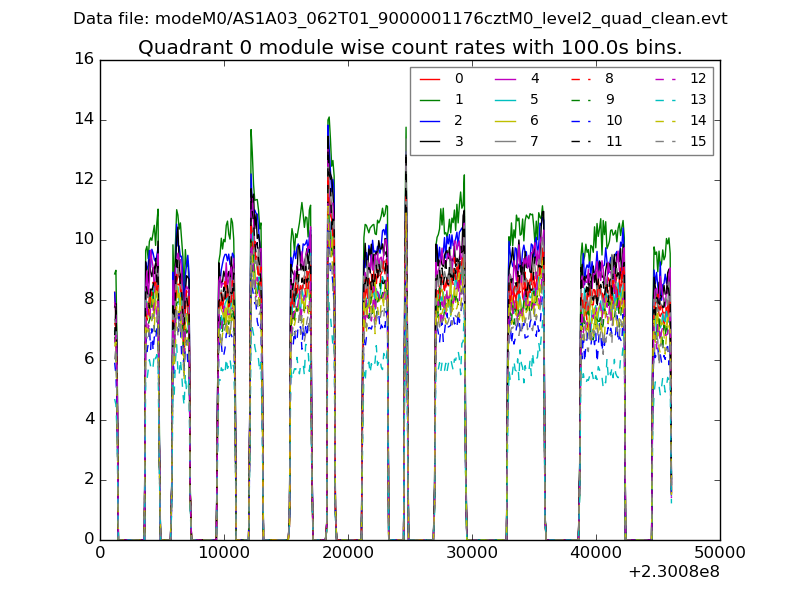 |
 |
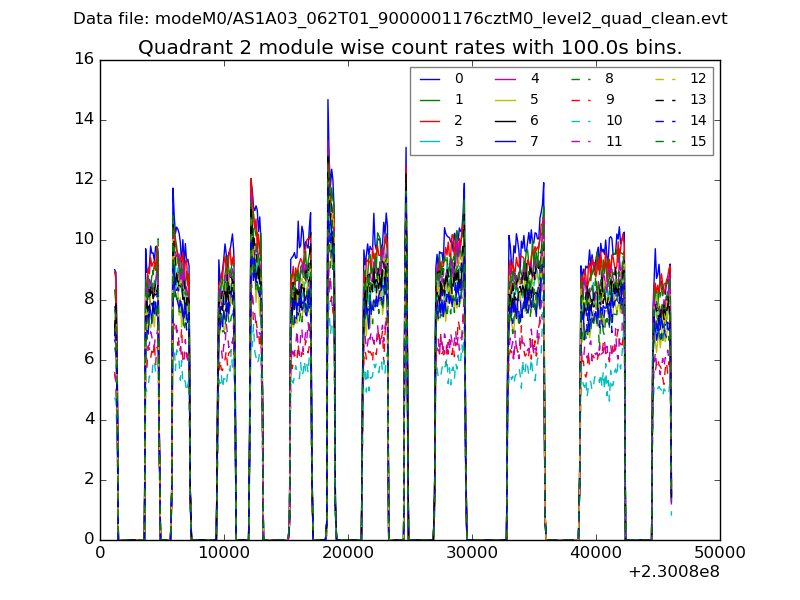
| Module-wise count rates for Quadrant B Data is divided into 100 sec bins |
 |
 |
| Module-wise count rates for Quadrant C Data is divided into 100 sec bins |
 |
 |
| Module-wise count rates for Quadrant D Data is divided into 100 sec bins |
 |
 |
| Parameter | Plot |
|---|---|
| CZT HV Monitor | 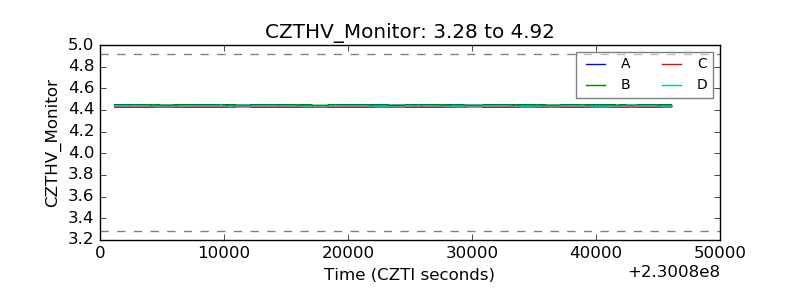 |
| D_VDD | 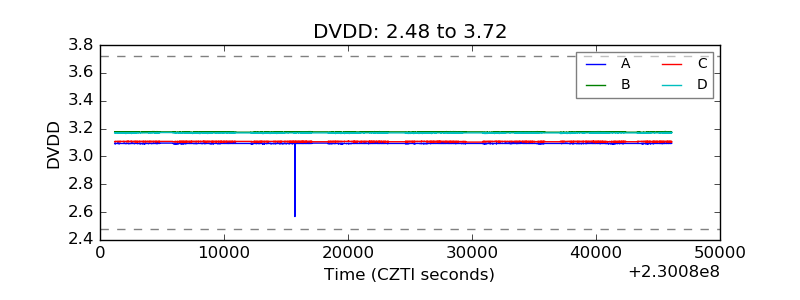 |
| Temperature 1 | 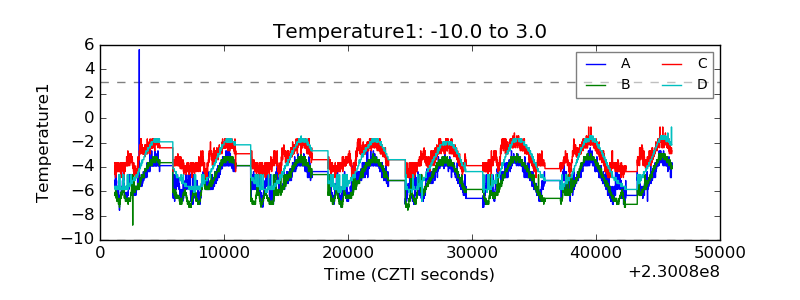 |
| Veto HV Monitor |  |
| Veto LLD |  |
| Alpha Counter | 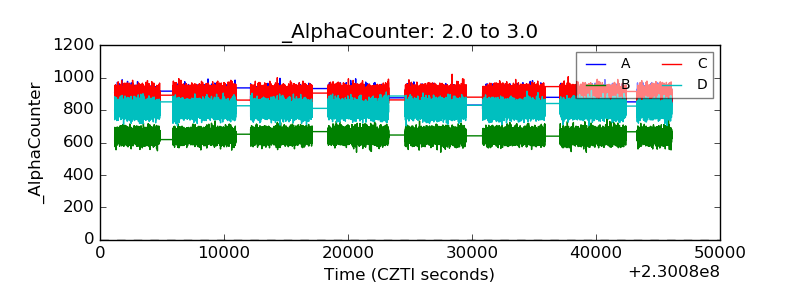 |
| _CPM_Rate |  |
| CZT Counter | 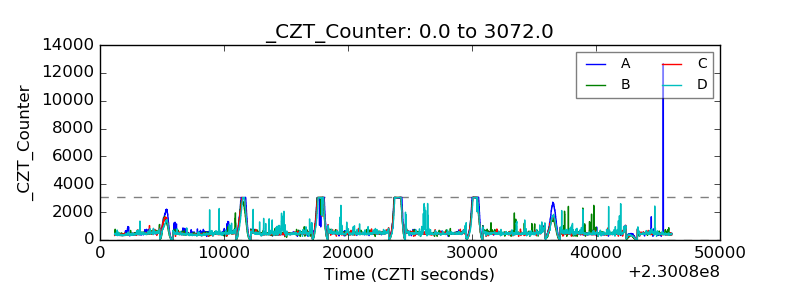 |
| +2.5 Volts monitor |  |
| +5 Volts monitor |  |
| _ROLL_ROT |  |
| _Roll_DEC | 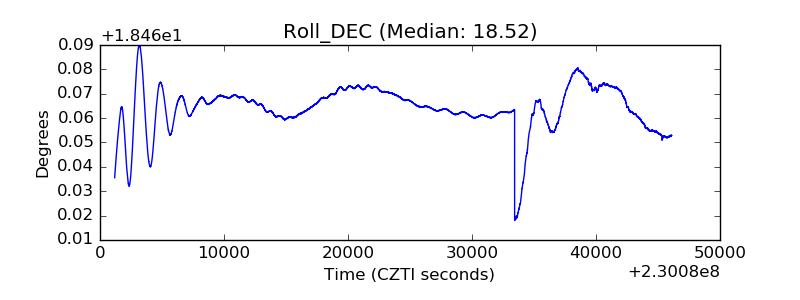 |
| _Roll_RA |  |
| Veto Counter |  |