| Param | Original file | Final file |
|---|---|---|
| Filename | modeM0/AS1A03_062T01_9000001176_08392cztM0_level2.evt | modeM0/AS1A03_062T01_9000001176_08392cztM0_level2_quad_clean.evt |
| Size (bytes) | 476,997,120 | 93,648,960 |
| Size | 454.9 MB | 89.3 MB |
| Events in quadrant A | 3,699,060 | 583,683 |
| Events in quadrant B | 3,506,927 | 607,811 |
| Events in quadrant C | 3,243,429 | 590,689 |
| Events in quadrant D | 3,522,178 | 567,590 |
| Mode M0 | |||
|---|---|---|---|
| Quadrant | BADHDUFLAG | Total packets | Discarded packets |
| A | 0 | 15327 | 3 |
| B | 0 | 14865 | 2 |
| C | 0 | 14280 | 2 |
| D | 0 | 15314 | 2 |
| Mode SS | |||
|---|---|---|---|
| Quadrant | BADHDUFLAG | Total packets | Discarded packets |
| A | 0 | 144 | 0 |
| B | 0 | 144 | 0 |
| C | 0 | 144 | 0 |
| D | 0 | 144 | 0 |
| Mode M9 | |||
|---|---|---|---|
| Quadrant | BADHDUFLAG | Total packets | Discarded packets |
| A | 0 | 22 | 0 |
| B | 0 | 22 | 0 |
| C | 0 | 22 | 0 |
| D | 0 | 22 | 0 |
| Quadrant | Total seconds | Saturated seconds | Saturation percentage |
|---|---|---|---|
| A | 6977 | 262 | 3.755196% |
| B | 6977 | 66 | 0.945965% |
| C | 6977 | 23 | 0.329655% |
| D | 6977 | 82 | 1.175290% |
Noise dominated data is calculated using 1-second bins in cleaned event files. If a bin has >2000 counts, and if more than 50% of those come from <1% of pixels, then it is considered to be noise-dominated and hence unusable.
| Quadrant | # 1 sec bins | Bins with >0 counts | Bins with >2000 counts | High rate bins dominated by noise | Noise dominated (total time) | Noise dominated (detector-on time) | Marked lightcurve |
|---|---|---|---|---|---|---|---|
| A | 9227 | 6979 | 1 | 1 | 0.01% | 0.01% | 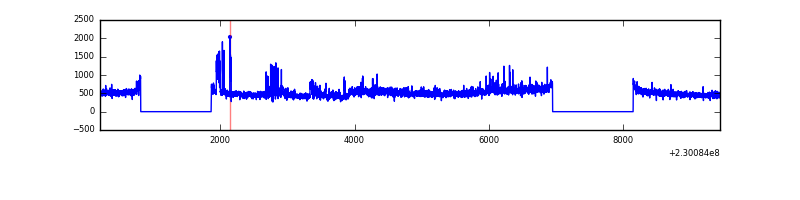 |
| B | 9227 | 6979 | 3 | 3 | 0.03% | 0.04% | 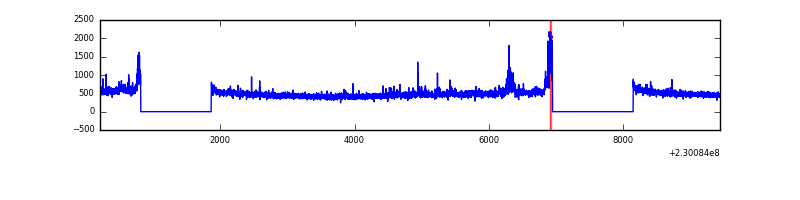 |
| C | 9227 | 6979 | 5 | 5 | 0.05% | 0.07% | 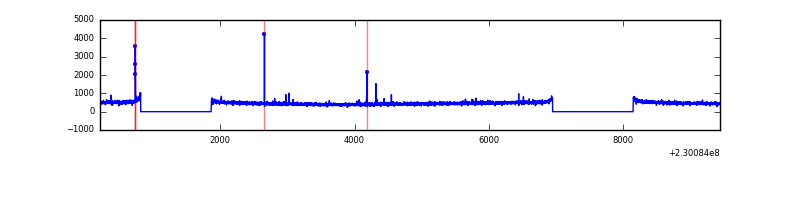 |
| D | 9227 | 6979 | 59 | 59 | 0.64% | 0.85% | 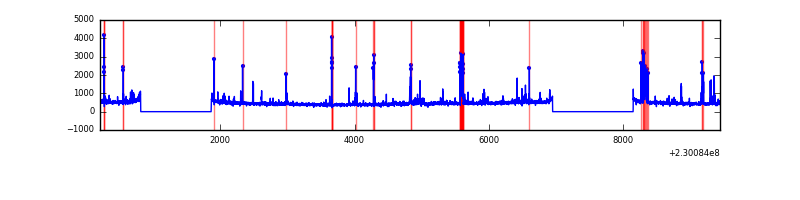 |
Top three noisy pixels from each quadrant. If the there are fewer than three noisy pixels in the level2.evt file, extra rows are filled as -1
| Pixel properties | Quadrant properties | ||||||
|---|---|---|---|---|---|---|---|
| Quadrant | DetID | PixID | Counts | Sigma | Mean | Median | Sigma |
| A | 14 | 111 | 465845 | 2693.36 | 838 | 820 | 172.7 |
| A | 15 | 236 | 13805 | 75.21 | 838 | 820 | 172.7 |
| A | 0 | 226 | 7724 | 39.99 | 838 | 820 | 172.7 |
| B | 5 | 255 | 86668 | 528.51 | 854 | 834 | 162.4 |
| B | 0 | 214 | 34161 | 205.21 | 854 | 834 | 162.4 |
| B | 4 | 81 | 24763 | 147.34 | 854 | 834 | 162.4 |
| C | 1 | 16 | 27838 | 141.13 | 824 | 826 | 191.4 |
| C | 13 | 61 | 6237 | 28.27 | 824 | 826 | 191.4 |
| C | 12 | 4 | 2248 | 7.43 | 824 | 826 | 191.4 |
| D | 2 | 14 | 241151 | 1226.12 | 813 | 792 | 196.0 |
| D | 2 | 136 | 39843 | 199.21 | 813 | 792 | 196.0 |
| D | 14 | 34 | 30643 | 152.28 | 813 | 792 | 196.0 |
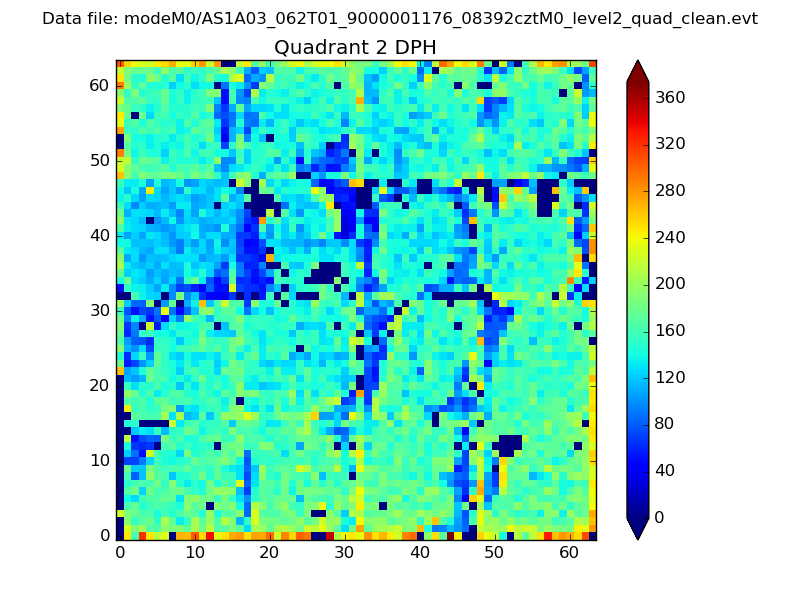
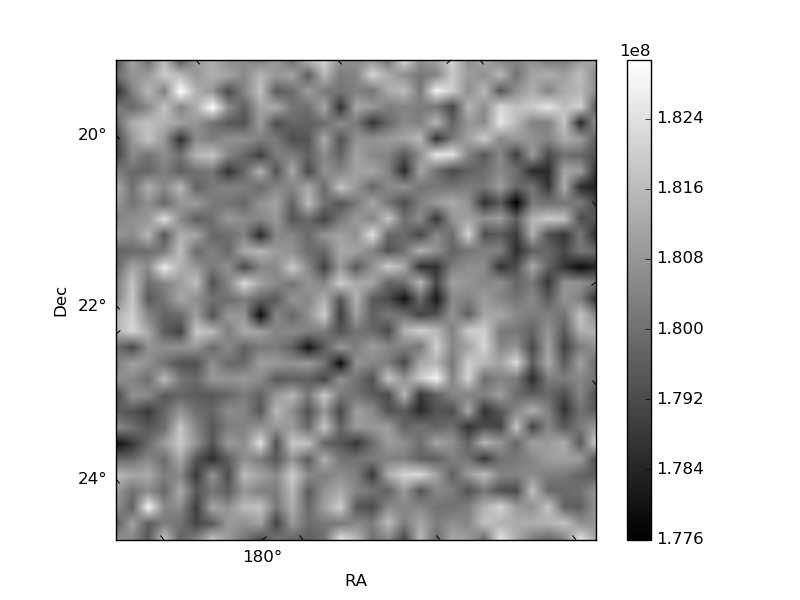
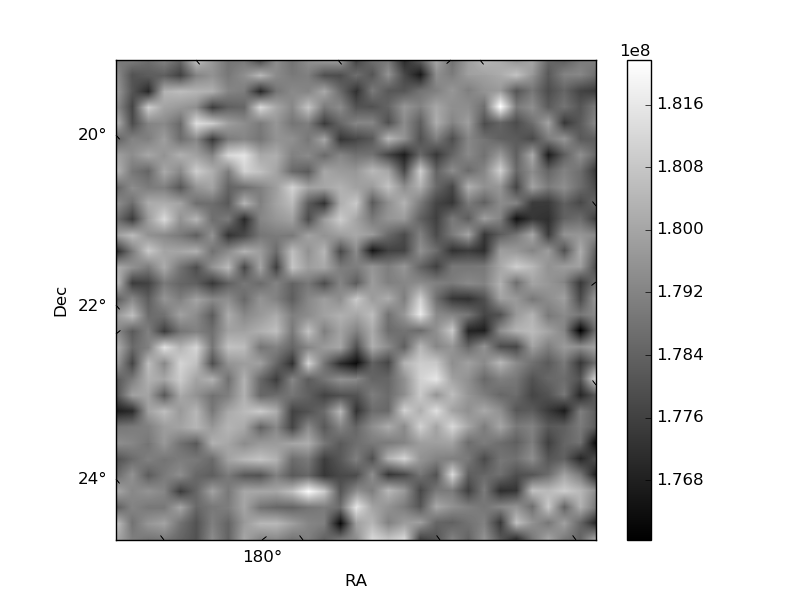
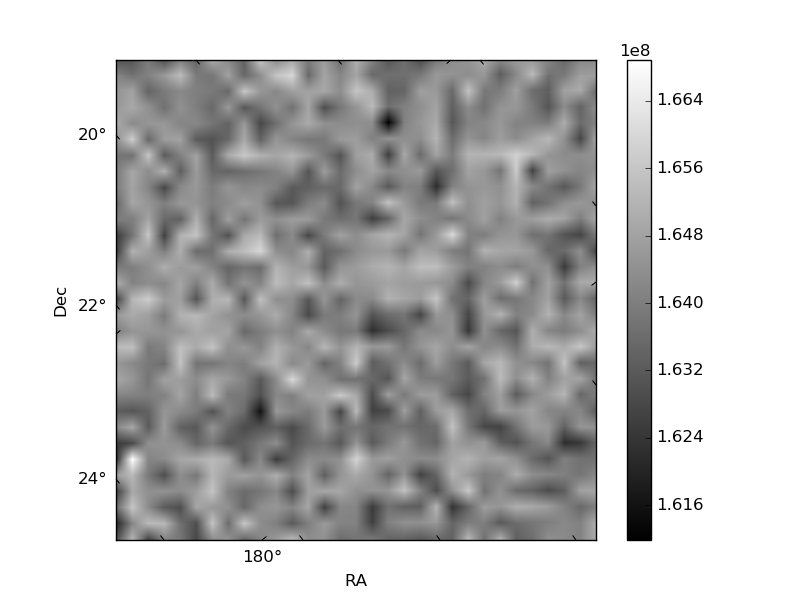
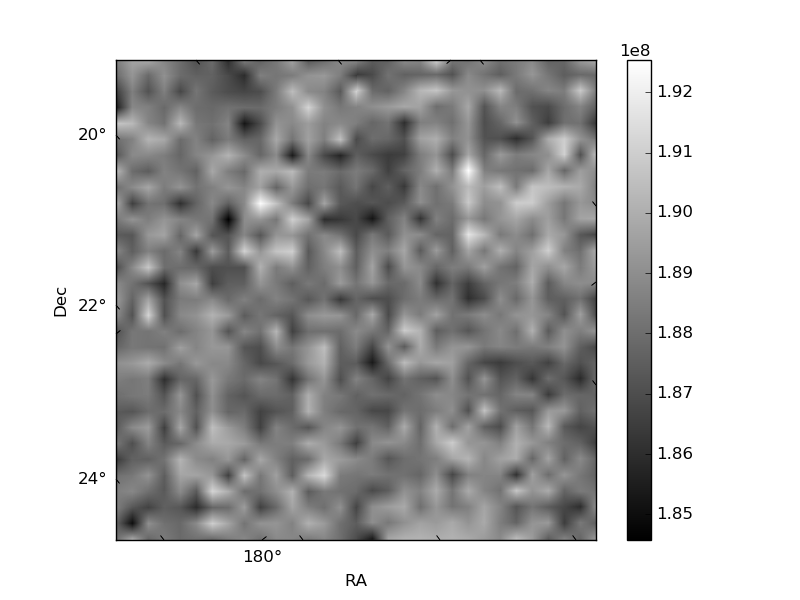
Histogram calculated using DETX and DETY for each event in the final _common_clean file
| Quadrant A | 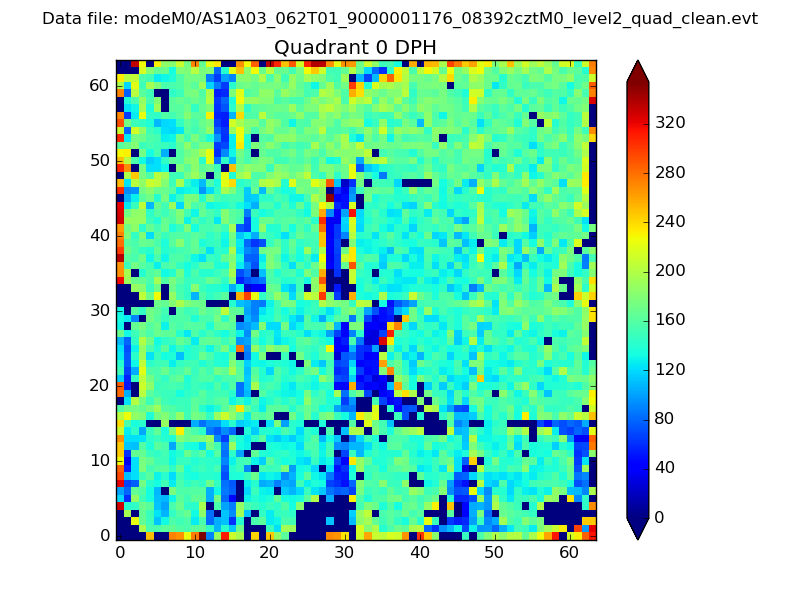 |
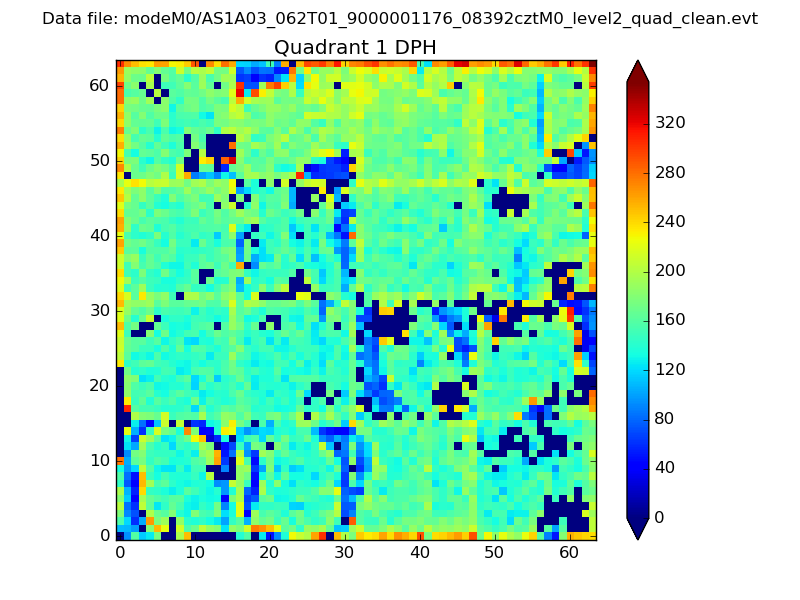 |
Quadrant B |
|---|---|---|---|
| Quadrant D | 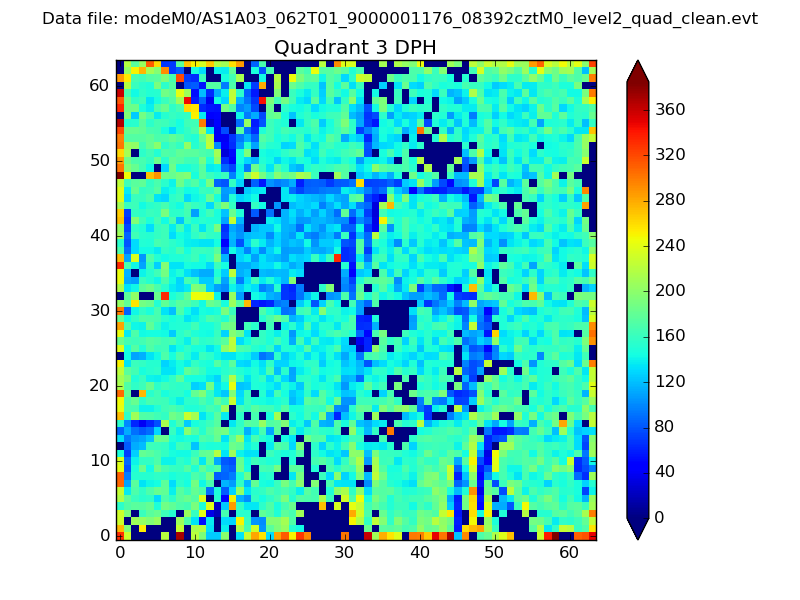 |
 |
Quadrant C |
| Plot type | Count rate plots | Images |
|---|---|---|
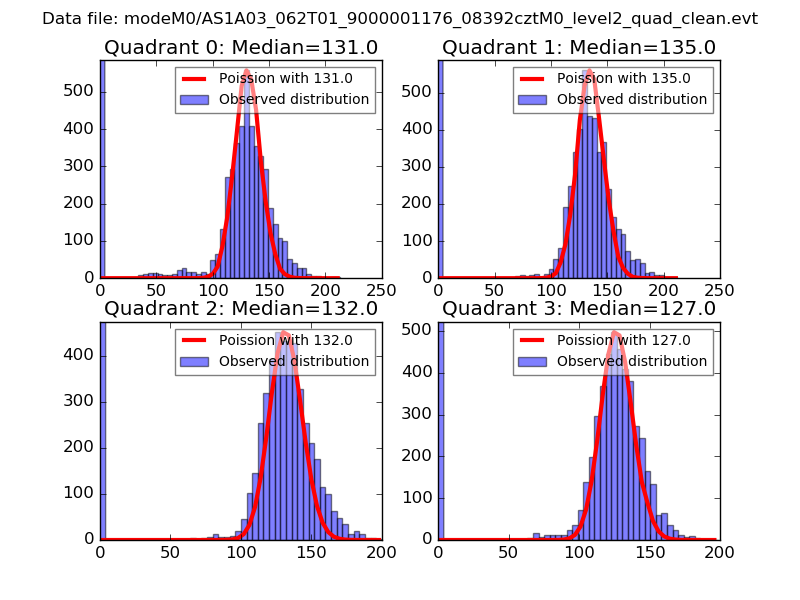
| Comparison with Poisson distribution Blue bars denote a histogram of data divided into 1 sec bins. Red curve is a Poisson curve with rate = median count rate of data. |
 |
 |
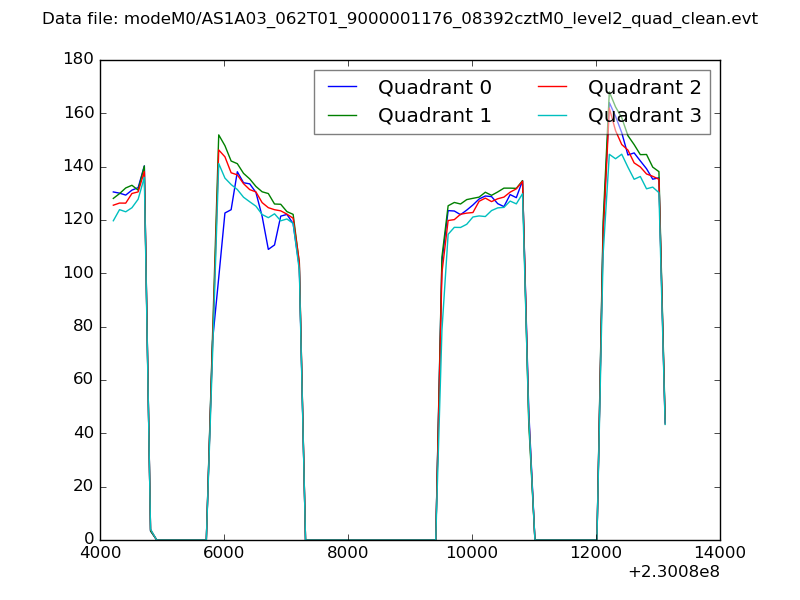
| Quadrant-wise count rates Data is divided into 100 sec bins |
 |
|
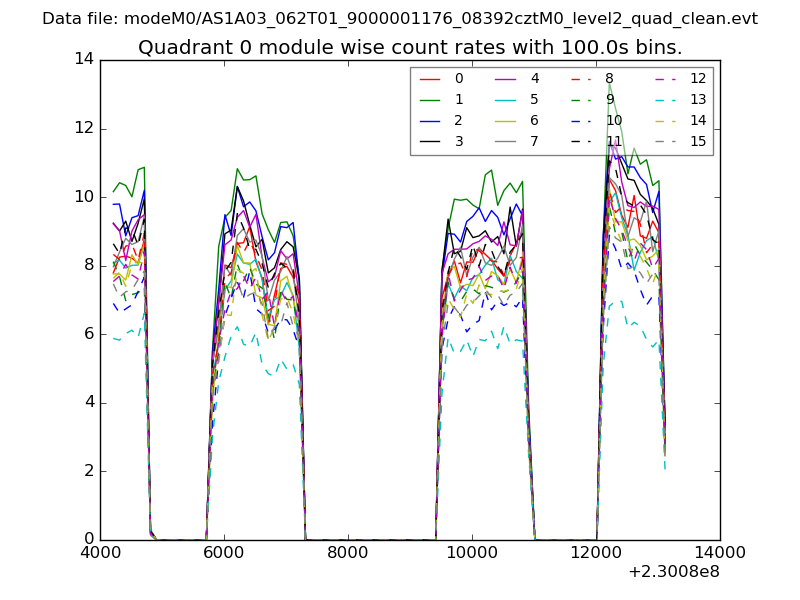
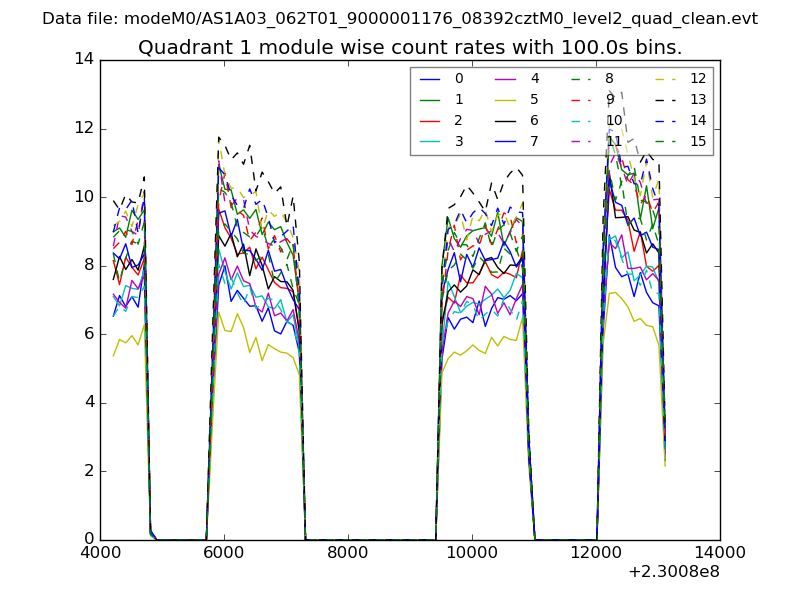
| Module-wise count rates for Quadrant A Data is divided into 100 sec bins |
 |
 |
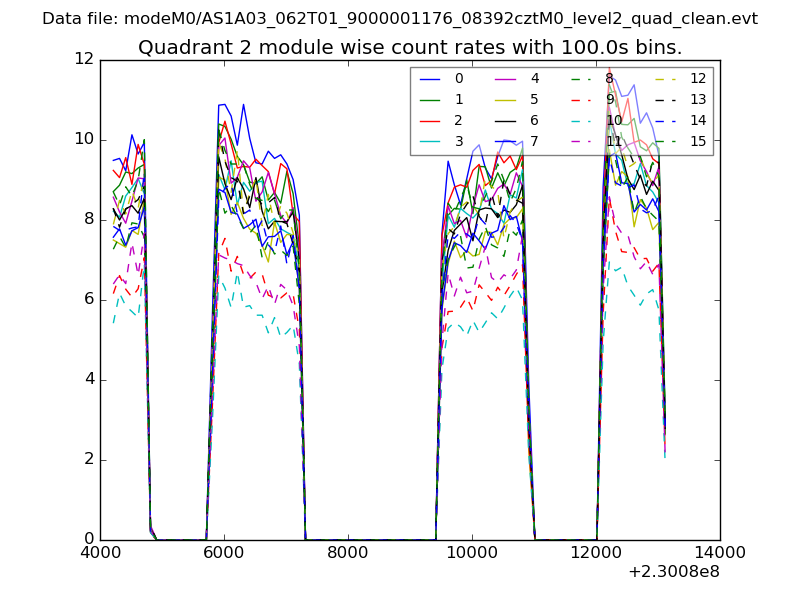
| Module-wise count rates for Quadrant B Data is divided into 100 sec bins |
 |
 |
| Module-wise count rates for Quadrant C Data is divided into 100 sec bins |
 |
 |
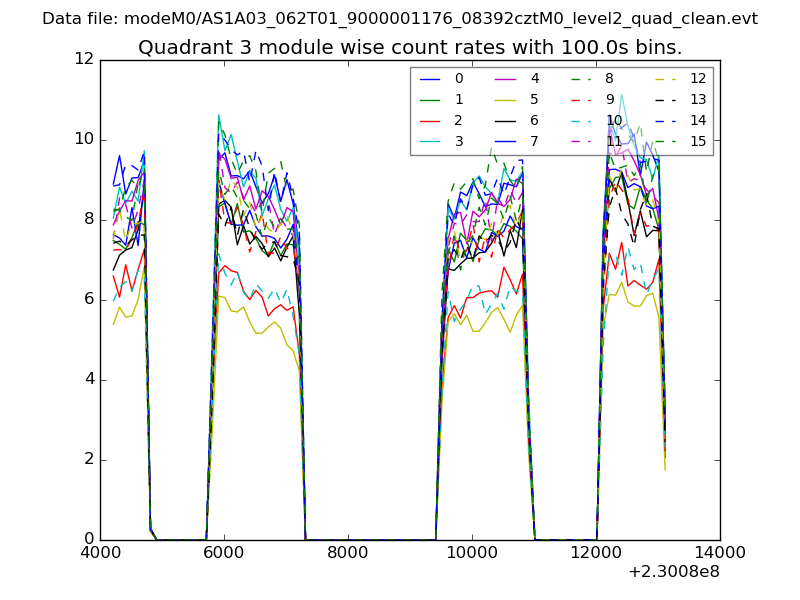
| Module-wise count rates for Quadrant D Data is divided into 100 sec bins |
 |
 |
| Parameter | Plot |
|---|---|
| CZT HV Monitor | 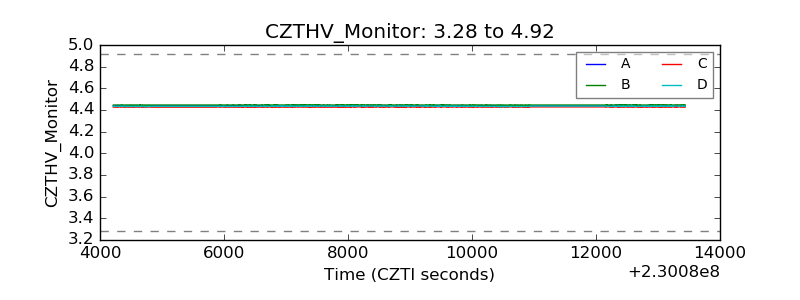 |
| D_VDD | 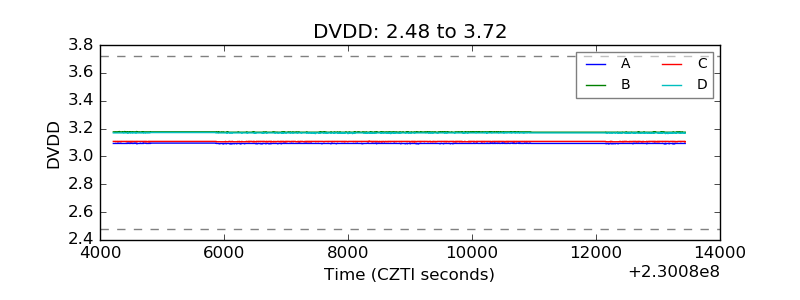 |
| Temperature 1 | 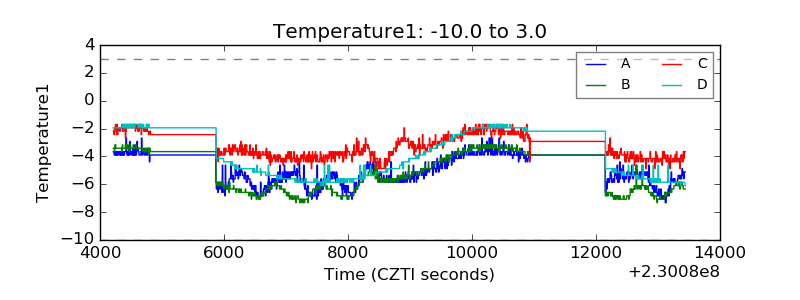 |
| Veto HV Monitor |  |
| Veto LLD | 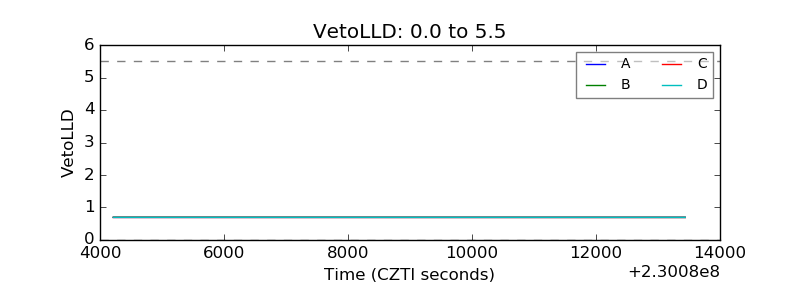 |
| Alpha Counter | 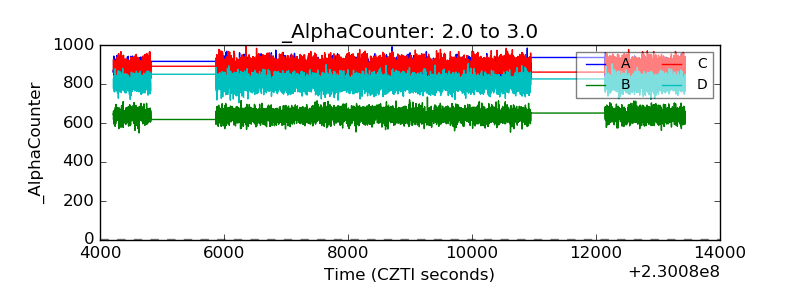 |
| _CPM_Rate | 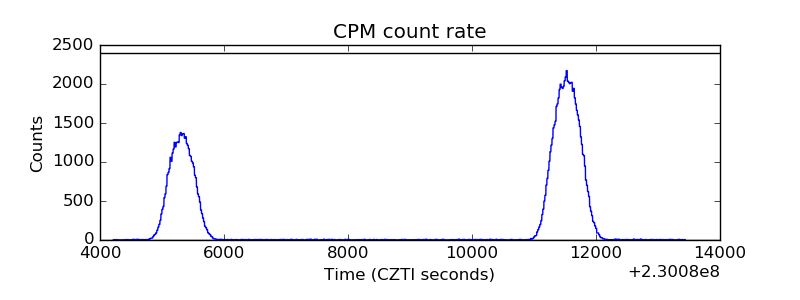 |
| CZT Counter | 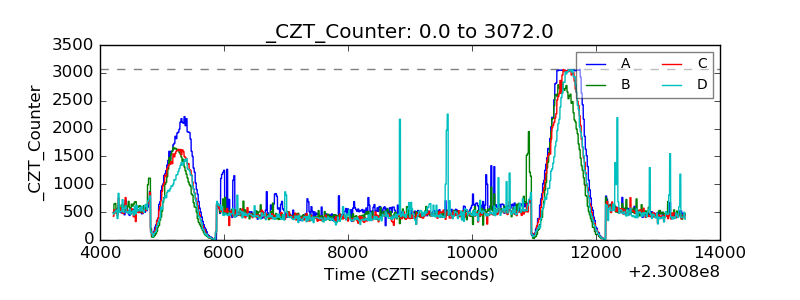 |
| +2.5 Volts monitor | 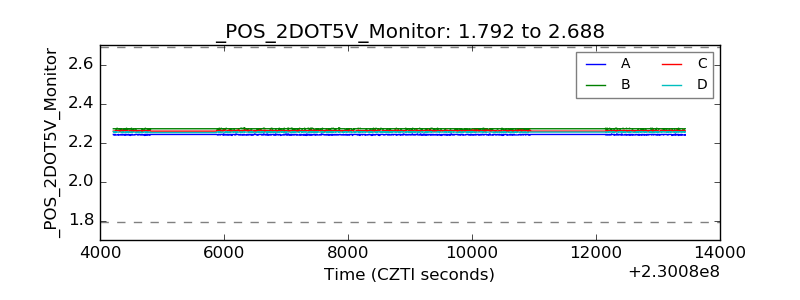 |
| +5 Volts monitor | 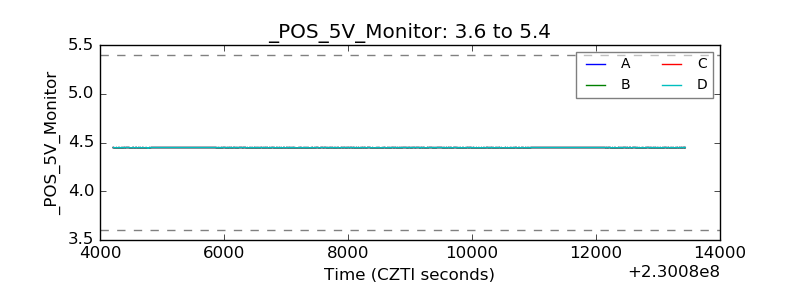 |
| _ROLL_ROT | 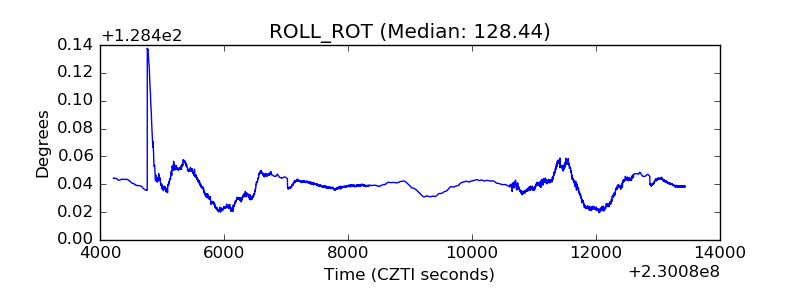 |
| _Roll_DEC | 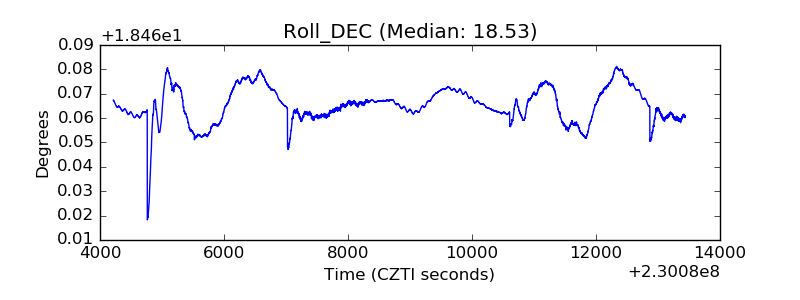 |
| _Roll_RA | 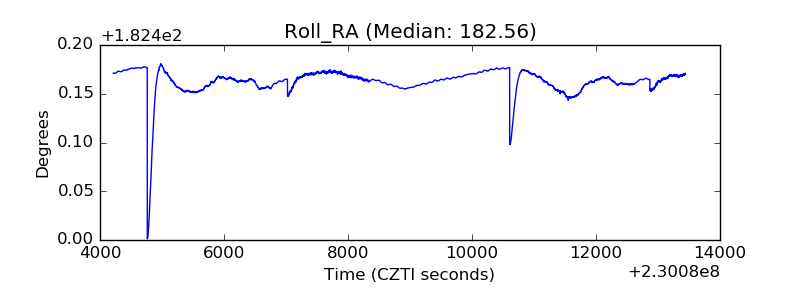 |
| Veto Counter | 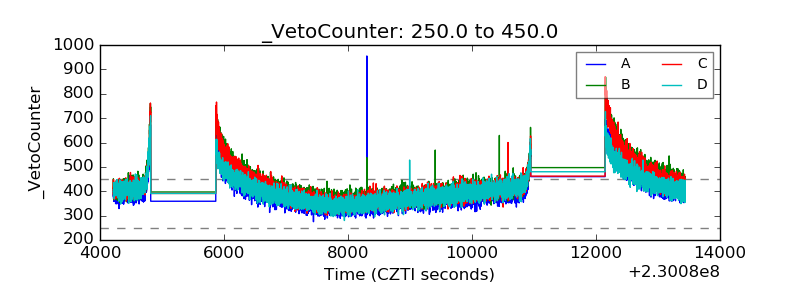 |