| Param | Original file | Final file |
|---|---|---|
| Filename | modeM0/AS1A03_062T01_9000001176_08393cztM0_level2.evt | modeM0/AS1A03_062T01_9000001176_08393cztM0_level2_quad_clean.evt |
| Size (bytes) | 431,746,560 | 76,691,520 |
| Size | 411.7 MB | 73.1 MB |
| Events in quadrant A | 2,990,816 | 479,608 |
| Events in quadrant B | 3,096,229 | 491,050 |
| Events in quadrant C | 2,924,865 | 470,235 |
| Events in quadrant D | 3,645,031 | 451,407 |
| Mode M0 | |||
|---|---|---|---|
| Quadrant | BADHDUFLAG | Total packets | Discarded packets |
| A | 0 | 12697 | 3 |
| B | 0 | 13002 | 2 |
| C | 0 | 12639 | 2 |
| D | 0 | 14877 | 2 |
| Mode SS | |||
|---|---|---|---|
| Quadrant | BADHDUFLAG | Total packets | Discarded packets |
| A | 0 | 126 | 0 |
| B | 0 | 126 | 0 |
| C | 0 | 126 | 0 |
| D | 0 | 126 | 0 |
| Mode M9 | |||
|---|---|---|---|
| Quadrant | BADHDUFLAG | Total packets | Discarded packets |
| A | 0 | 18 | 0 |
| B | 0 | 18 | 0 |
| C | 0 | 18 | 0 |
| D | 0 | 19 | 0 |
| Quadrant | Total seconds | Saturated seconds | Saturation percentage |
|---|---|---|---|
| A | 6155 | 21 | 0.341186% |
| B | 6155 | 29 | 0.471162% |
| C | 6155 | 8 | 0.129976% |
| D | 6155 | 102 | 1.657189% |
Noise dominated data is calculated using 1-second bins in cleaned event files. If a bin has >2000 counts, and if more than 50% of those come from <1% of pixels, then it is considered to be noise-dominated and hence unusable.
| Quadrant | # 1 sec bins | Bins with >0 counts | Bins with >2000 counts | High rate bins dominated by noise | Noise dominated (total time) | Noise dominated (detector-on time) | Marked lightcurve |
|---|---|---|---|---|---|---|---|
| A | 7425 | 6156 | 0 | 0 | 0.00% | 0.00% | 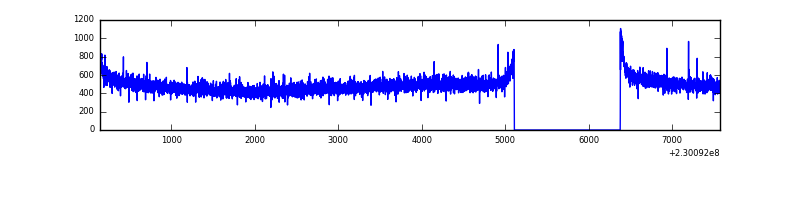 |
| B | 7425 | 6156 | 1 | 1 | 0.01% | 0.02% | 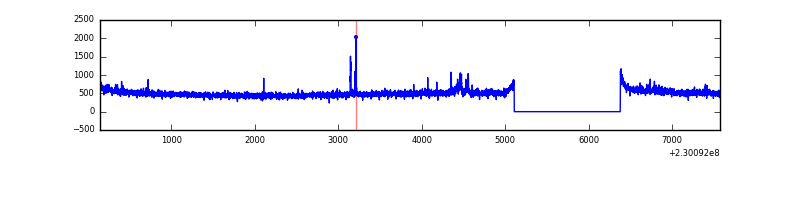 |
| C | 7425 | 6156 | 1 | 1 | 0.01% | 0.02% | 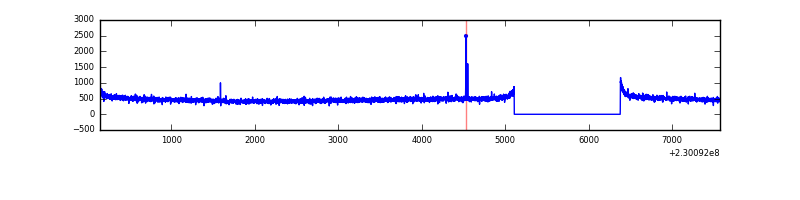 |
| D | 7425 | 6156 | 76 | 76 | 1.02% | 1.23% | 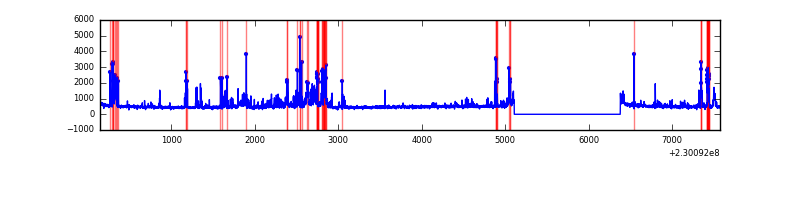 |
Top three noisy pixels from each quadrant. If the there are fewer than three noisy pixels in the level2.evt file, extra rows are filled as -1
| Pixel properties | Quadrant properties | ||||||
|---|---|---|---|---|---|---|---|
| Quadrant | DetID | PixID | Counts | Sigma | Mean | Median | Sigma |
| A | 0 | 226 | 7278 | 41.2 | 776 | 759 | 158.2 |
| A | 12 | 194 | 6793 | 38.14 | 776 | 759 | 158.2 |
| A | 14 | 111 | 4834 | 25.75 | 776 | 759 | 158.2 |
| B | 10 | 252 | 29656 | 195.56 | 779 | 760 | 147.8 |
| B | 4 | 81 | 22310 | 145.84 | 779 | 760 | 147.8 |
| B | 0 | 213 | 18463 | 119.81 | 779 | 760 | 147.8 |
| C | 1 | 16 | 14007 | 76.55 | 746 | 750 | 173.2 |
| C | 13 | 61 | 5789 | 29.1 | 746 | 750 | 173.2 |
| C | 3 | 202 | 1871 | 6.47 | 746 | 750 | 173.2 |
| D | 2 | 14 | 456657 | 2580.33 | 735 | 718 | 176.7 |
| D | 2 | 136 | 267359 | 1509.02 | 735 | 718 | 176.7 |
| D | 12 | 233 | 56955 | 318.27 | 735 | 718 | 176.7 |
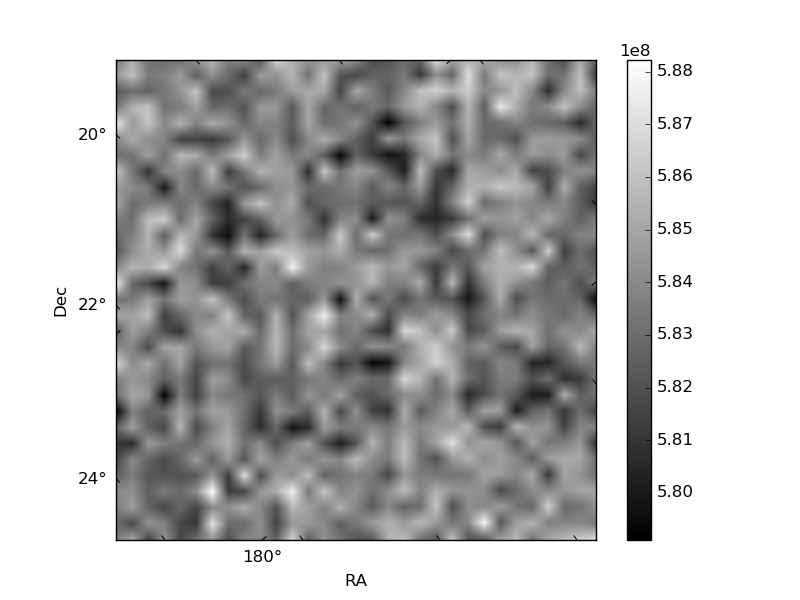
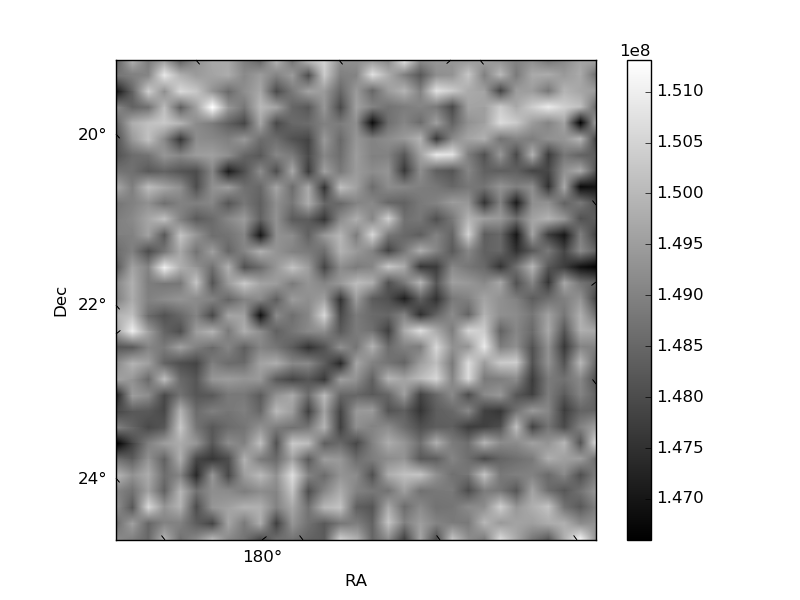
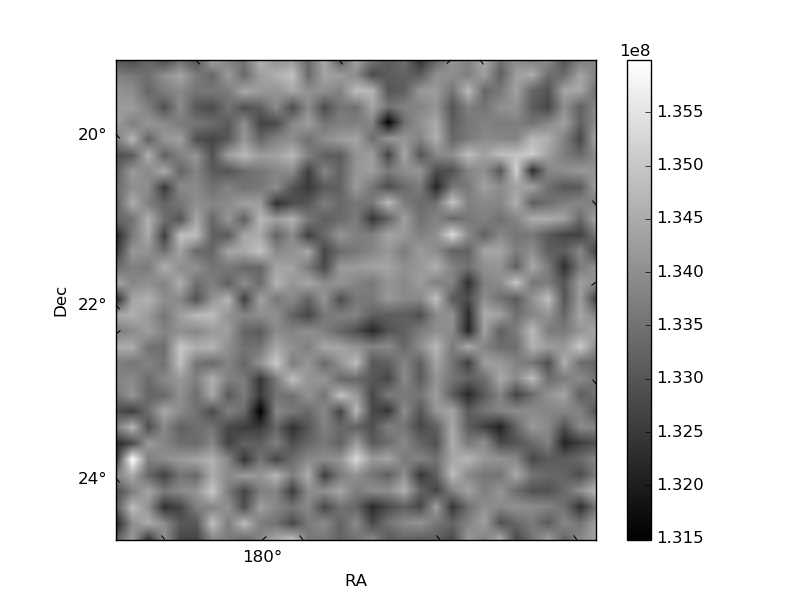
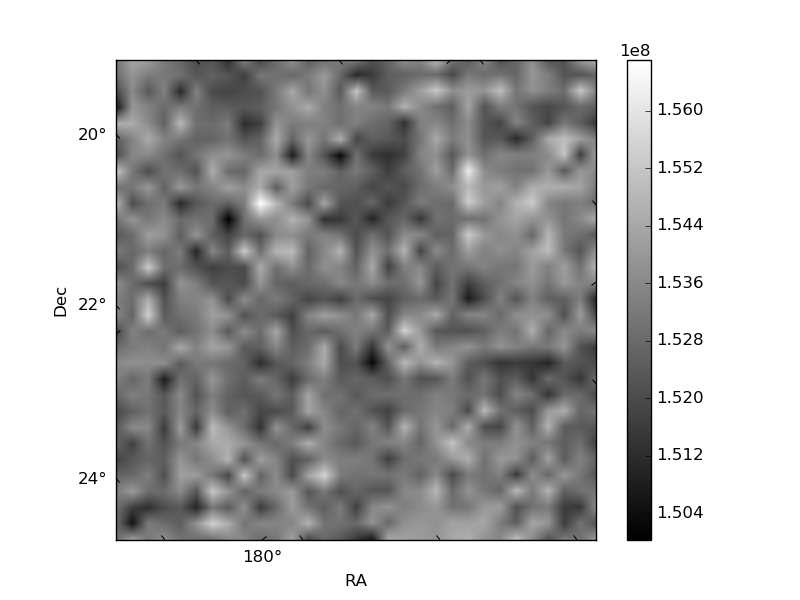
Histogram calculated using DETX and DETY for each event in the final _common_clean file
| Quadrant A | 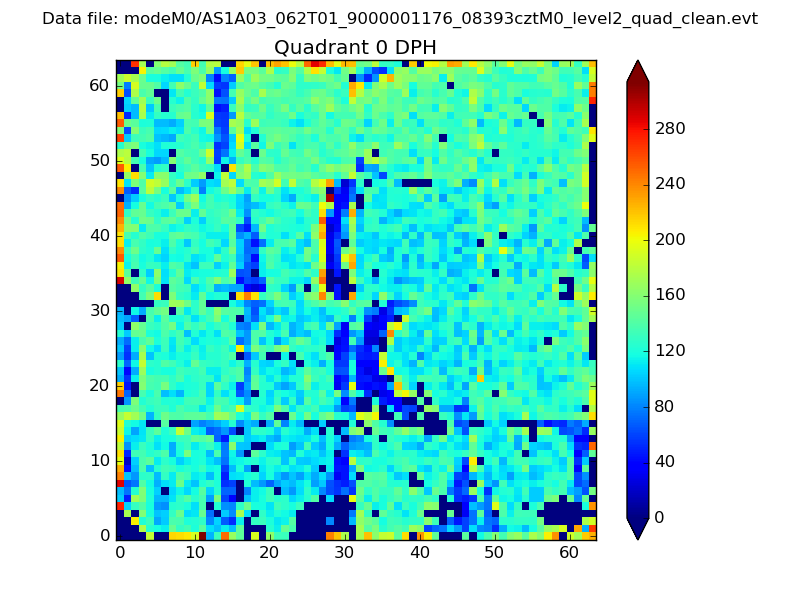 |
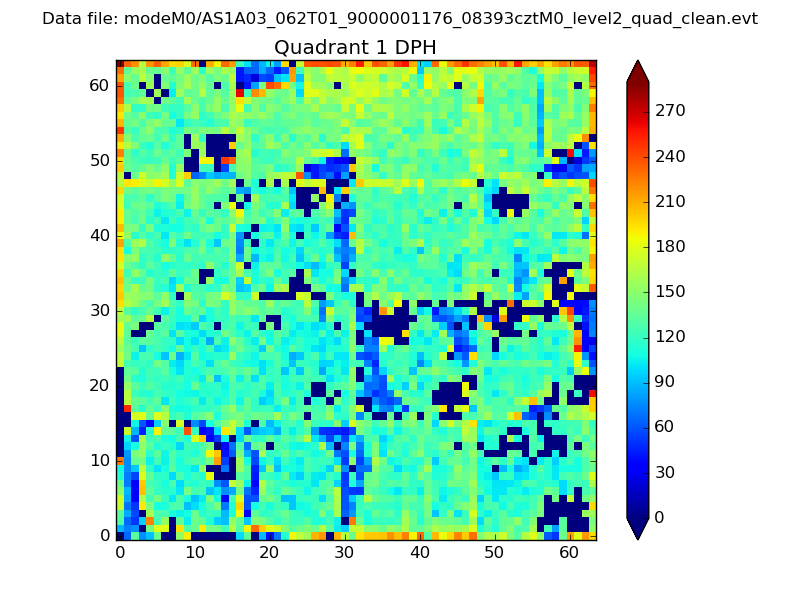 |
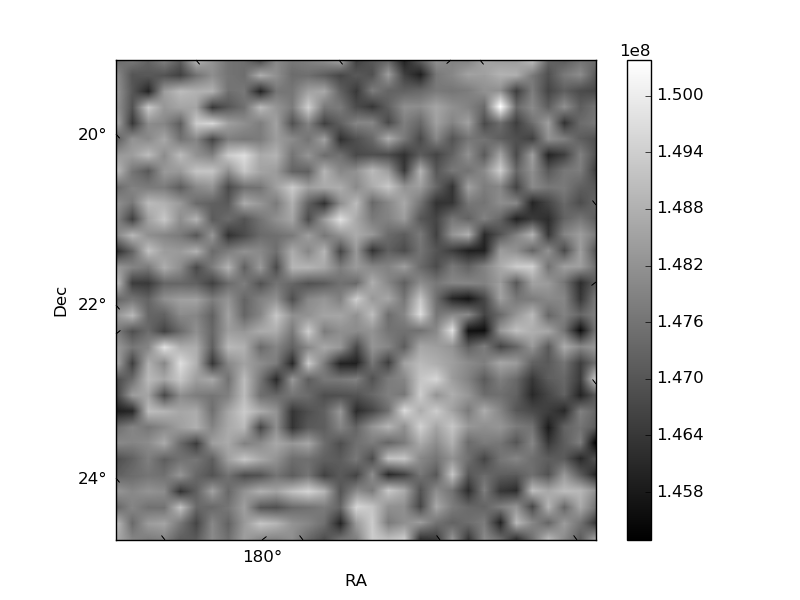
Quadrant B |
|---|---|---|---|
| Quadrant D | 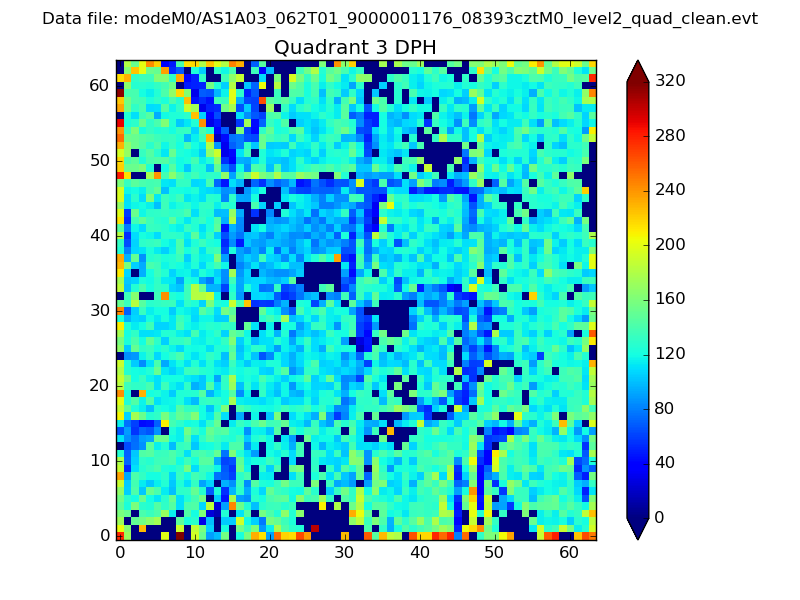 |
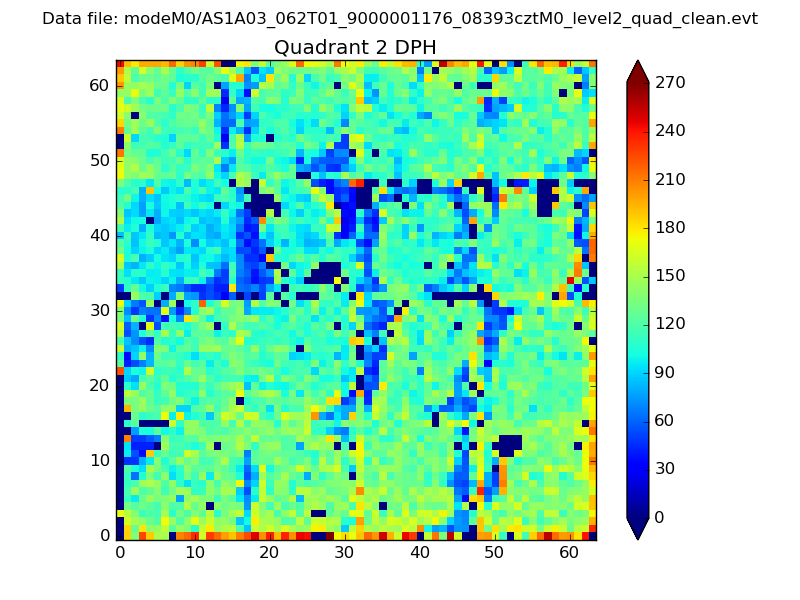 |
Quadrant C |
| Plot type | Count rate plots | Images |
|---|---|---|
| Comparison with Poisson distribution Blue bars denote a histogram of data divided into 1 sec bins. Red curve is a Poisson curve with rate = median count rate of data. |
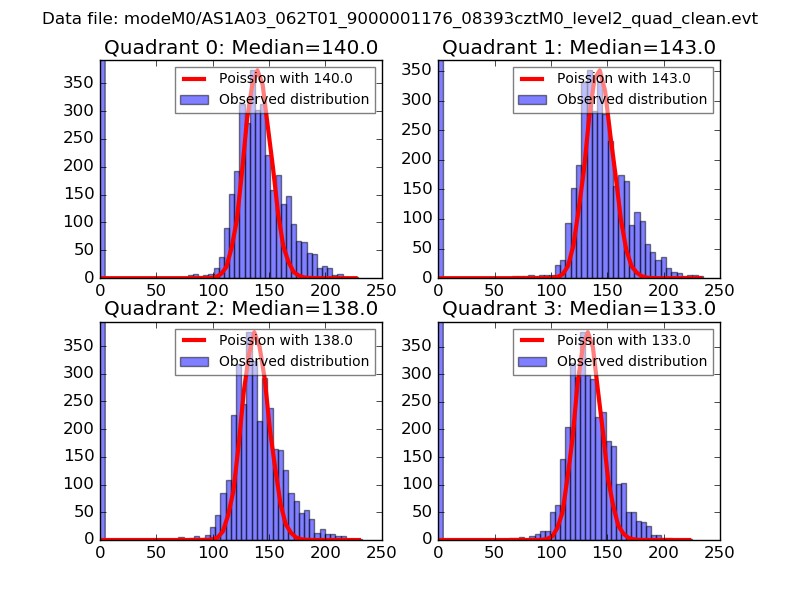 |
 |
| Quadrant-wise count rates Data is divided into 100 sec bins |
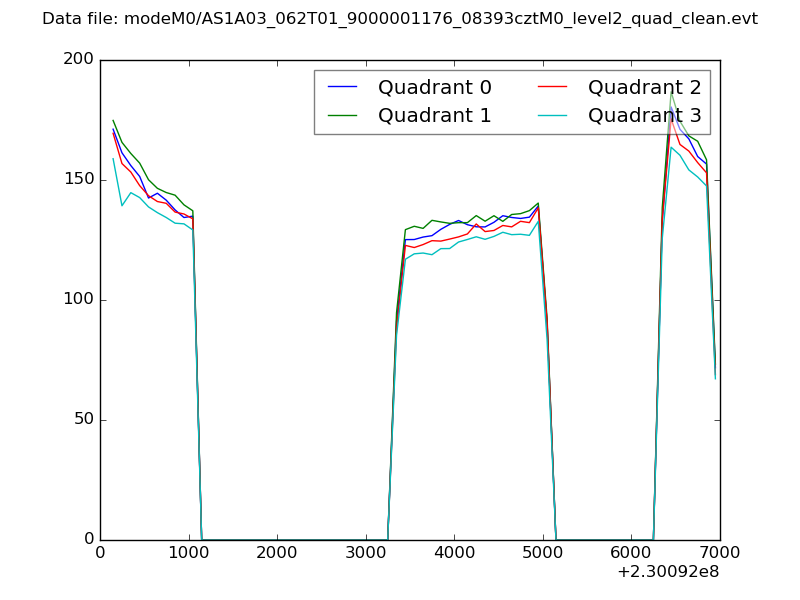 |
|
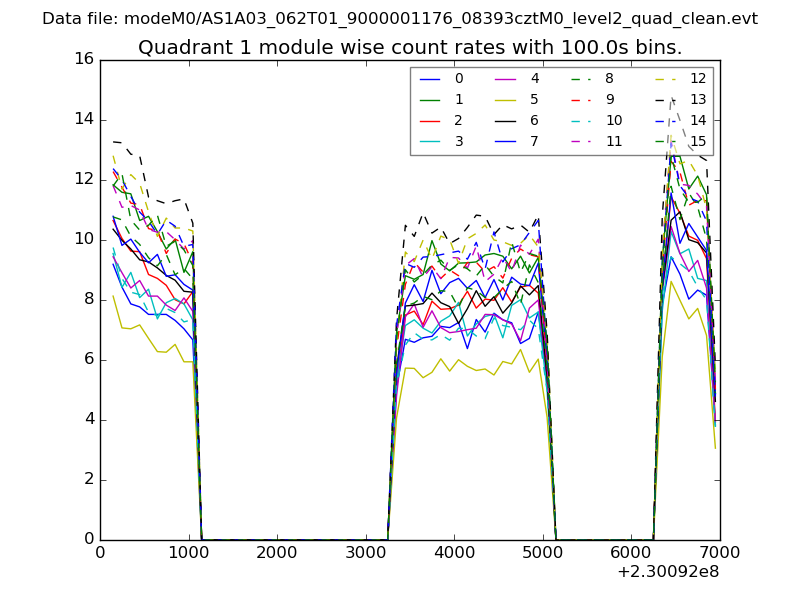
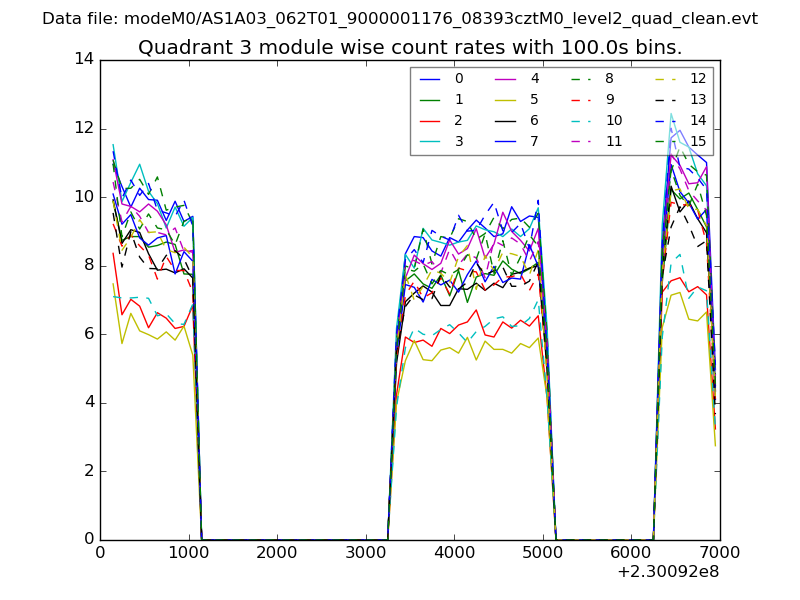
| Module-wise count rates for Quadrant A Data is divided into 100 sec bins |
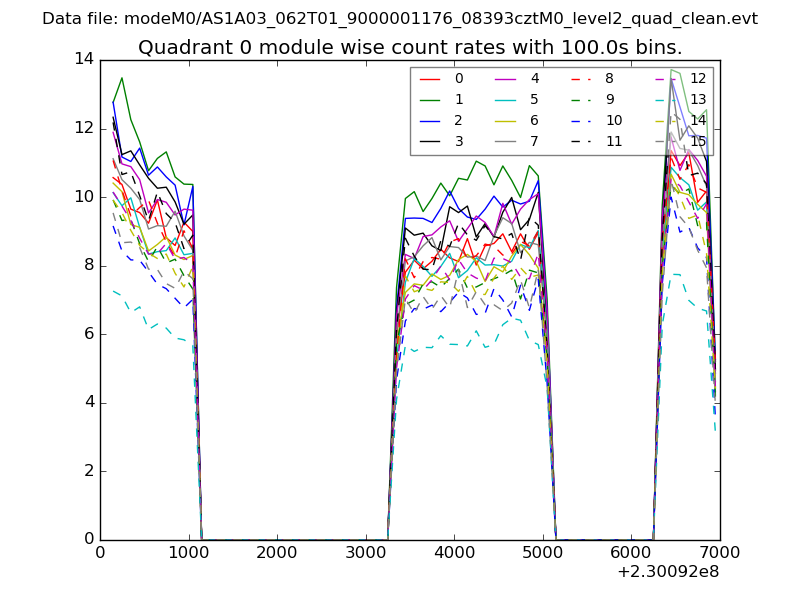 |
 |
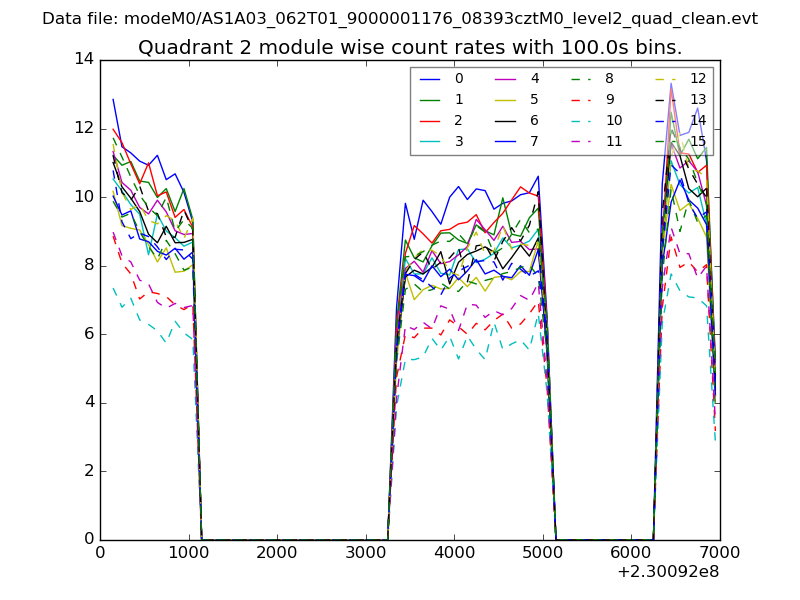
| Module-wise count rates for Quadrant B Data is divided into 100 sec bins |
 |
 |
| Module-wise count rates for Quadrant C Data is divided into 100 sec bins |
 |
 |
| Module-wise count rates for Quadrant D Data is divided into 100 sec bins |
 |
 |
| Parameter | Plot |
|---|---|
| CZT HV Monitor | 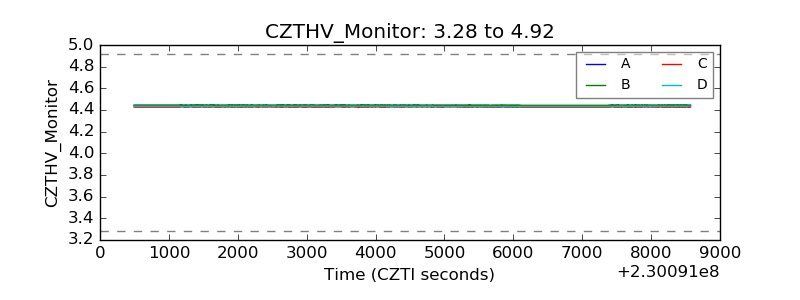 |
| D_VDD | 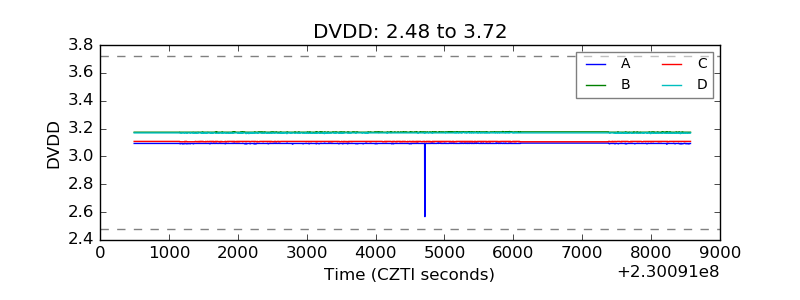 |
| Temperature 1 | 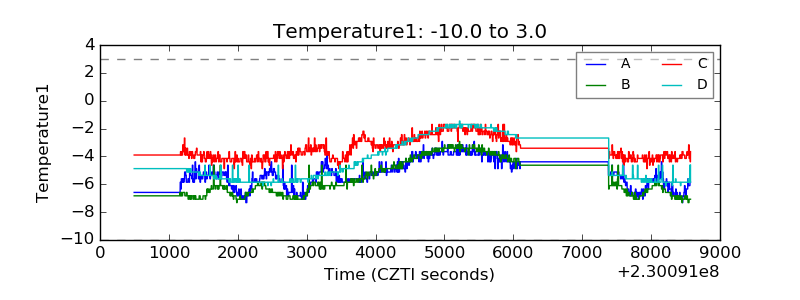 |
| Veto HV Monitor | 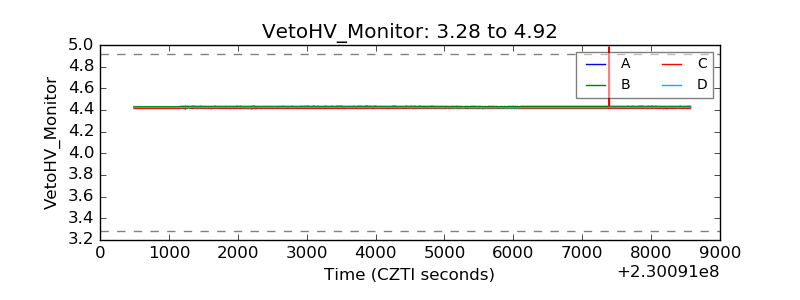 |
| Veto LLD | 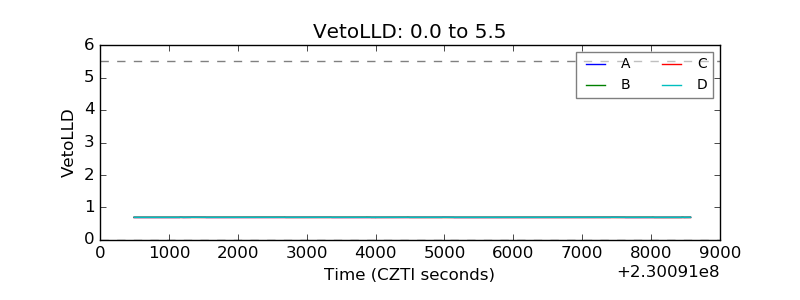 |
| Alpha Counter | 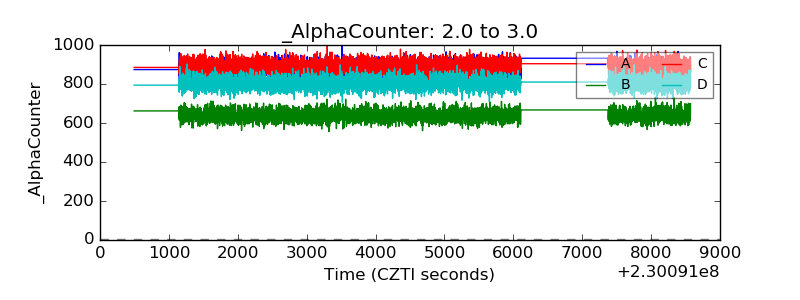 |
| _CPM_Rate | 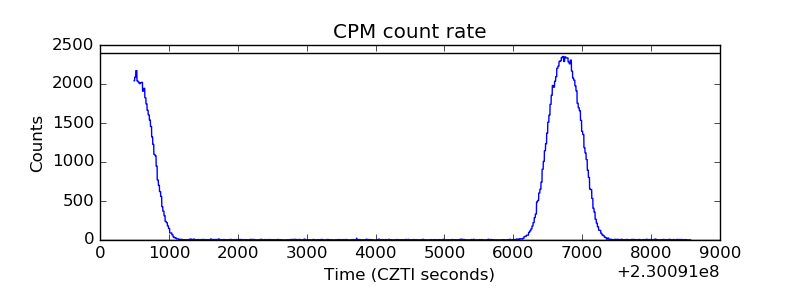 |
| CZT Counter | 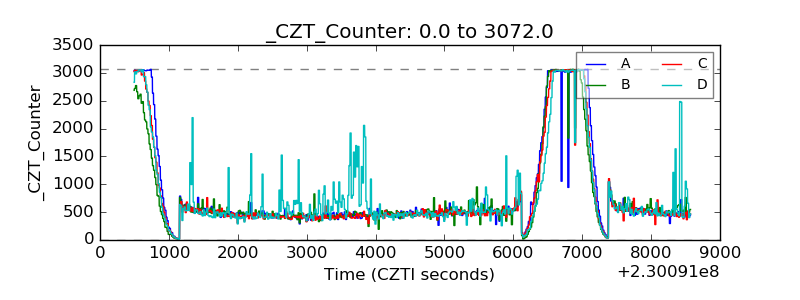 |
| +2.5 Volts monitor | 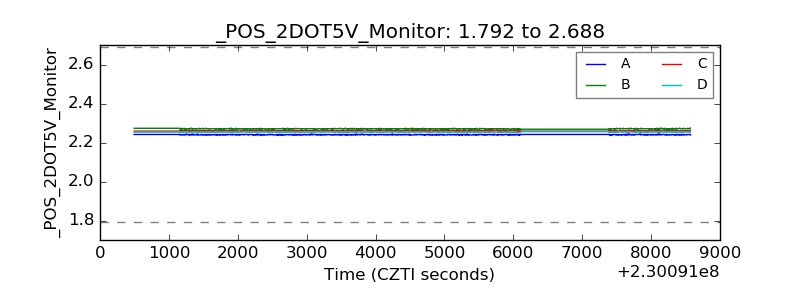 |
| +5 Volts monitor | 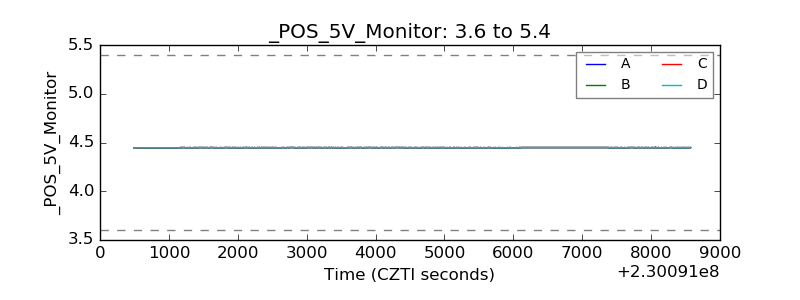 |
| _ROLL_ROT | 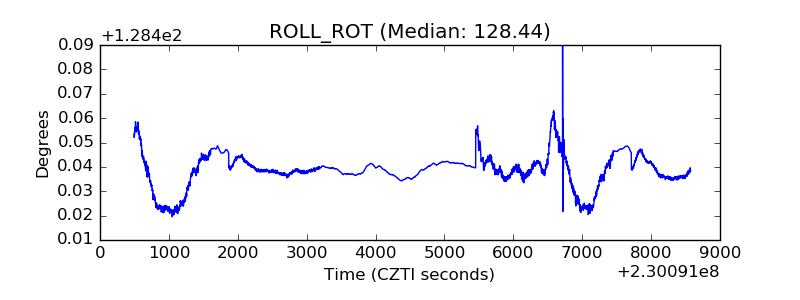 |
| _Roll_DEC | 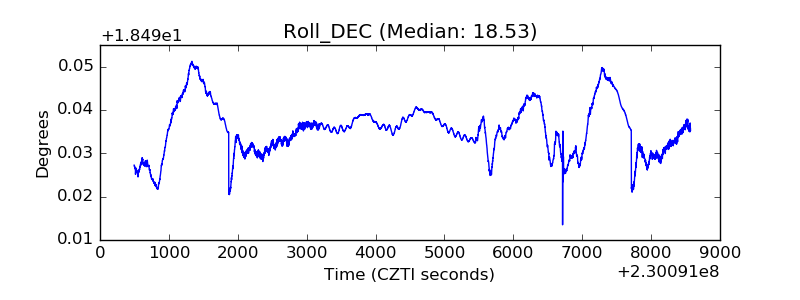 |
| _Roll_RA | 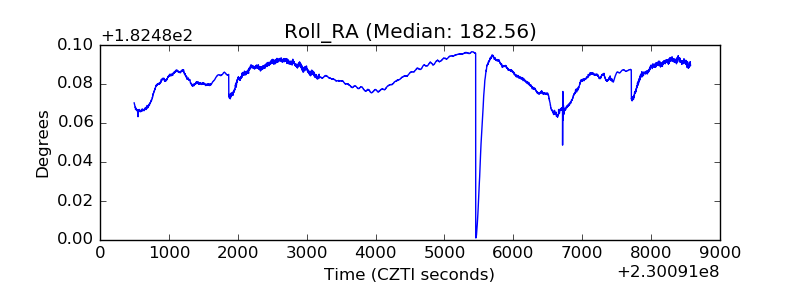 |
| Veto Counter | 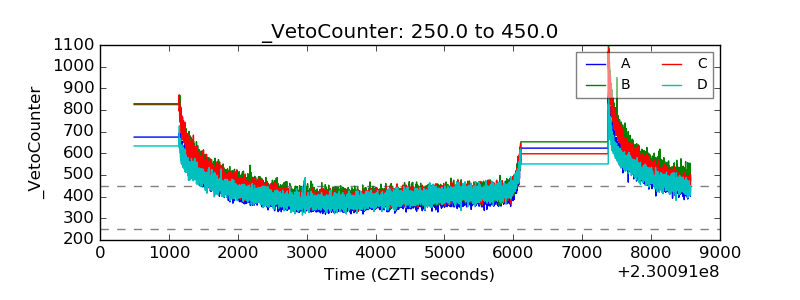 |