| Param | Original file | Final file |
|---|---|---|
| Filename | modeM0/AS1A03_062T01_9000001176_08394cztM0_level2.evt | modeM0/AS1A03_062T01_9000001176_08394cztM0_level2_quad_clean.evt |
| Size (bytes) | 435,695,040 | 69,811,200 |
| Size | 415.5 MB | 66.6 MB |
| Events in quadrant A | 3,124,925 | 426,842 |
| Events in quadrant B | 3,253,955 | 436,539 |
| Events in quadrant C | 3,047,506 | 417,249 |
| Events in quadrant D | 3,348,966 | 402,058 |
| Mode M0 | |||
|---|---|---|---|
| Quadrant | BADHDUFLAG | Total packets | Discarded packets |
| A | 0 | 12896 | 3 |
| B | 0 | 13256 | 2 |
| C | 0 | 12842 | 2 |
| D | 0 | 13897 | 2 |
| Mode SS | |||
|---|---|---|---|
| Quadrant | BADHDUFLAG | Total packets | Discarded packets |
| A | 0 | 128 | 0 |
| B | 0 | 128 | 0 |
| C | 0 | 128 | 0 |
| D | 0 | 128 | 0 |
| Mode M9 | |||
|---|---|---|---|
| Quadrant | BADHDUFLAG | Total packets | Discarded packets |
| A | 0 | 26 | 0 |
| B | 0 | 26 | 0 |
| C | 0 | 26 | 0 |
| D | 0 | 26 | 0 |
| Quadrant | Total seconds | Saturated seconds | Saturation percentage |
|---|---|---|---|
| A | 6175 | 37 | 0.599190% |
| B | 6175 | 57 | 0.923077% |
| C | 6175 | 16 | 0.259109% |
| D | 6175 | 72 | 1.165992% |
Noise dominated data is calculated using 1-second bins in cleaned event files. If a bin has >2000 counts, and if more than 50% of those come from <1% of pixels, then it is considered to be noise-dominated and hence unusable.
| Quadrant | # 1 sec bins | Bins with >0 counts | Bins with >2000 counts | High rate bins dominated by noise | Noise dominated (total time) | Noise dominated (detector-on time) | Marked lightcurve |
|---|---|---|---|---|---|---|---|
| A | 8790 | 6177 | 0 | 0 | 0.00% | 0.00% | 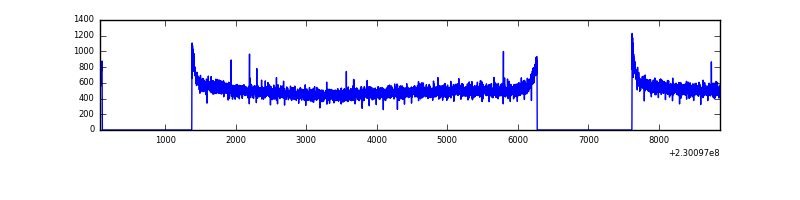 |
| B | 8790 | 6177 | 1 | 1 | 0.01% | 0.02% | 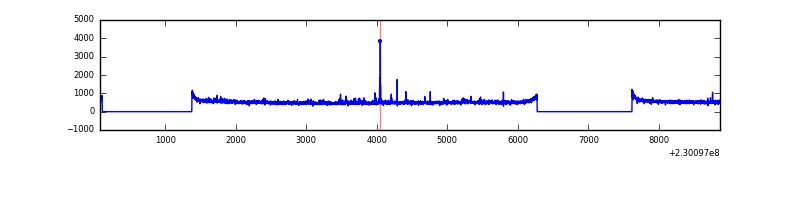 |
| C | 8790 | 6177 | 0 | 0 | 0.00% | 0.00% | 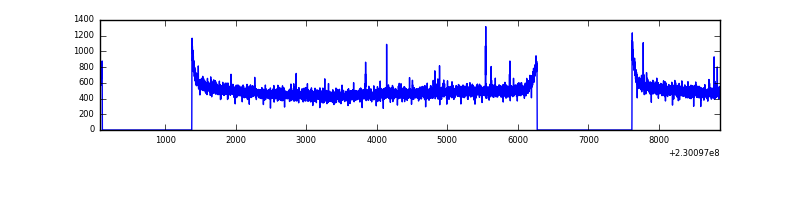 |
| D | 8790 | 6177 | 40 | 40 | 0.46% | 0.65% | 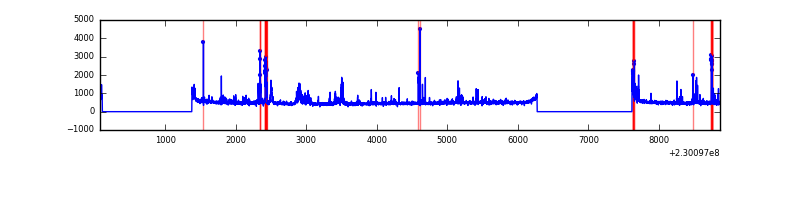 |
Top three noisy pixels from each quadrant. If the there are fewer than three noisy pixels in the level2.evt file, extra rows are filled as -1
| Pixel properties | Quadrant properties | ||||||
|---|---|---|---|---|---|---|---|
| Quadrant | DetID | PixID | Counts | Sigma | Mean | Median | Sigma |
| A | 13 | 14 | 8782 | 48.65 | 811 | 796 | 164.1 |
| A | 0 | 226 | 7575 | 41.3 | 811 | 796 | 164.1 |
| A | 12 | 194 | 7171 | 38.84 | 811 | 796 | 164.1 |
| B | 4 | 81 | 54027 | 347.91 | 815 | 796 | 153.0 |
| B | 10 | 252 | 21413 | 134.75 | 815 | 796 | 153.0 |
| B | 12 | 111 | 16692 | 103.9 | 815 | 796 | 153.0 |
| C | 1 | 16 | 14096 | 73.98 | 778 | 784 | 180.0 |
| C | 13 | 61 | 6030 | 29.15 | 778 | 784 | 180.0 |
| C | 3 | 202 | 1952 | 6.49 | 778 | 784 | 180.0 |
| D | 2 | 14 | 180436 | 974.89 | 767 | 748 | 184.3 |
| D | 2 | 136 | 173729 | 938.5 | 767 | 748 | 184.3 |
| D | 1 | 52 | 31467 | 166.66 | 767 | 748 | 184.3 |
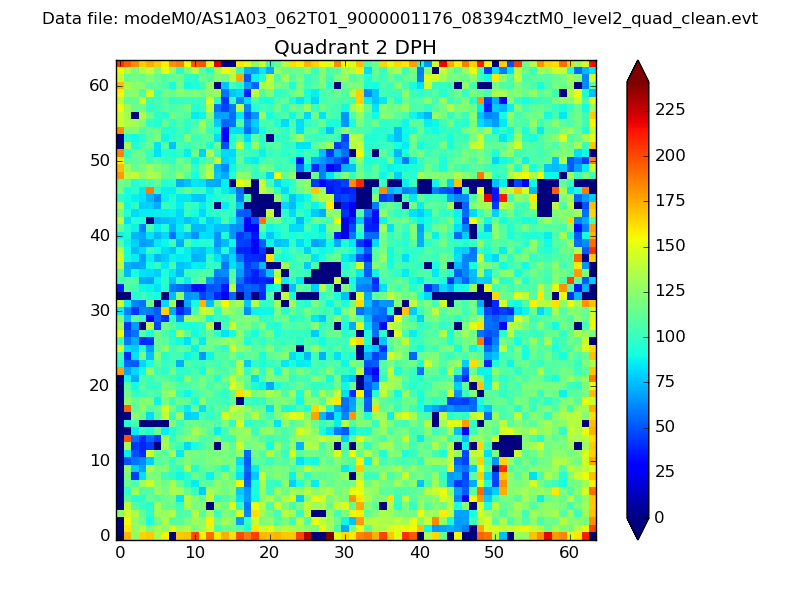
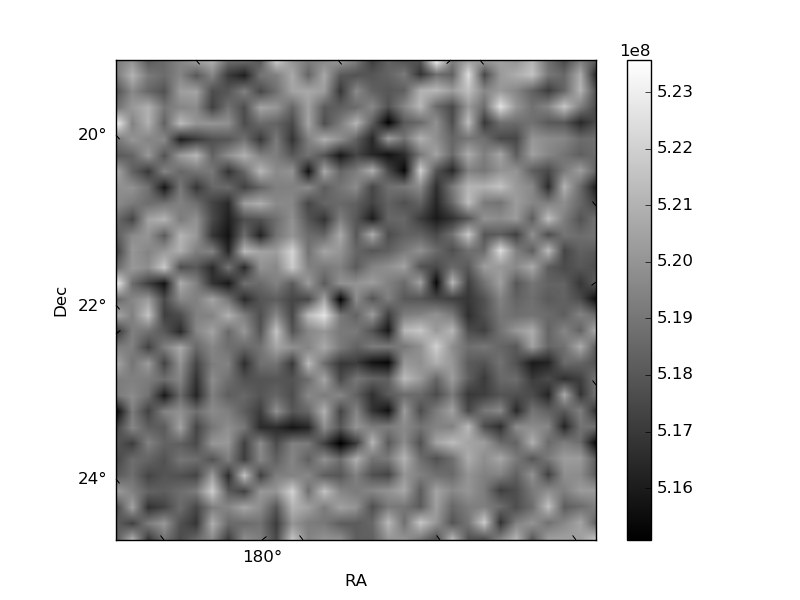
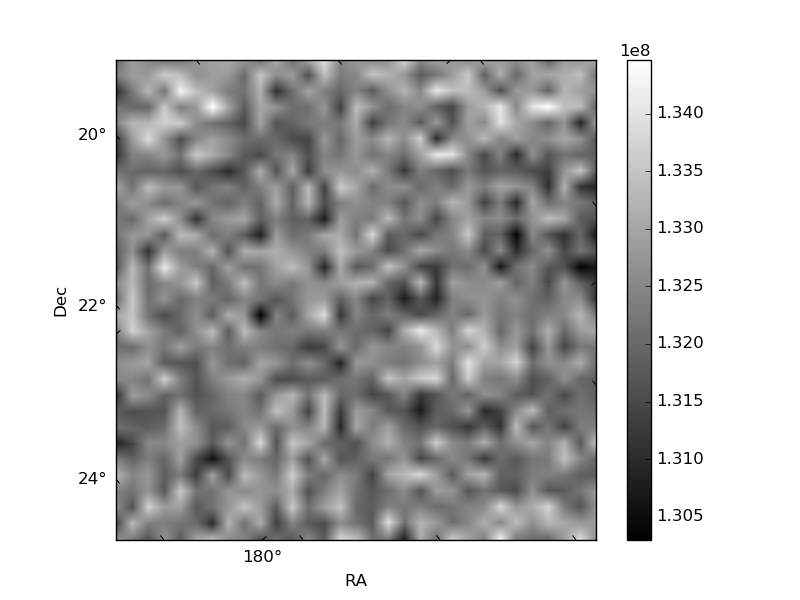
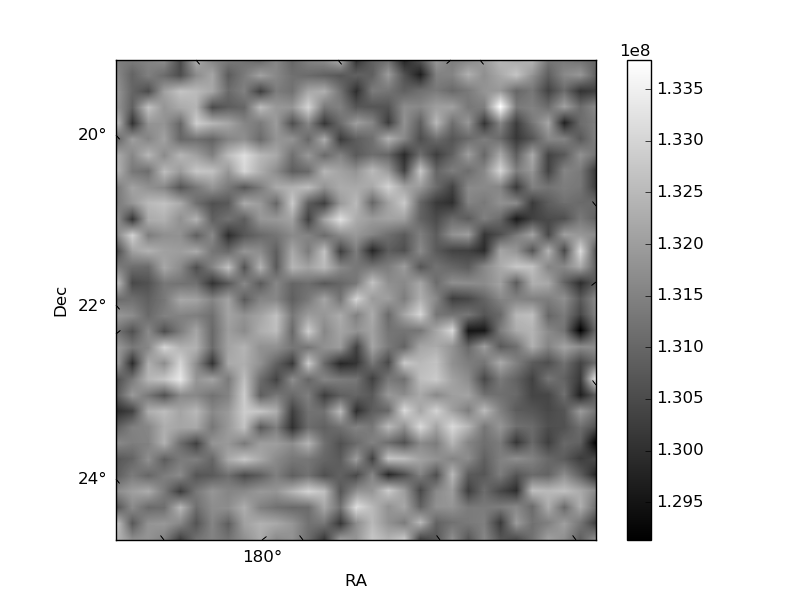
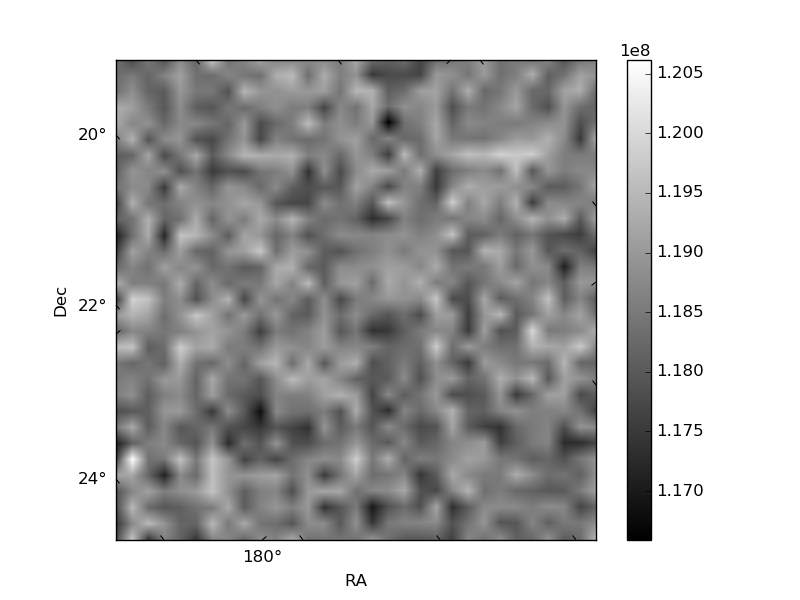
Histogram calculated using DETX and DETY for each event in the final _common_clean file
| Quadrant A | 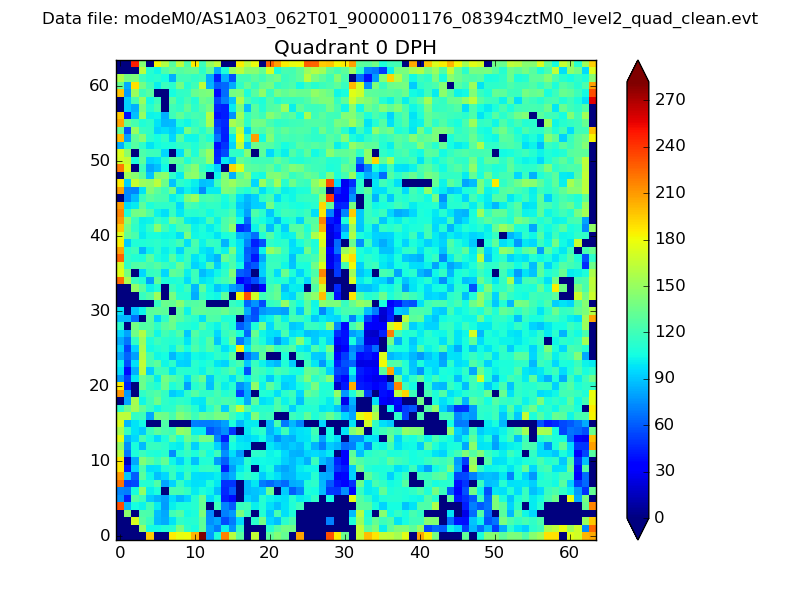 |
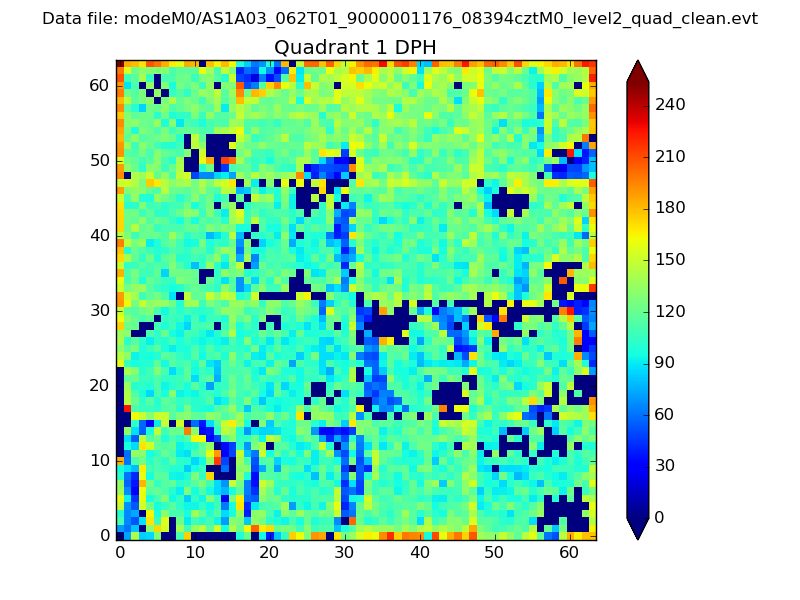 |
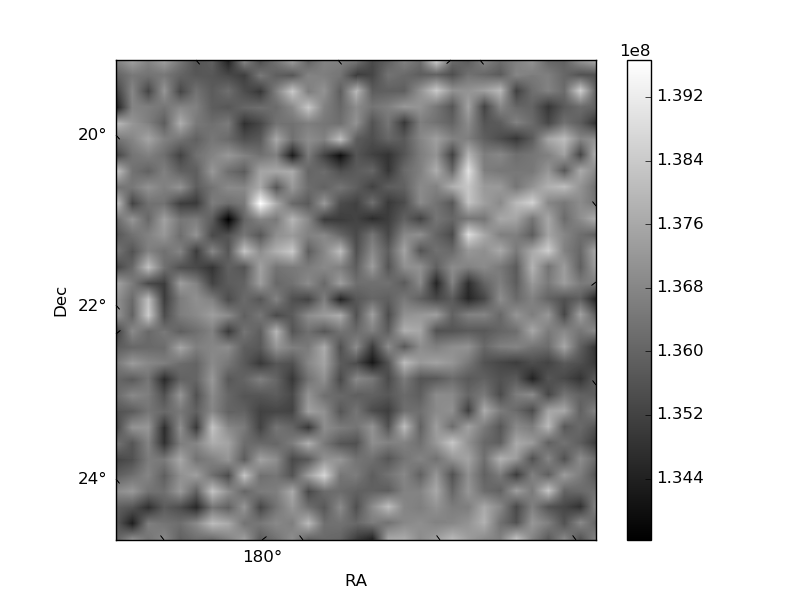
Quadrant B |
|---|---|---|---|
| Quadrant D | 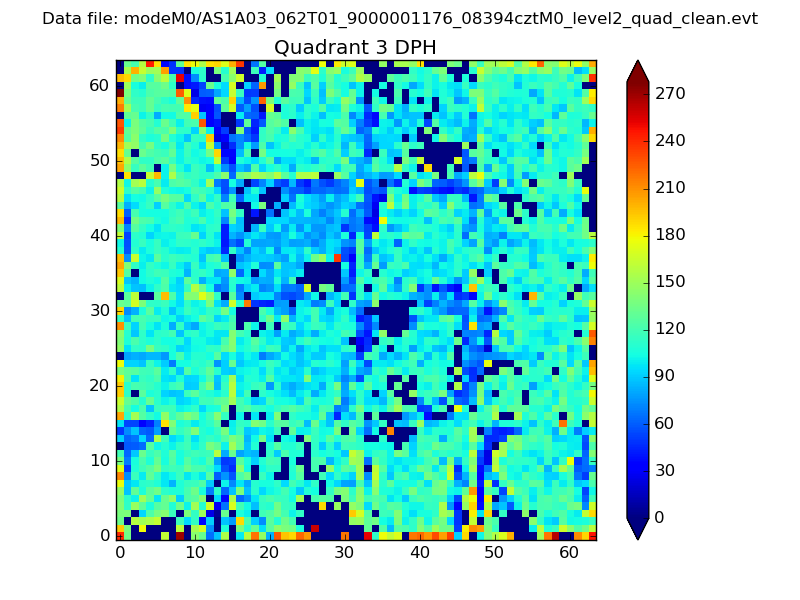 |
 |
Quadrant C |
| Plot type | Count rate plots | Images |
|---|---|---|
| Comparison with Poisson distribution Blue bars denote a histogram of data divided into 1 sec bins. Red curve is a Poisson curve with rate = median count rate of data. |
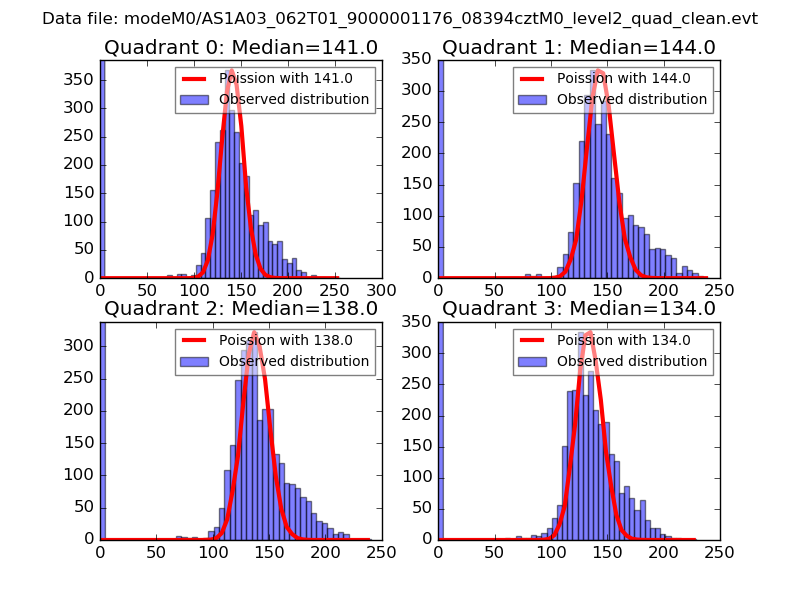 |
 |
| Quadrant-wise count rates Data is divided into 100 sec bins |
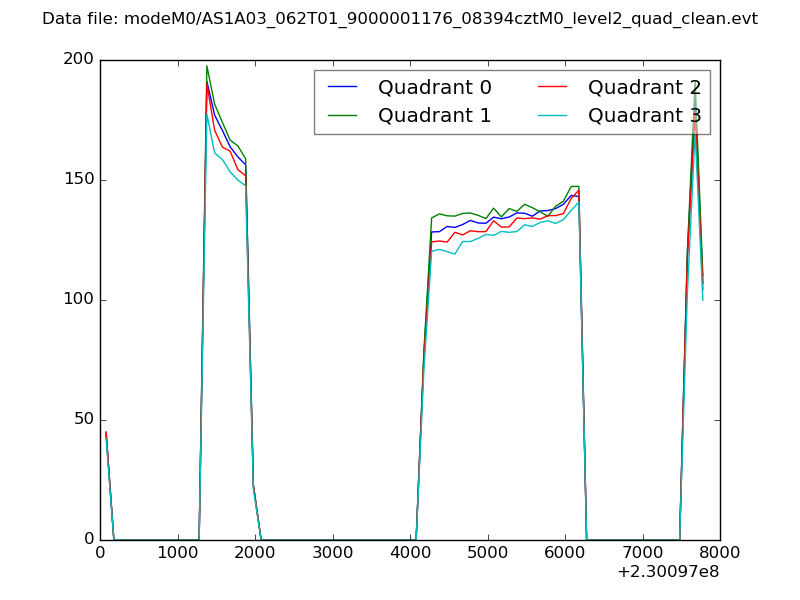 |
|
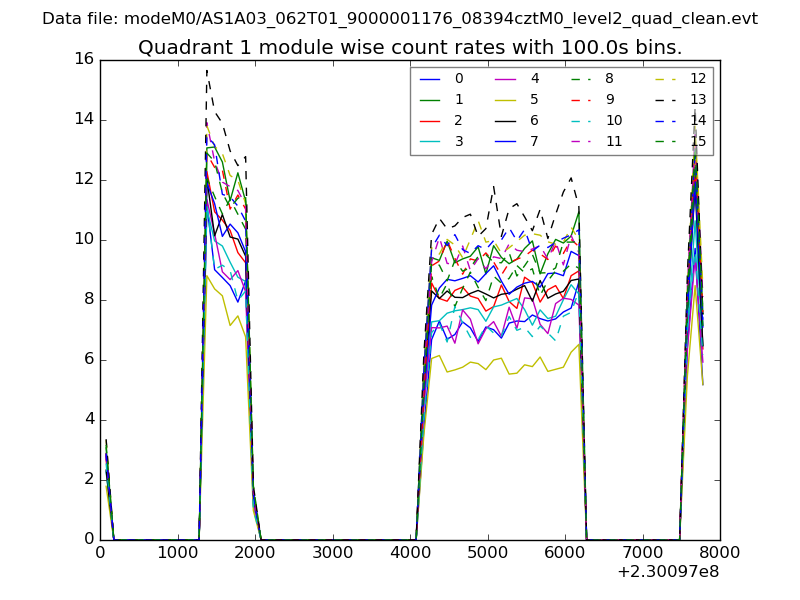
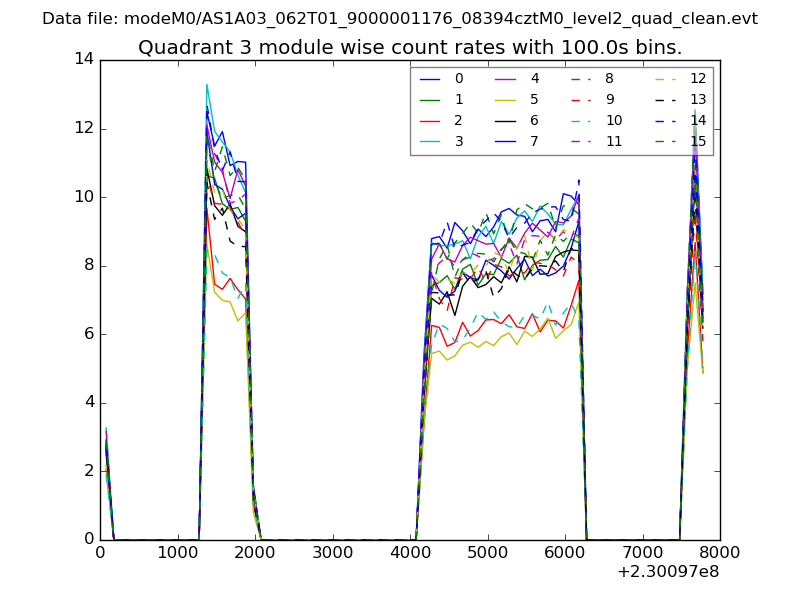
| Module-wise count rates for Quadrant A Data is divided into 100 sec bins |
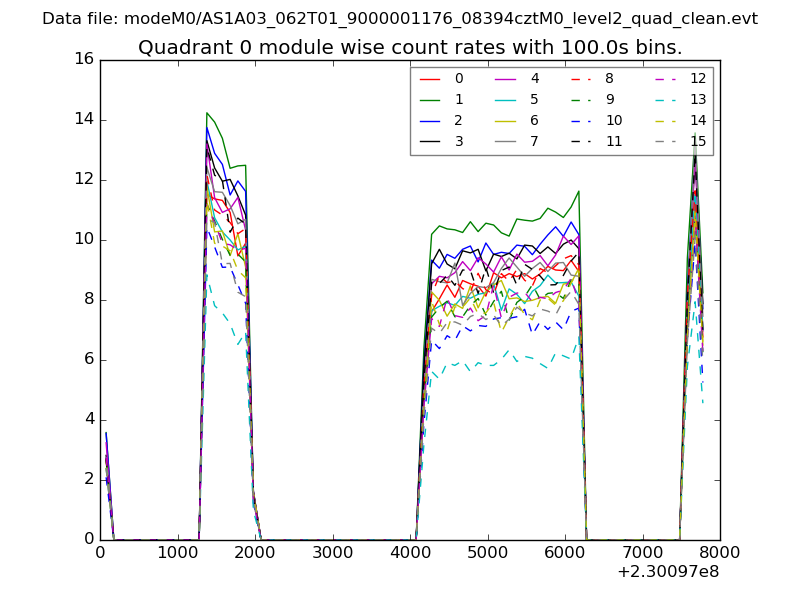 |
 |
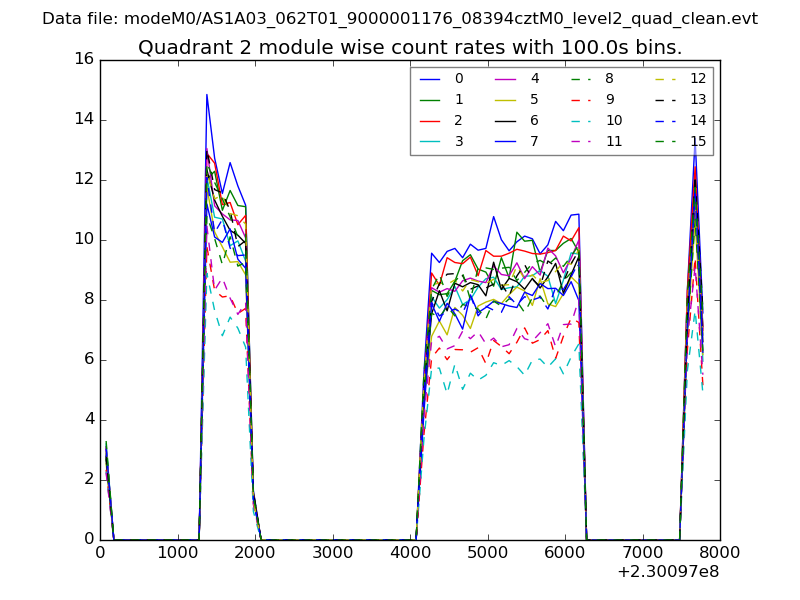
| Module-wise count rates for Quadrant B Data is divided into 100 sec bins |
 |
 |
| Module-wise count rates for Quadrant C Data is divided into 100 sec bins |
 |
 |
| Module-wise count rates for Quadrant D Data is divided into 100 sec bins |
 |
 |
| Parameter | Plot |
|---|---|
| CZT HV Monitor | 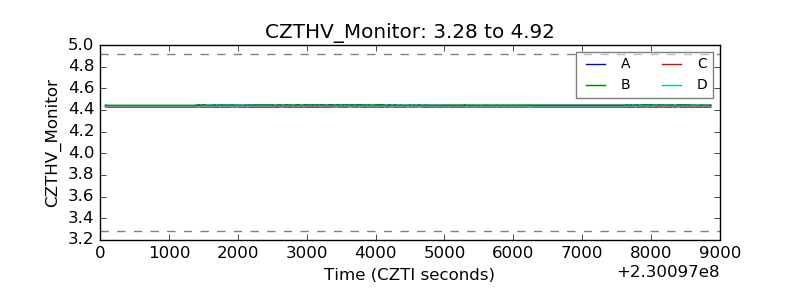 |
| D_VDD |  |
| Temperature 1 | 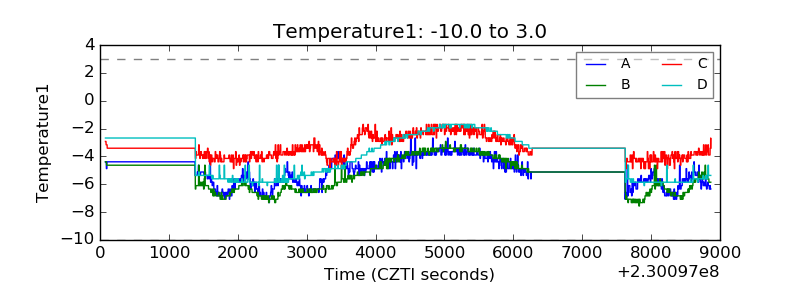 |
| Veto HV Monitor | 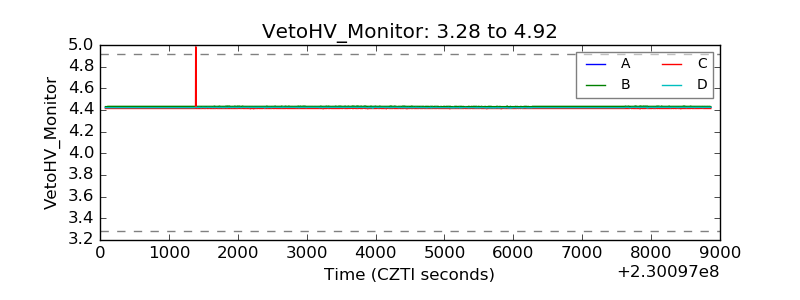 |
| Veto LLD | 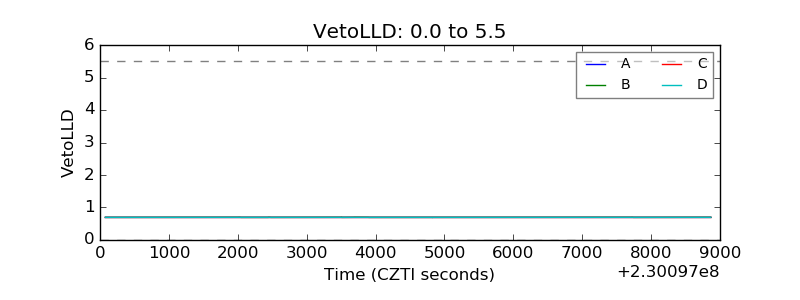 |
| Alpha Counter | 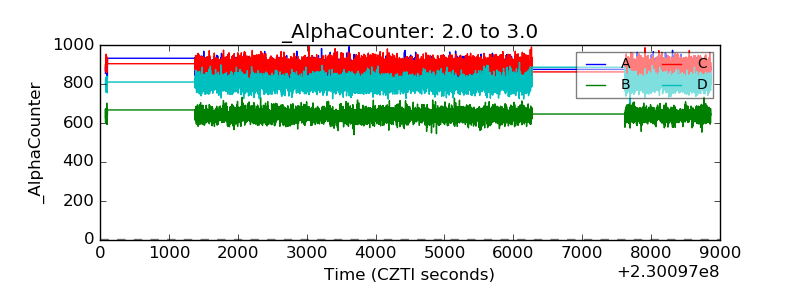 |
| _CPM_Rate | 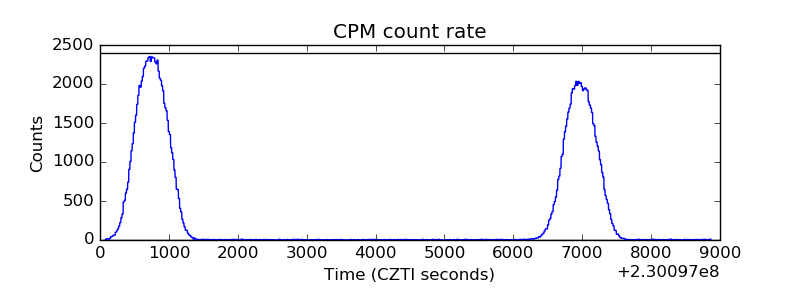 |
| CZT Counter | 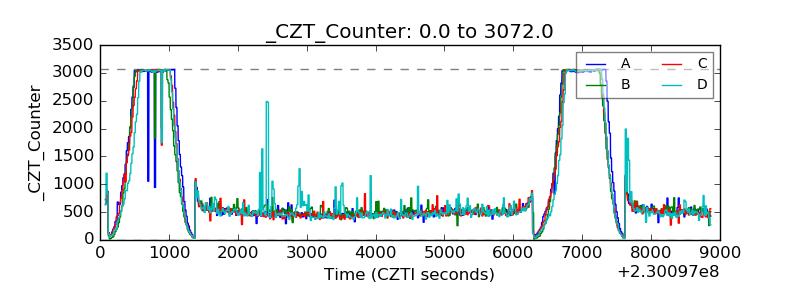 |
| +2.5 Volts monitor |  |
| +5 Volts monitor |  |
| _ROLL_ROT | 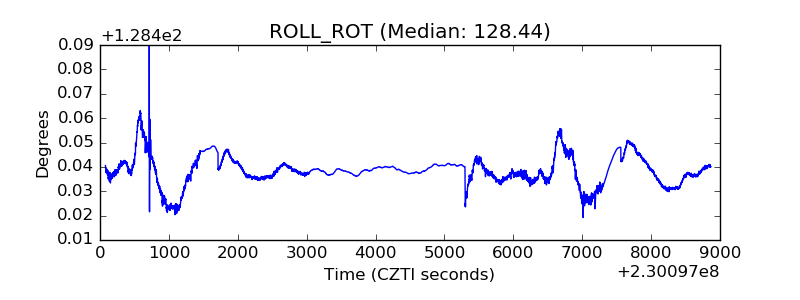 |
| _Roll_DEC | 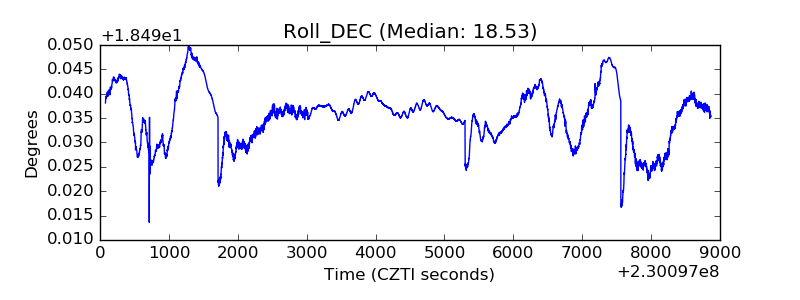 |
| _Roll_RA | 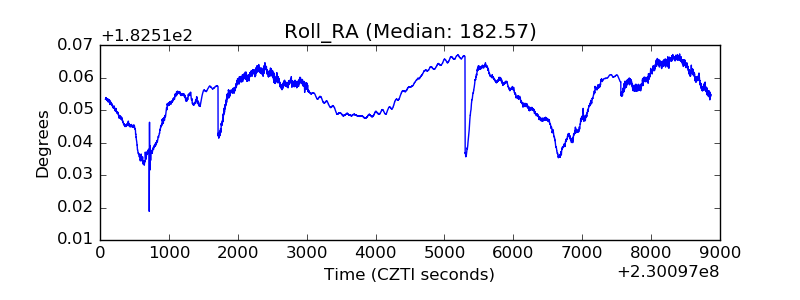 |
| Veto Counter | 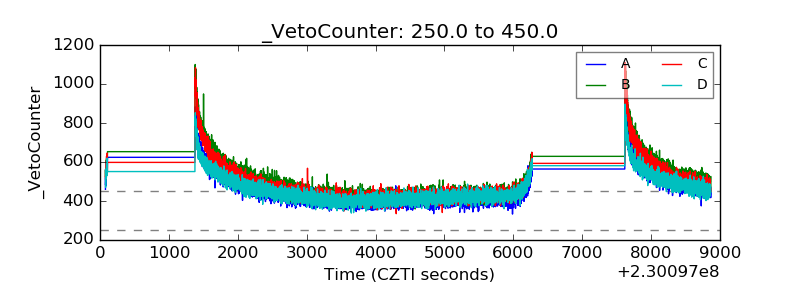 |