| Param | Original file | Final file |
|---|---|---|
| Filename | modeM0/AS1A03_062T01_9000001176_08395cztM0_level2.evt | modeM0/AS1A03_062T01_9000001176_08395cztM0_level2_quad_clean.evt |
| Size (bytes) | 443,036,160 | 62,991,360 |
| Size | 422.5 MB | 60.1 MB |
| Events in quadrant A | 3,145,878 | 374,101 |
| Events in quadrant B | 3,290,770 | 380,940 |
| Events in quadrant C | 3,099,917 | 366,735 |
| Events in quadrant D | 3,461,227 | 354,195 |
| Mode M0 | |||
|---|---|---|---|
| Quadrant | BADHDUFLAG | Total packets | Discarded packets |
| A | 0 | 12939 | 3 |
| B | 0 | 13339 | 2 |
| C | 0 | 12966 | 2 |
| D | 0 | 14172 | 2 |
| Mode SS | |||
|---|---|---|---|
| Quadrant | BADHDUFLAG | Total packets | Discarded packets |
| A | 0 | 126 | 0 |
| B | 0 | 126 | 0 |
| C | 0 | 126 | 0 |
| D | 0 | 126 | 0 |
| Mode M9 | |||
|---|---|---|---|
| Quadrant | BADHDUFLAG | Total packets | Discarded packets |
| A | 0 | 19 | 0 |
| B | 0 | 19 | 0 |
| C | 0 | 19 | 0 |
| D | 0 | 20 | 0 |
| Quadrant | Total seconds | Saturated seconds | Saturation percentage |
|---|---|---|---|
| A | 6181 | 59 | 0.954538% |
| B | 6181 | 81 | 1.310468% |
| C | 6181 | 34 | 0.550073% |
| D | 6181 | 130 | 2.103220% |
Noise dominated data is calculated using 1-second bins in cleaned event files. If a bin has >2000 counts, and if more than 50% of those come from <1% of pixels, then it is considered to be noise-dominated and hence unusable.
| Quadrant | # 1 sec bins | Bins with >0 counts | Bins with >2000 counts | High rate bins dominated by noise | Noise dominated (total time) | Noise dominated (detector-on time) | Marked lightcurve |
|---|---|---|---|---|---|---|---|
| A | 7526 | 6183 | 0 | 0 | 0.00% | 0.00% | 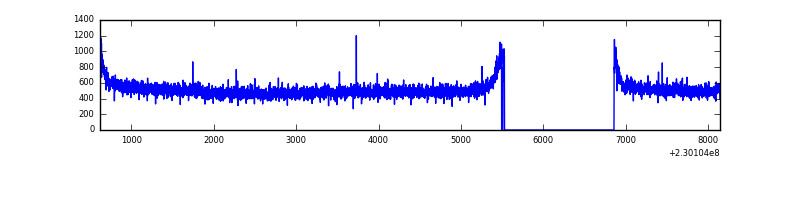 |
| B | 7526 | 6183 | 10 | 10 | 0.13% | 0.16% | 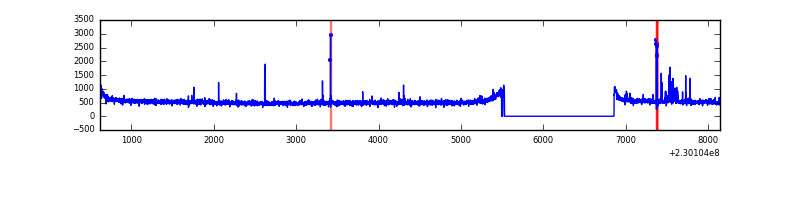 |
| C | 7526 | 6183 | 1 | 1 | 0.01% | 0.02% | 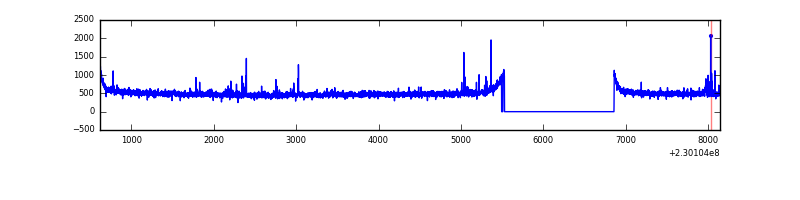 |
| D | 7526 | 6183 | 100 | 100 | 1.33% | 1.62% | 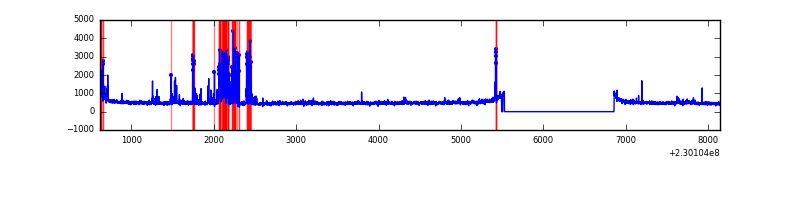 |
Top three noisy pixels from each quadrant. If the there are fewer than three noisy pixels in the level2.evt file, extra rows are filled as -1
| Pixel properties | Quadrant properties | ||||||
|---|---|---|---|---|---|---|---|
| Quadrant | DetID | PixID | Counts | Sigma | Mean | Median | Sigma |
| A | 0 | 226 | 7743 | 42.26 | 816 | 800 | 164.3 |
| A | 12 | 194 | 7048 | 38.03 | 816 | 800 | 164.3 |
| A | 14 | 111 | 4215 | 20.79 | 816 | 800 | 164.3 |
| B | 4 | 48 | 54405 | 347.09 | 819 | 802 | 154.4 |
| B | 10 | 252 | 23693 | 148.22 | 819 | 802 | 154.4 |
| B | 12 | 111 | 16906 | 104.28 | 819 | 802 | 154.4 |
| C | 1 | 16 | 28281 | 152.51 | 781 | 788 | 180.3 |
| C | 9 | 68 | 18805 | 99.95 | 781 | 788 | 180.3 |
| C | 13 | 61 | 5907 | 28.4 | 781 | 788 | 180.3 |
| D | 2 | 136 | 418745 | 2243.26 | 771 | 750 | 186.3 |
| D | 2 | 14 | 41084 | 216.46 | 771 | 750 | 186.3 |
| D | 1 | 52 | 38483 | 202.5 | 771 | 750 | 186.3 |
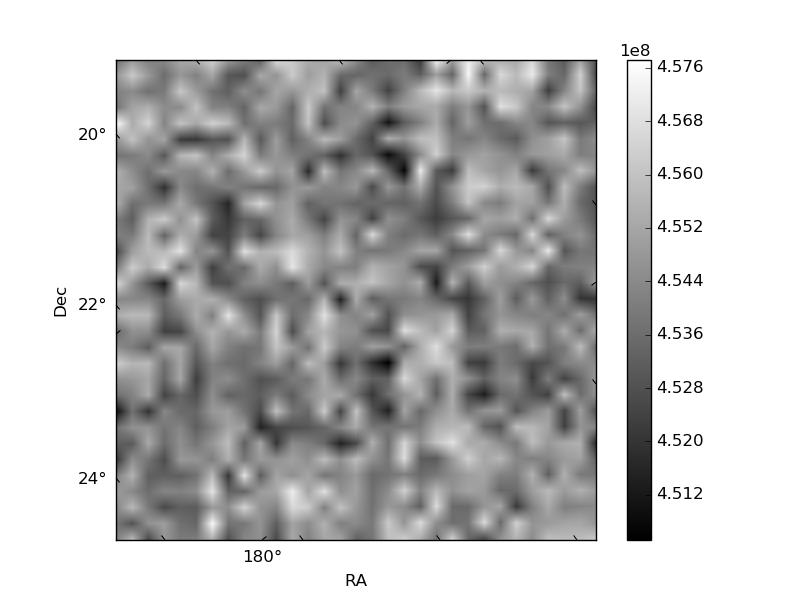
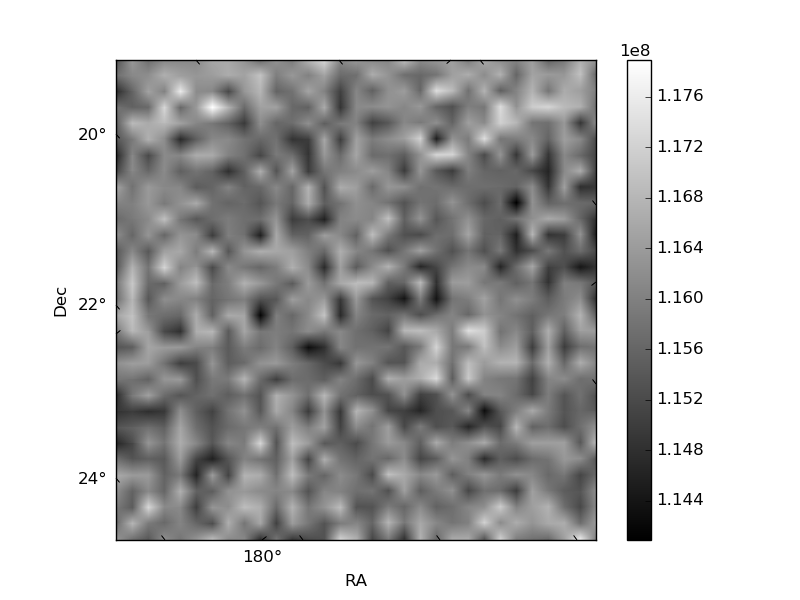
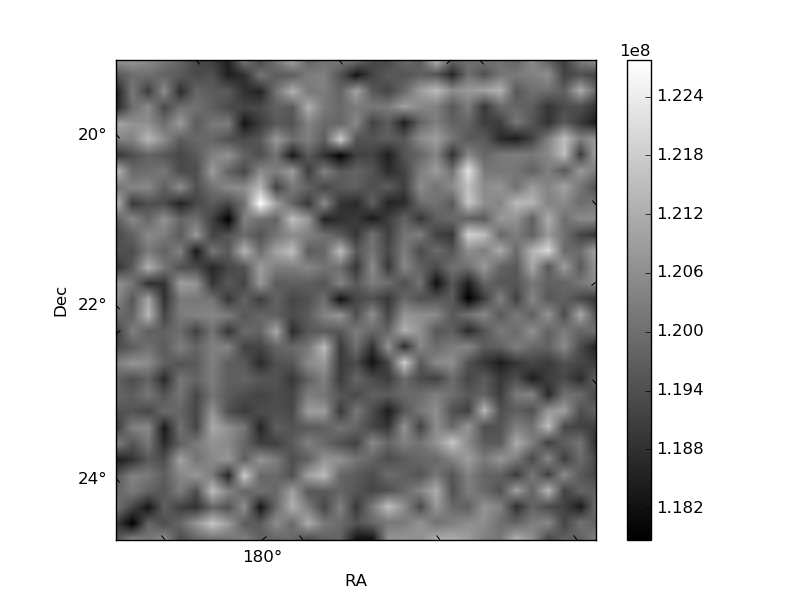
Histogram calculated using DETX and DETY for each event in the final _common_clean file
| Quadrant A | 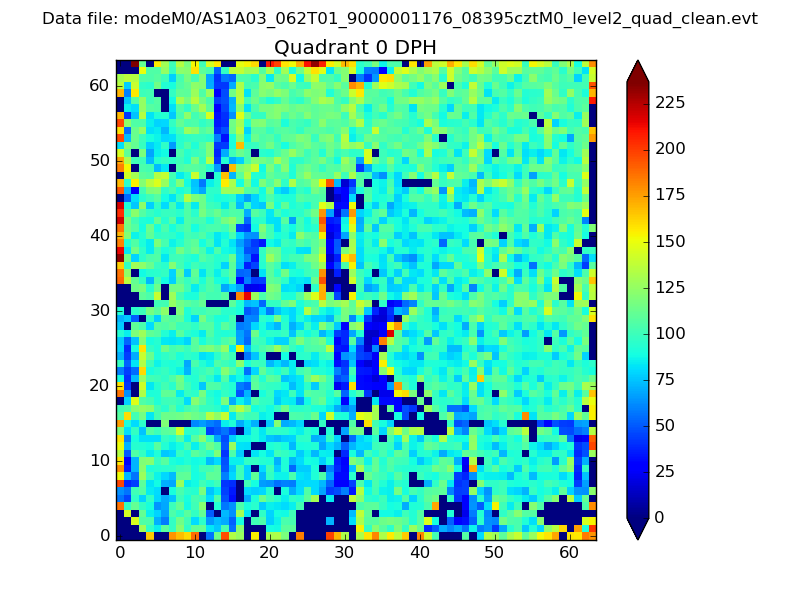 |
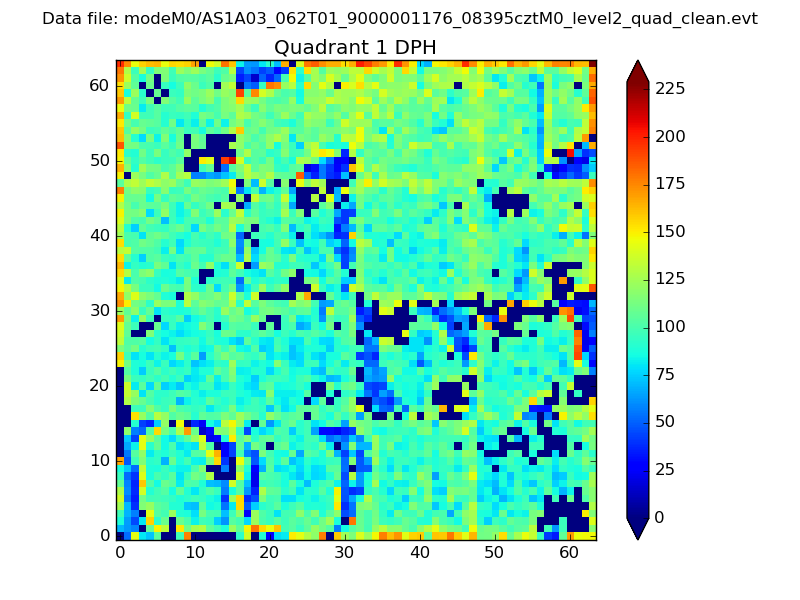 |
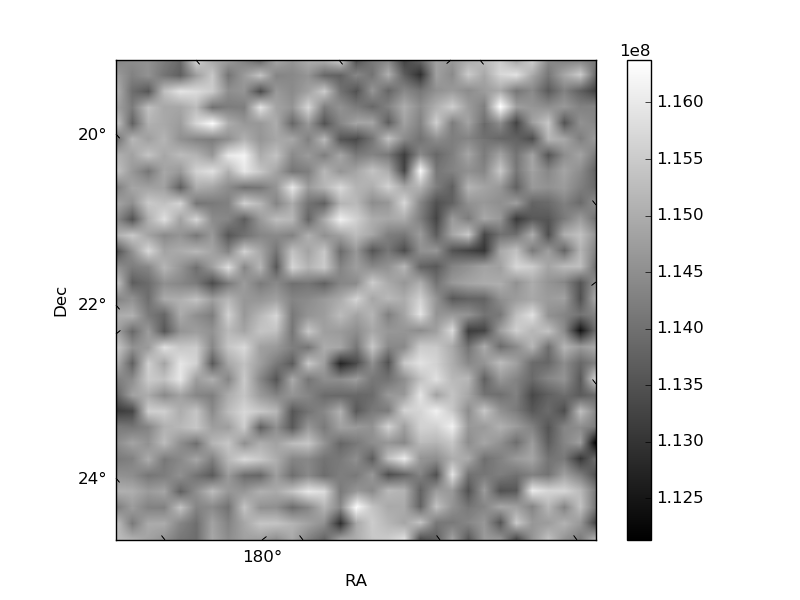
Quadrant B |
|---|---|---|---|
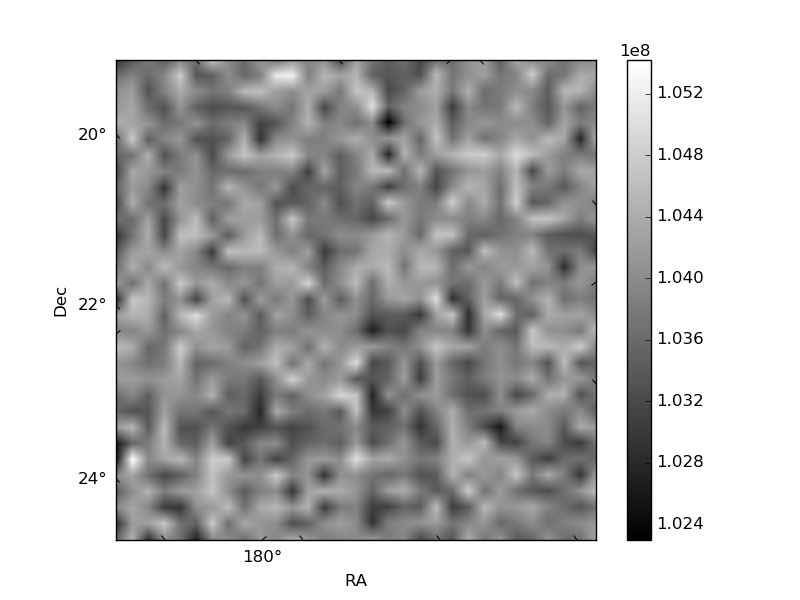
| Quadrant D | 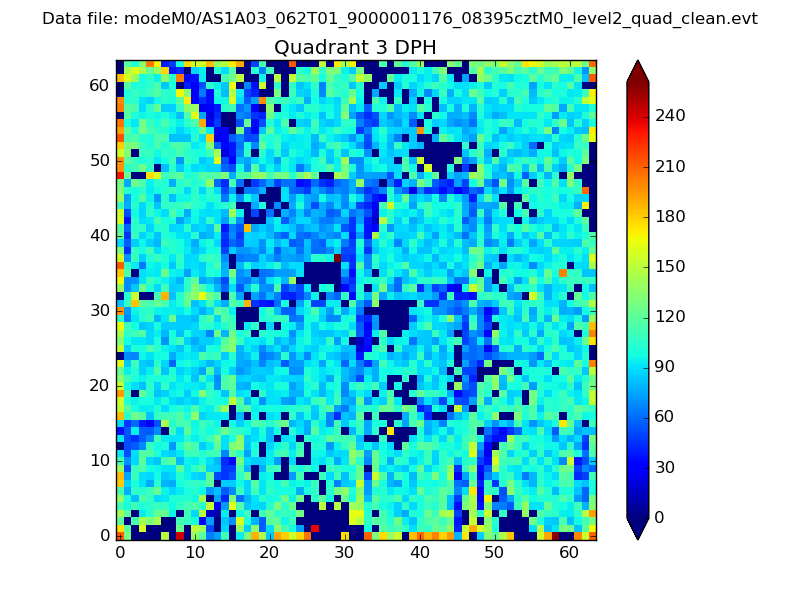 |
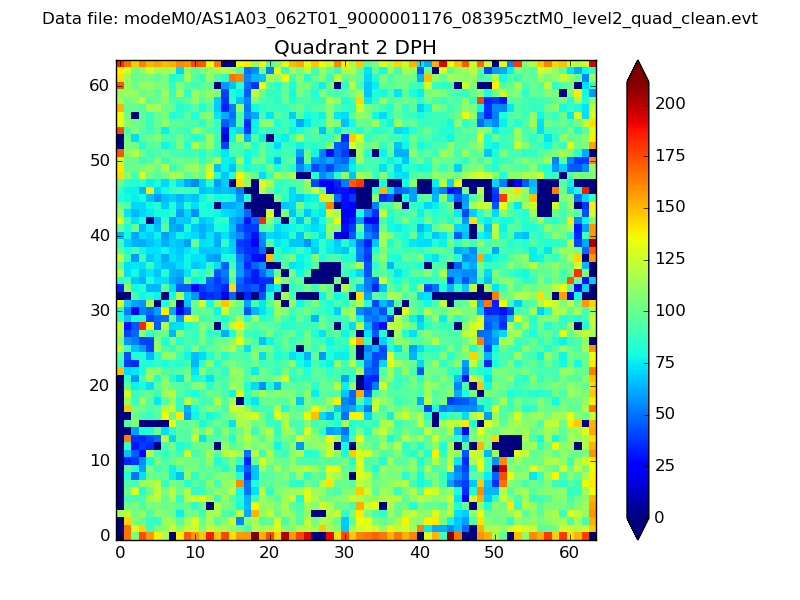 |
Quadrant C |
| Plot type | Count rate plots | Images |
|---|---|---|
| Comparison with Poisson distribution Blue bars denote a histogram of data divided into 1 sec bins. Red curve is a Poisson curve with rate = median count rate of data. |
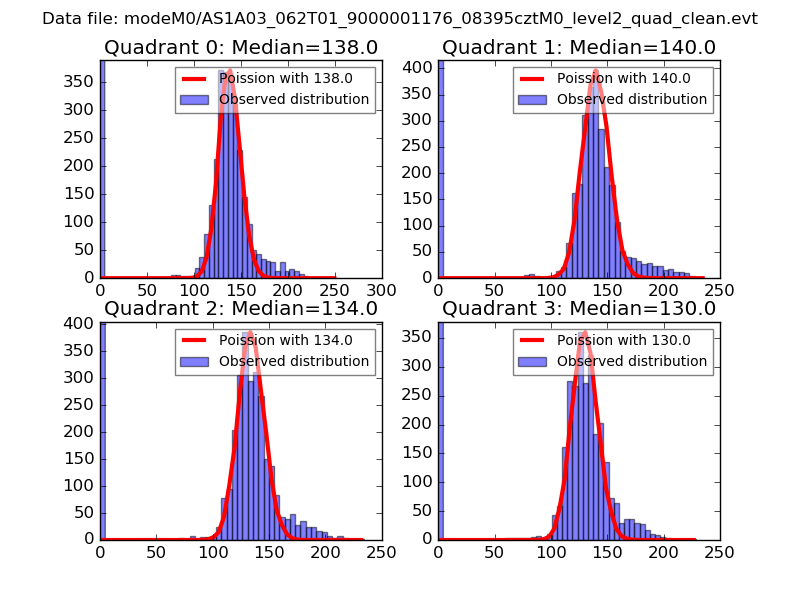 |
 |
| Quadrant-wise count rates Data is divided into 100 sec bins |
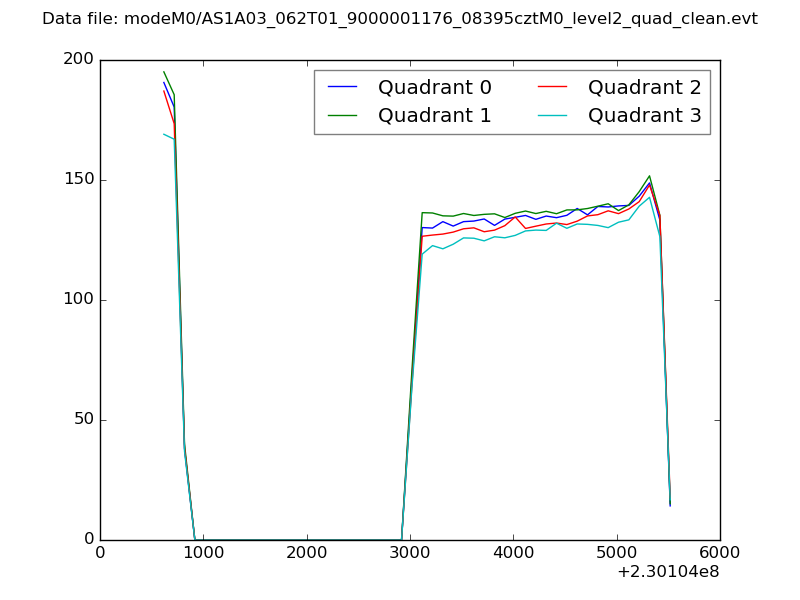 |
|
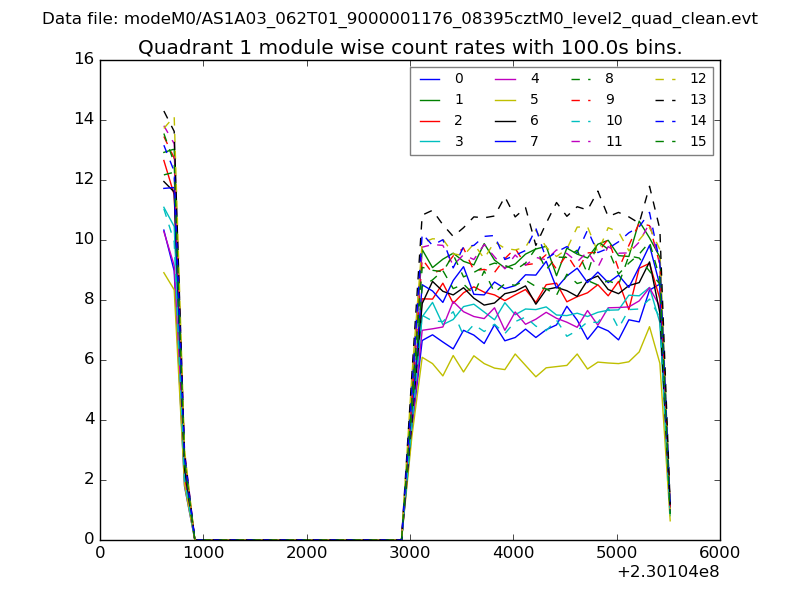
| Module-wise count rates for Quadrant A Data is divided into 100 sec bins |
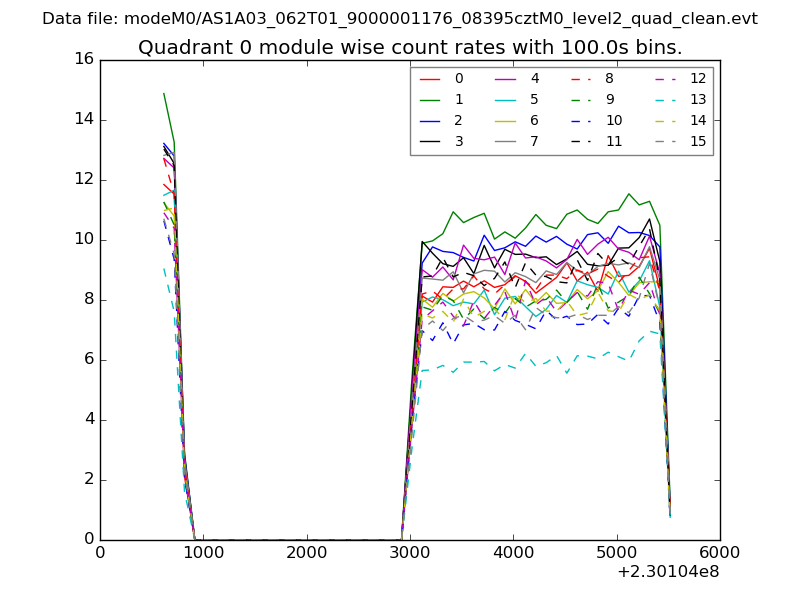 |
 |
| Module-wise count rates for Quadrant B Data is divided into 100 sec bins |
 |
 |
| Module-wise count rates for Quadrant C Data is divided into 100 sec bins |
 |
 |
| Module-wise count rates for Quadrant D Data is divided into 100 sec bins |
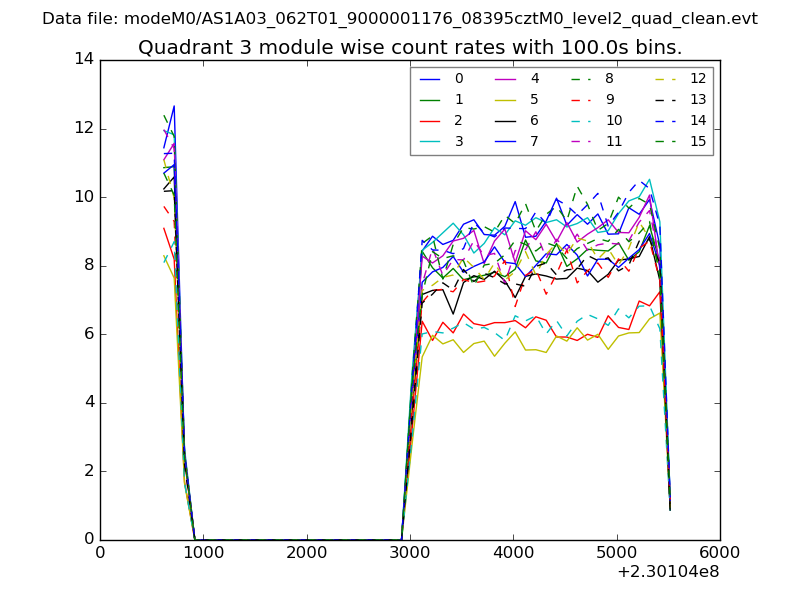 |
 |
| Parameter | Plot |
|---|---|
| CZT HV Monitor | 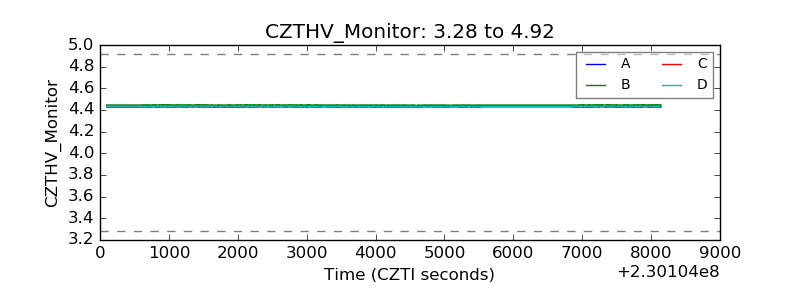 |
| D_VDD | 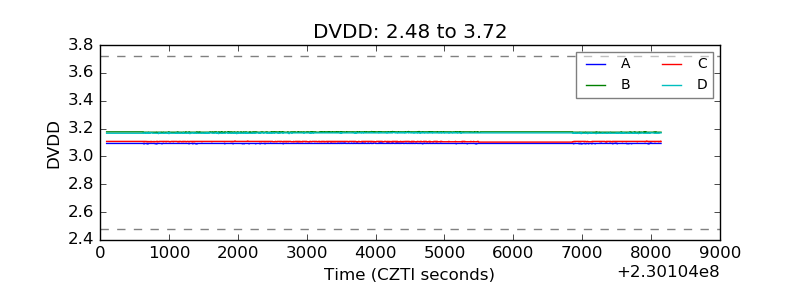 |
| Temperature 1 | 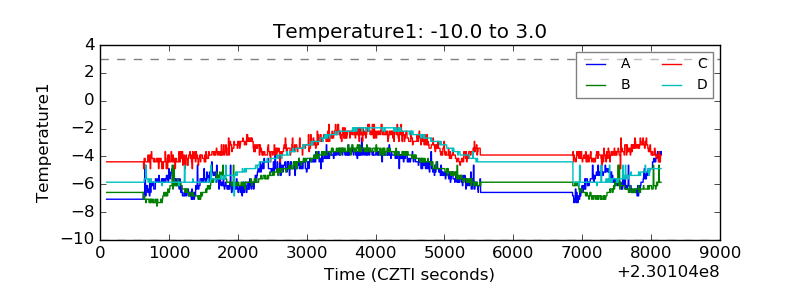 |
| Veto HV Monitor | 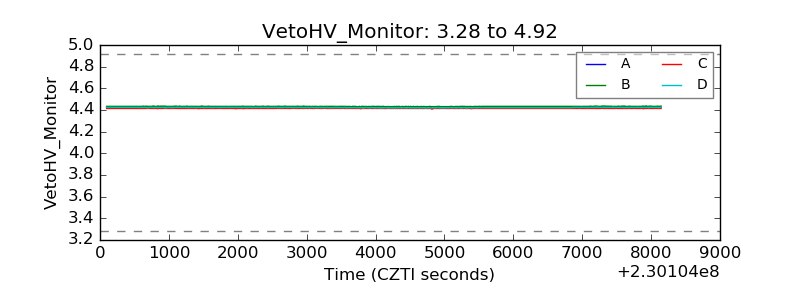 |
| Veto LLD | 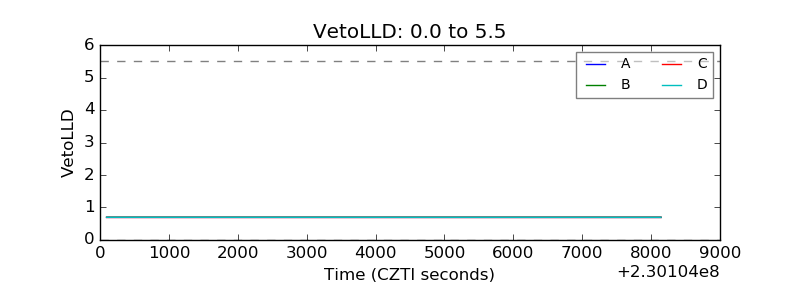 |
| Alpha Counter | 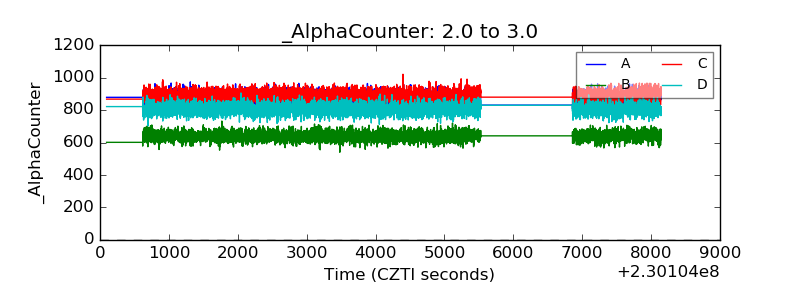 |
| _CPM_Rate | 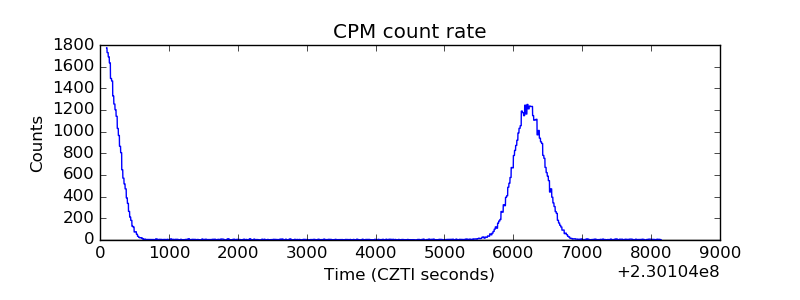 |
| CZT Counter | 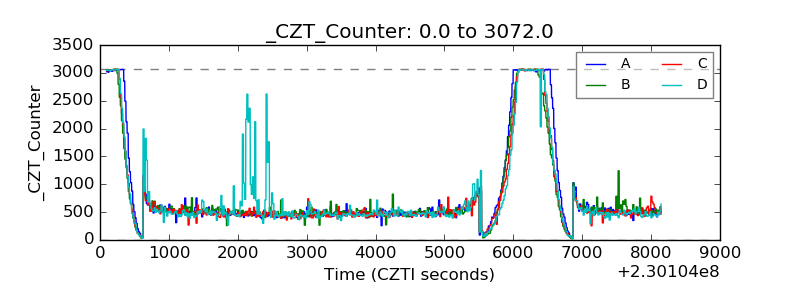 |
| +2.5 Volts monitor |  |
| +5 Volts monitor |  |
| _ROLL_ROT | 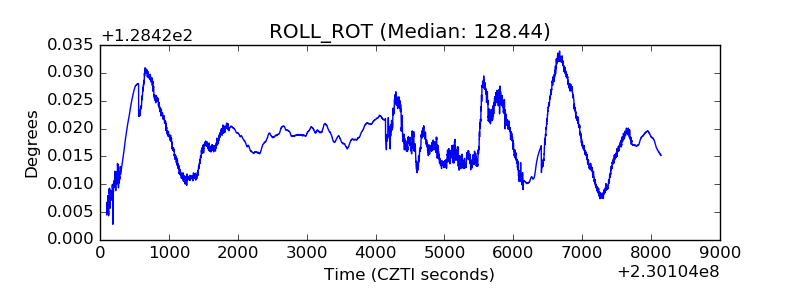 |
| _Roll_DEC | 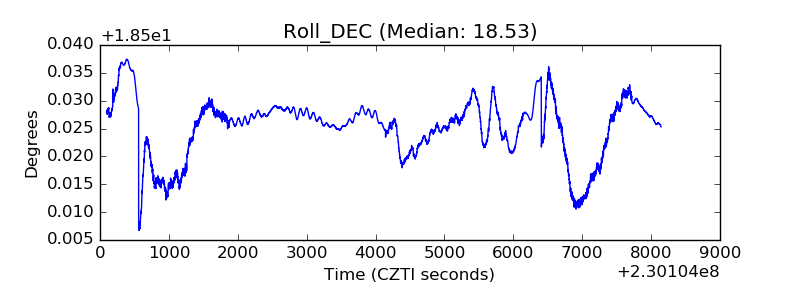 |
| _Roll_RA | 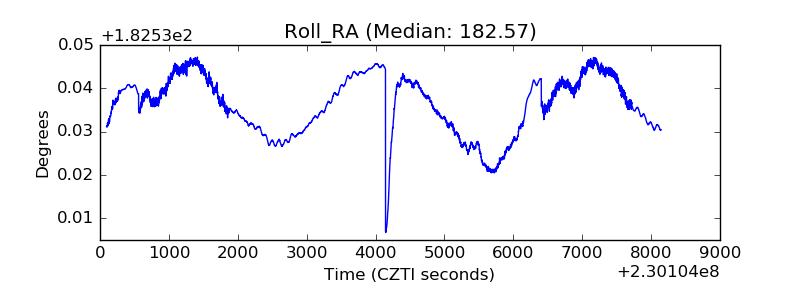 |
| Veto Counter | 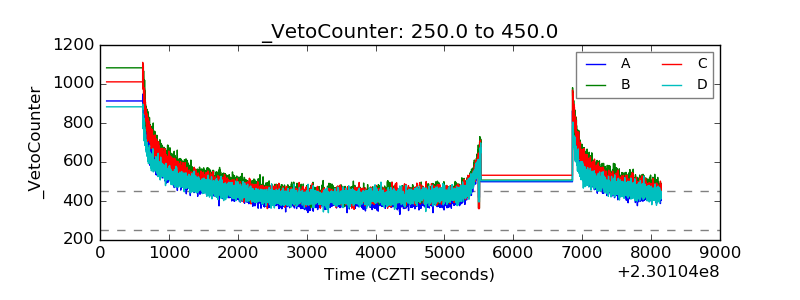 |