| Param | Original file | Final file |
|---|---|---|
| Filename | modeM0/AS1A03_062T01_9000001176_08396cztM0_level2.evt | modeM0/AS1A03_062T01_9000001176_08396cztM0_level2_quad_clean.evt |
| Size (bytes) | 443,635,200 | 66,300,480 |
| Size | 423.1 MB | 63.2 MB |
| Events in quadrant A | 3,138,683 | 397,508 |
| Events in quadrant B | 3,473,995 | 401,272 |
| Events in quadrant C | 3,083,262 | 392,249 |
| Events in quadrant D | 3,315,398 | 380,792 |
| Mode M0 | |||
|---|---|---|---|
| Quadrant | BADHDUFLAG | Total packets | Discarded packets |
| A | 0 | 13096 | 3 |
| B | 0 | 14038 | 2 |
| C | 0 | 13081 | 2 |
| D | 0 | 13891 | 2 |
| Mode SS | |||
|---|---|---|---|
| Quadrant | BADHDUFLAG | Total packets | Discarded packets |
| A | 0 | 126 | 0 |
| B | 0 | 126 | 0 |
| C | 0 | 126 | 0 |
| D | 0 | 126 | 0 |
| Mode M9 | |||
|---|---|---|---|
| Quadrant | BADHDUFLAG | Total packets | Discarded packets |
| A | 0 | 23 | 0 |
| B | 0 | 23 | 0 |
| C | 0 | 23 | 0 |
| D | 0 | 24 | 0 |
| Quadrant | Total seconds | Saturated seconds | Saturation percentage |
|---|---|---|---|
| A | 6244 | 102 | 1.633568% |
| B | 6244 | 163 | 2.610506% |
| C | 6244 | 62 | 0.992953% |
| D | 6244 | 64 | 1.024984% |
Noise dominated data is calculated using 1-second bins in cleaned event files. If a bin has >2000 counts, and if more than 50% of those come from <1% of pixels, then it is considered to be noise-dominated and hence unusable.
| Quadrant | # 1 sec bins | Bins with >0 counts | Bins with >2000 counts | High rate bins dominated by noise | Noise dominated (total time) | Noise dominated (detector-on time) | Marked lightcurve |
|---|---|---|---|---|---|---|---|
| A | 7454 | 6245 | 0 | 0 | 0.00% | 0.00% | 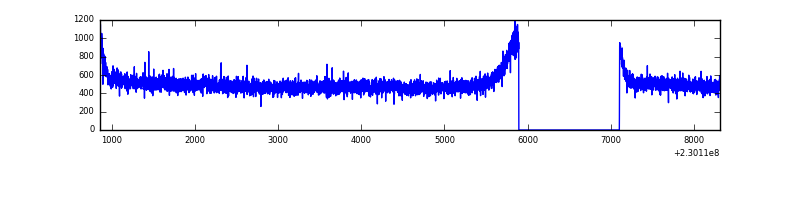 |
| B | 7454 | 6244 | 30 | 30 | 0.40% | 0.48% | 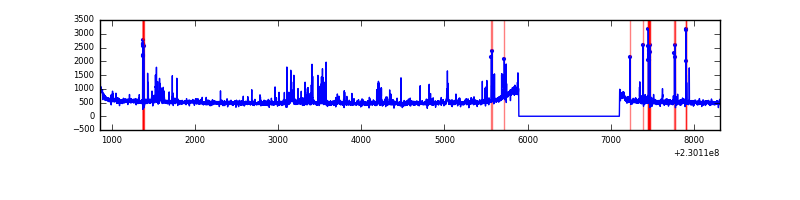 |
| C | 7454 | 6244 | 1 | 1 | 0.01% | 0.02% | 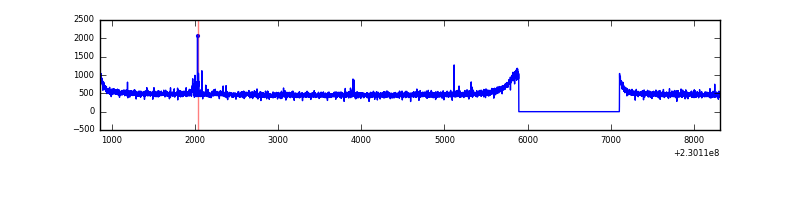 |
| D | 7454 | 6245 | 8 | 8 | 0.11% | 0.13% | 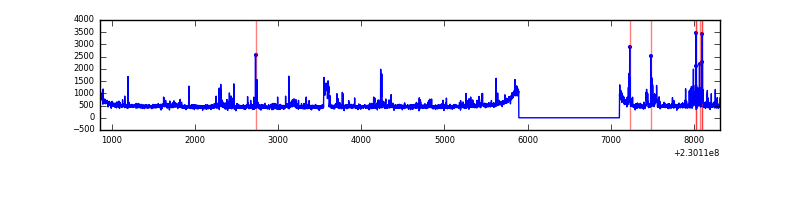 |
Top three noisy pixels from each quadrant. If the there are fewer than three noisy pixels in the level2.evt file, extra rows are filled as -1
| Pixel properties | Quadrant properties | ||||||
|---|---|---|---|---|---|---|---|
| Quadrant | DetID | PixID | Counts | Sigma | Mean | Median | Sigma |
| A | 0 | 226 | 7724 | 41.86 | 815 | 797 | 165.5 |
| A | 12 | 194 | 7172 | 38.52 | 815 | 797 | 165.5 |
| A | 14 | 111 | 5165 | 26.39 | 815 | 797 | 165.5 |
| B | 4 | 48 | 265194 | 1716.2 | 811 | 795 | 154.1 |
| B | 10 | 252 | 24839 | 156.07 | 811 | 795 | 154.1 |
| B | 0 | 214 | 18846 | 117.17 | 811 | 795 | 154.1 |
| C | 9 | 68 | 31605 | 170.24 | 781 | 787 | 181.0 |
| C | 13 | 61 | 5999 | 28.79 | 781 | 787 | 181.0 |
| C | 1 | 16 | 3840 | 16.86 | 781 | 787 | 181.0 |
| D | 1 | 52 | 139755 | 743.17 | 776 | 760 | 187.0 |
| D | 14 | 34 | 90567 | 480.17 | 776 | 760 | 187.0 |
| D | 2 | 136 | 69833 | 369.31 | 776 | 760 | 187.0 |
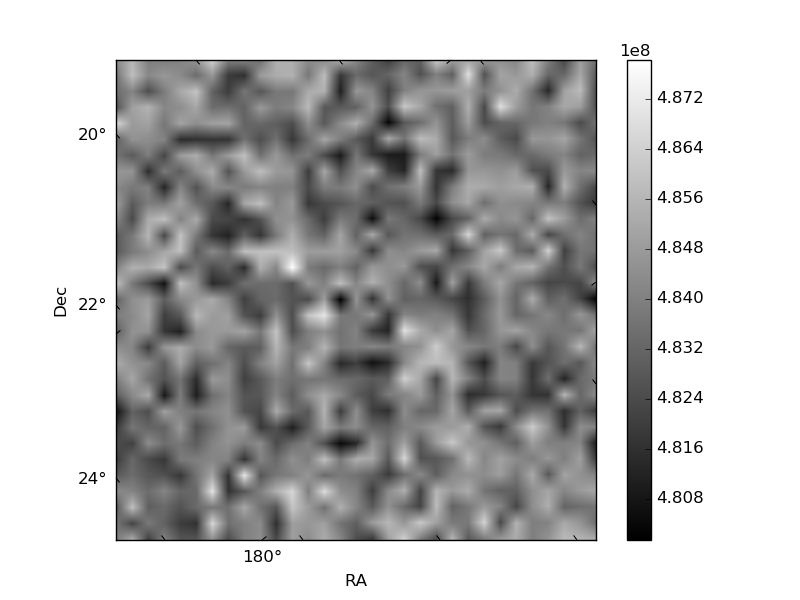
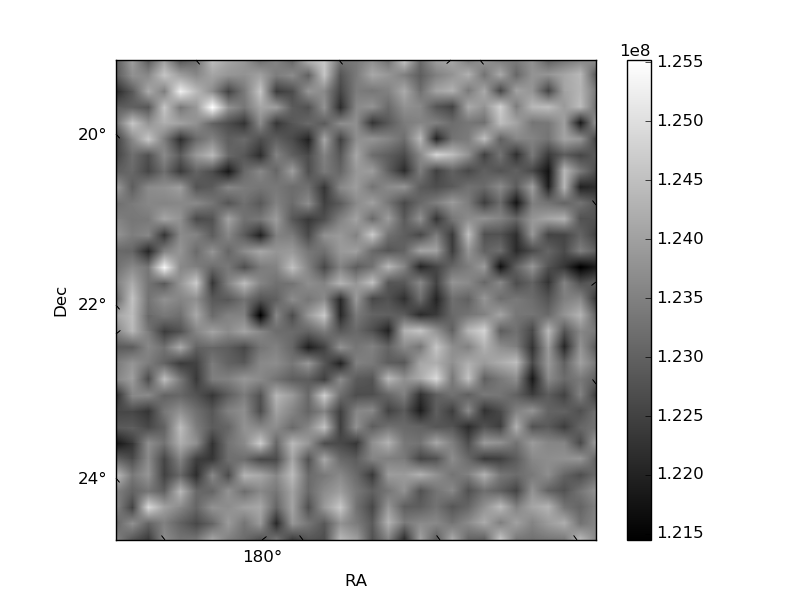
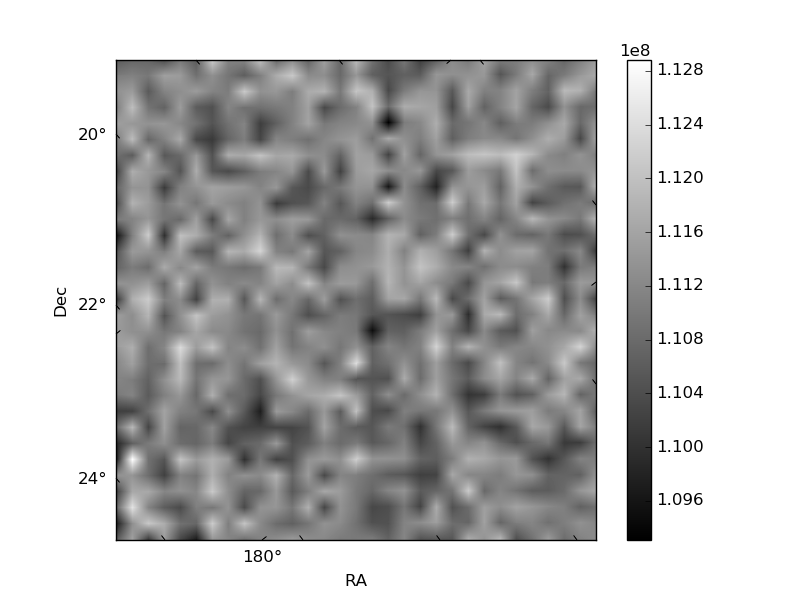
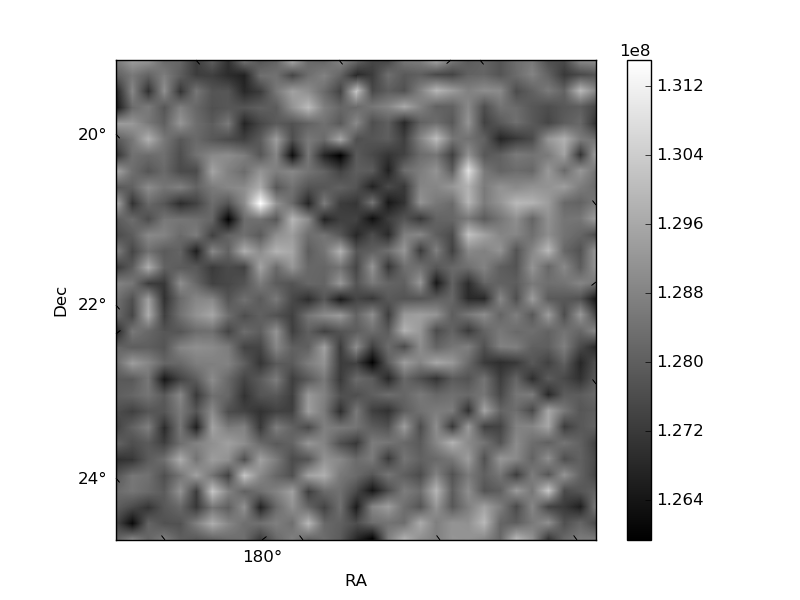
Histogram calculated using DETX and DETY for each event in the final _common_clean file
| Quadrant A | 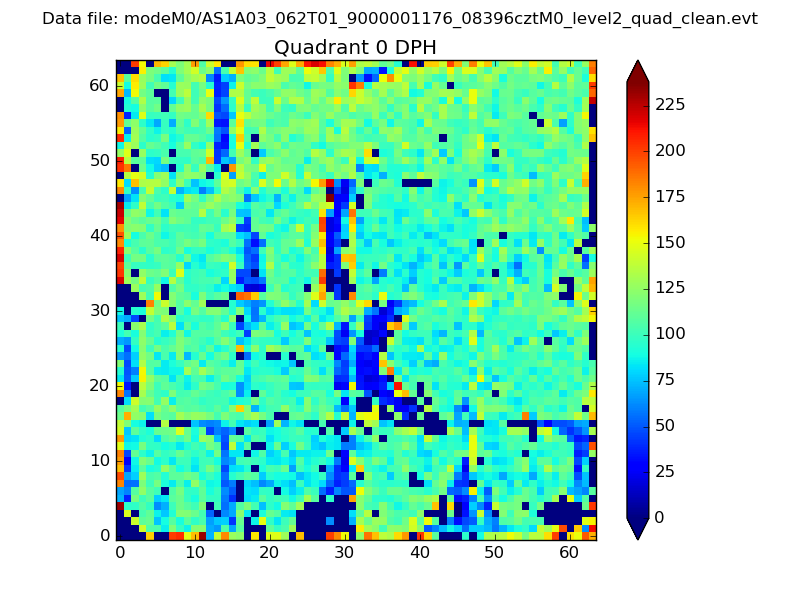 |
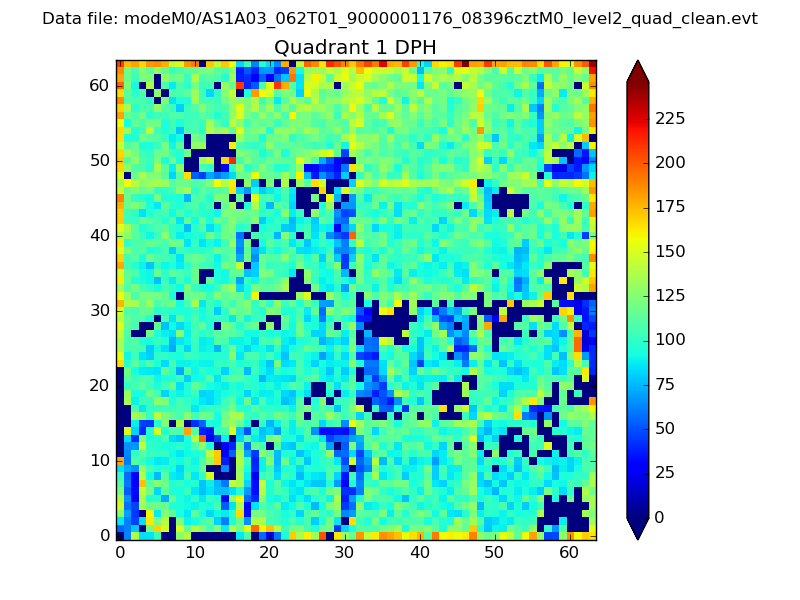 |
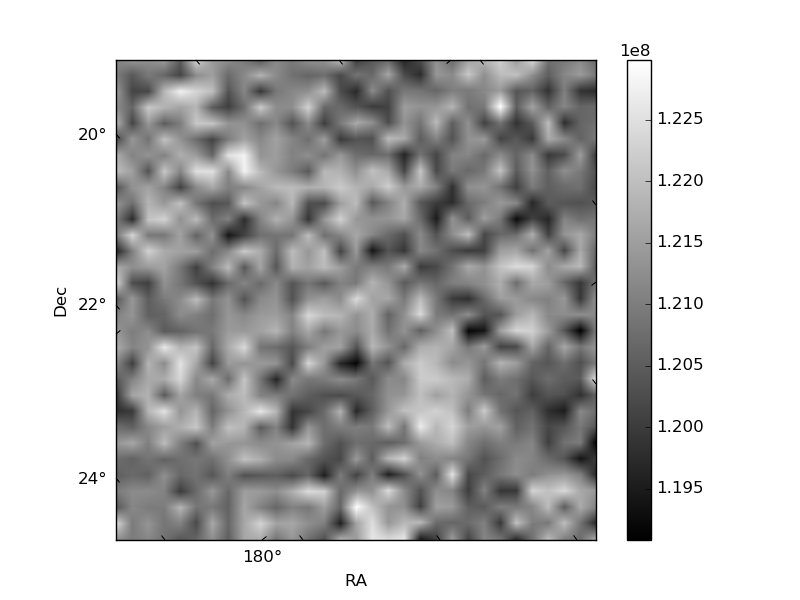
Quadrant B |
|---|---|---|---|
| Quadrant D | 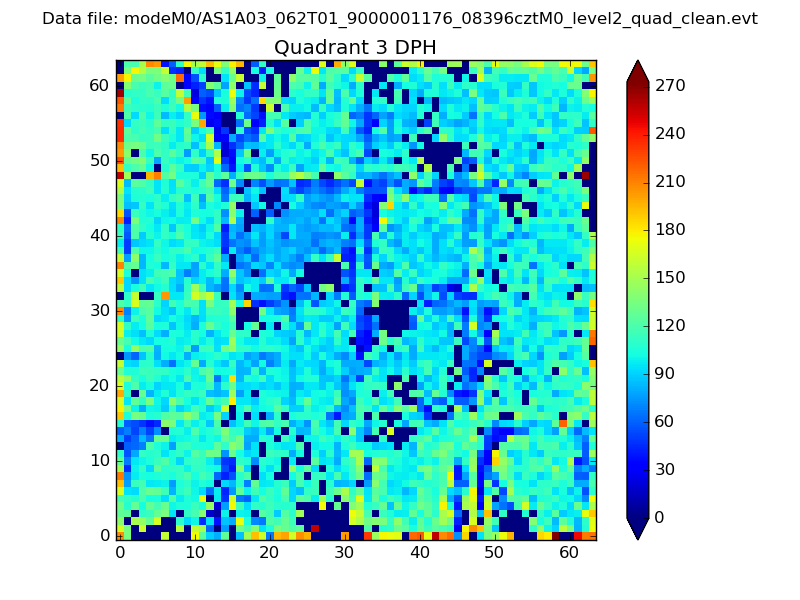 |
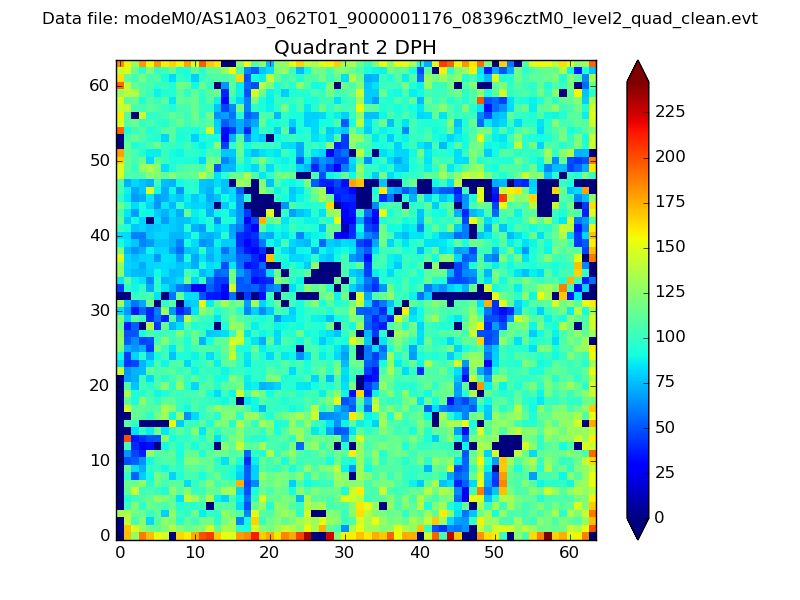 |
Quadrant C |
| Plot type | Count rate plots | Images |
|---|---|---|
| Comparison with Poisson distribution Blue bars denote a histogram of data divided into 1 sec bins. Red curve is a Poisson curve with rate = median count rate of data. |
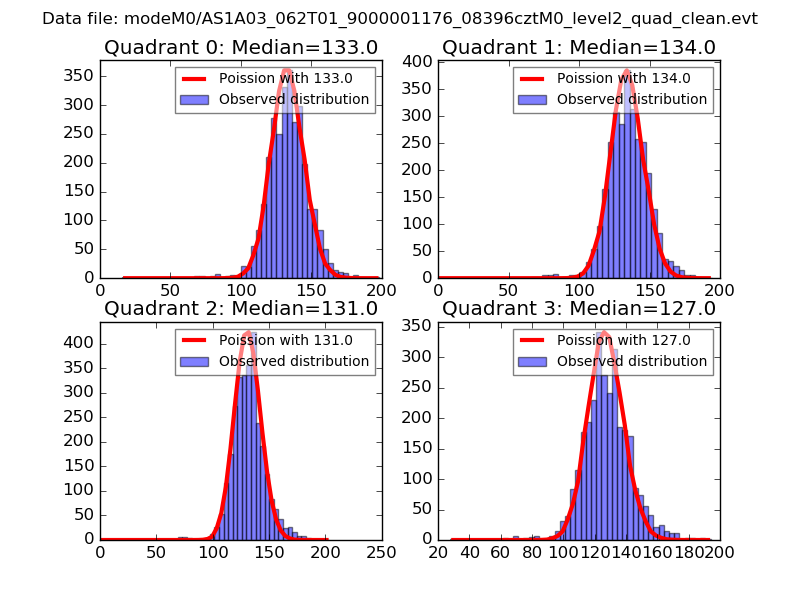 |
 |
| Quadrant-wise count rates Data is divided into 100 sec bins |
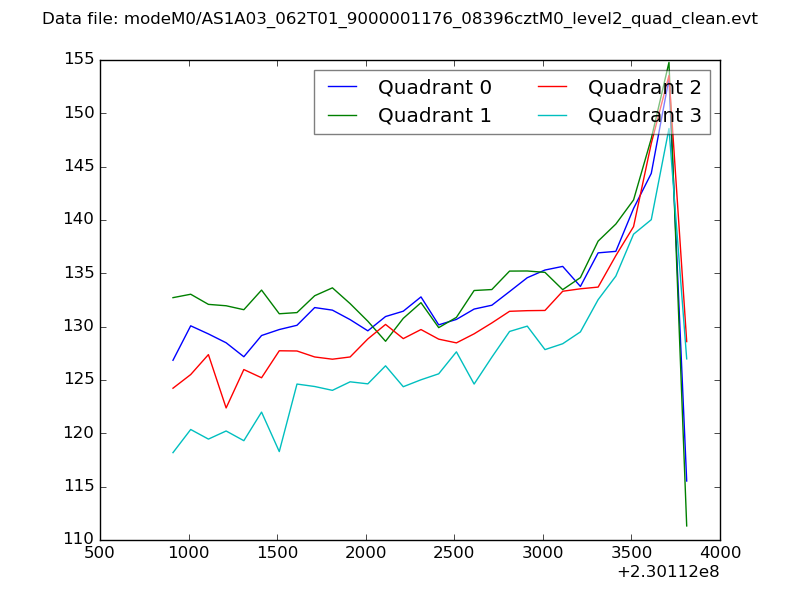 |
|
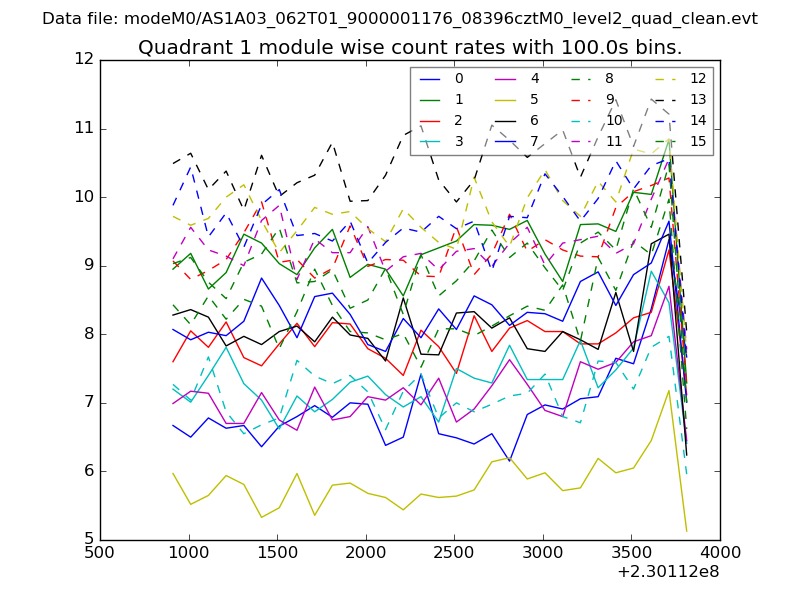
| Module-wise count rates for Quadrant A Data is divided into 100 sec bins |
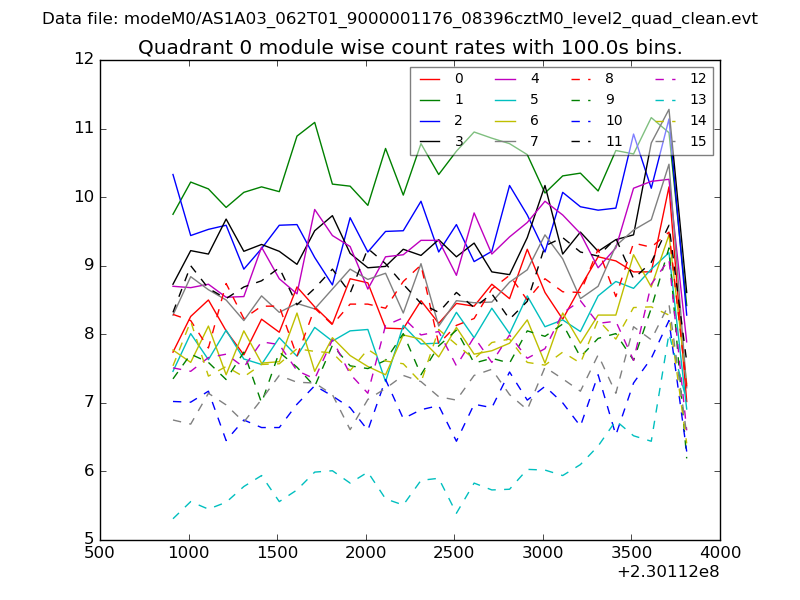 |
 |
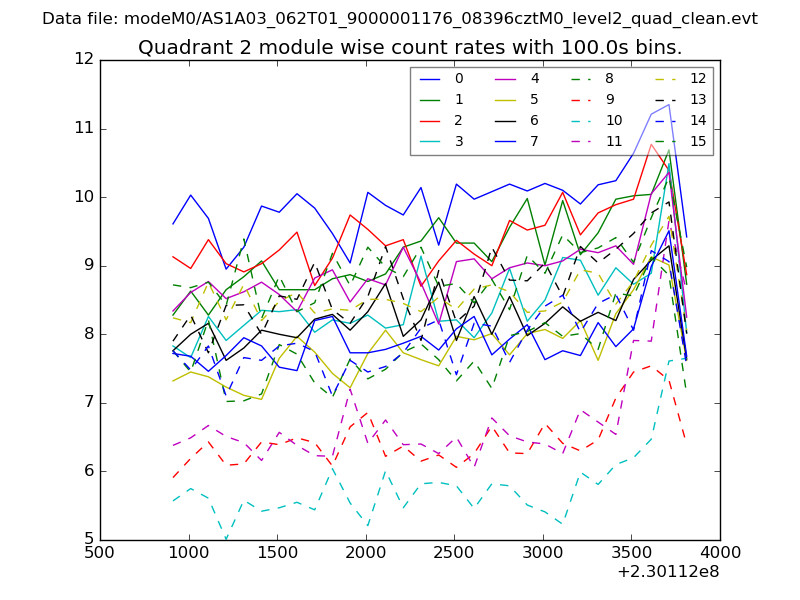
| Module-wise count rates for Quadrant B Data is divided into 100 sec bins |
 |
 |
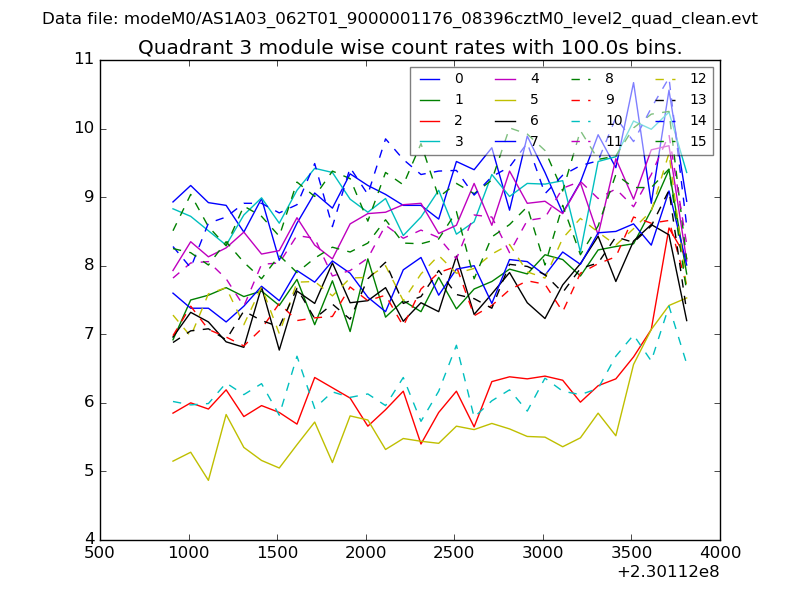
| Module-wise count rates for Quadrant C Data is divided into 100 sec bins |
 |
 |
| Module-wise count rates for Quadrant D Data is divided into 100 sec bins |
 |
 |
| Parameter | Plot |
|---|---|
| CZT HV Monitor | 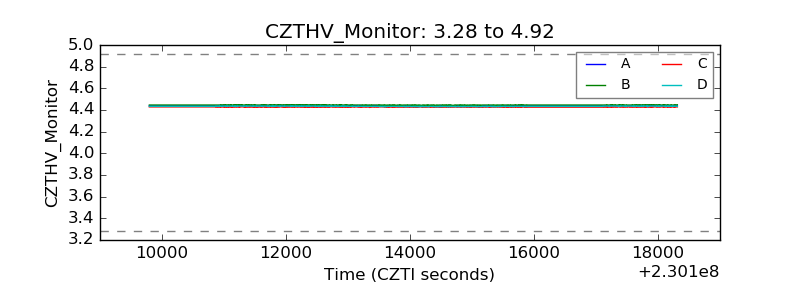 |
| D_VDD | 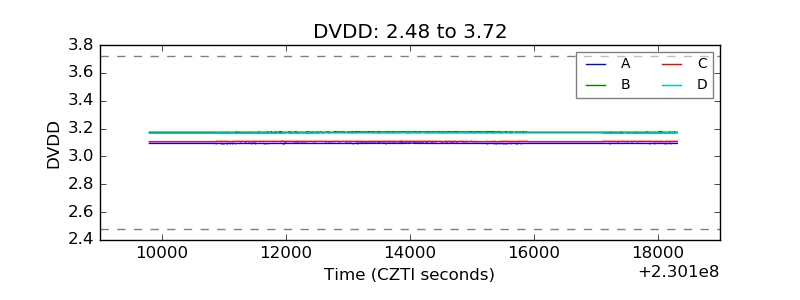 |
| Temperature 1 |  |
| Veto HV Monitor | 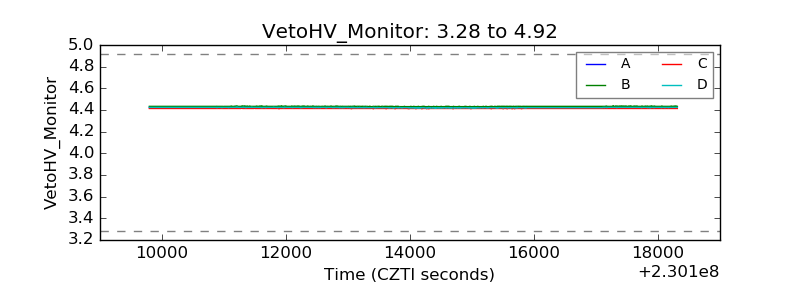 |
| Veto LLD | 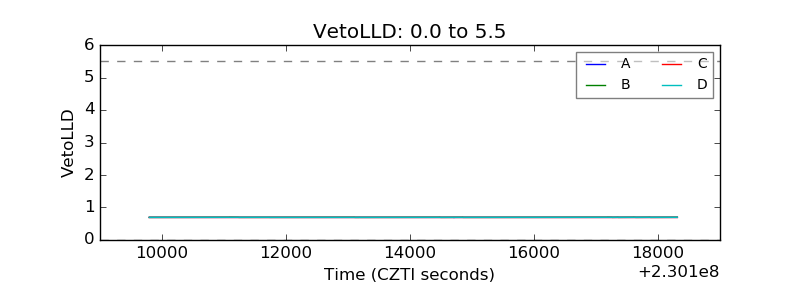 |
| Alpha Counter | 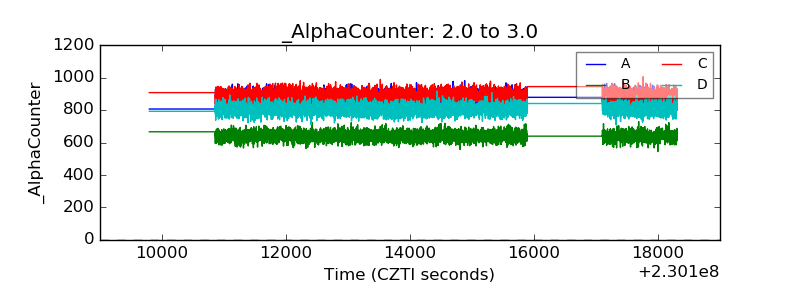 |
| _CPM_Rate | 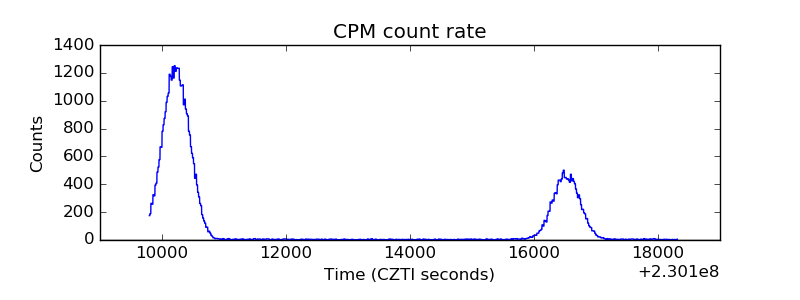 |
| CZT Counter | 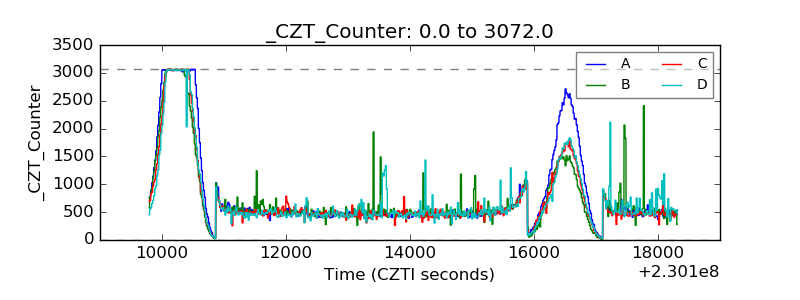 |
| +2.5 Volts monitor |  |
| +5 Volts monitor |  |
| _ROLL_ROT | 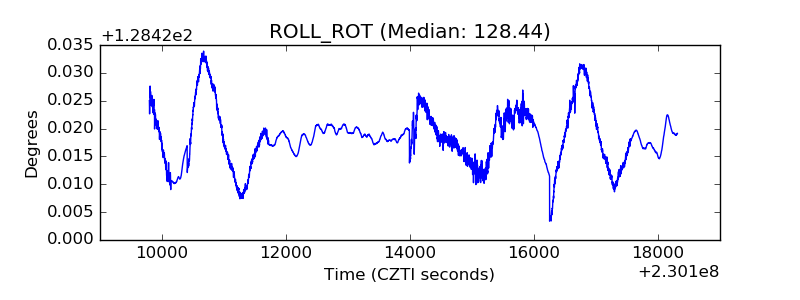 |
| _Roll_DEC | 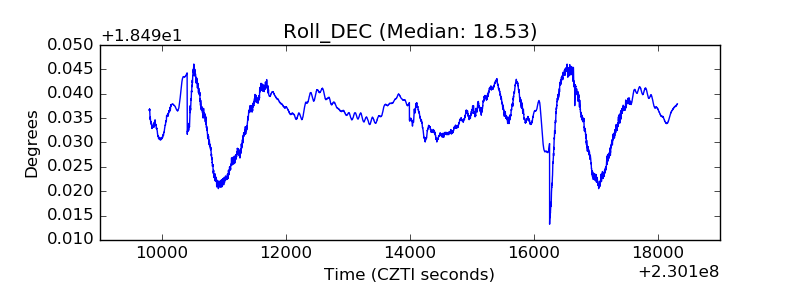 |
| _Roll_RA | 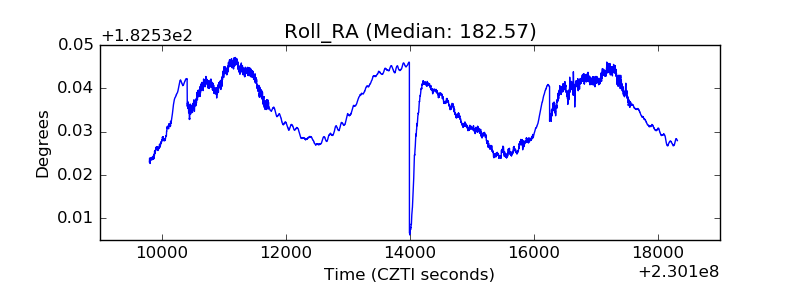 |
| Veto Counter | 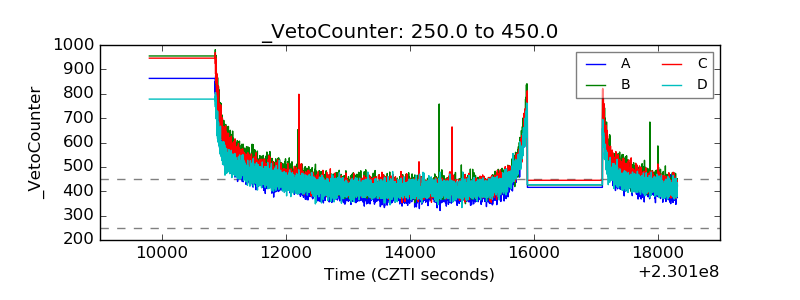 |