| Param | Original file | Final file |
|---|---|---|
| Filename | modeM0/AS1A03_062T01_9000001176_08398cztM0_level2.evt | modeM0/AS1A03_062T01_9000001176_08398cztM0_level2_quad_clean.evt |
| Size (bytes) | 181,385,280 | 29,940,480 |
| Size | 173.0 MB | 28.6 MB |
| Events in quadrant A | 1,315,439 | 179,355 |
| Events in quadrant B | 1,353,708 | 182,772 |
| Events in quadrant C | 1,278,243 | 175,621 |
| Events in quadrant D | 1,354,349 | 169,282 |
| Mode M0 | |||
|---|---|---|---|
| Quadrant | BADHDUFLAG | Total packets | Discarded packets |
| A | 0 | 5719 | 1 |
| B | 0 | 5760 | 1 |
| C | 0 | 5681 | 1 |
| D | 0 | 5938 | 1 |
| Mode SS | |||
|---|---|---|---|
| Quadrant | BADHDUFLAG | Total packets | Discarded packets |
| A | 0 | 56 | 0 |
| B | 0 | 56 | 0 |
| C | 0 | 56 | 0 |
| D | 0 | 56 | 0 |
| Mode M9 | |||
|---|---|---|---|
| Quadrant | BADHDUFLAG | Total packets | Discarded packets |
| A | 0 | 7 | 0 |
| B | 0 | 7 | 0 |
| C | 0 | 7 | 0 |
| D | 0 | 8 | 0 |
| Quadrant | Total seconds | Saturated seconds | Saturation percentage |
|---|---|---|---|
| A | 2781 | 14 | 0.503416% |
| B | 2781 | 20 | 0.719166% |
| C | 2781 | 9 | 0.323625% |
| D | 2781 | 13 | 0.467458% |
Noise dominated data is calculated using 1-second bins in cleaned event files. If a bin has >2000 counts, and if more than 50% of those come from <1% of pixels, then it is considered to be noise-dominated and hence unusable.
| Quadrant | # 1 sec bins | Bins with >0 counts | Bins with >2000 counts | High rate bins dominated by noise | Noise dominated (total time) | Noise dominated (detector-on time) | Marked lightcurve |
|---|---|---|---|---|---|---|---|
| A | 2781 | 2781 | 0 | 0 | 0.00% | 0.00% | 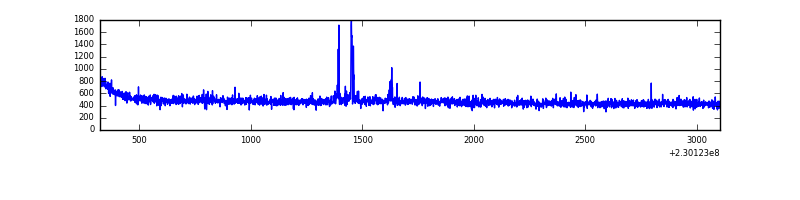 |
| B | 2781 | 2781 | 0 | 0 | 0.00% | 0.00% | 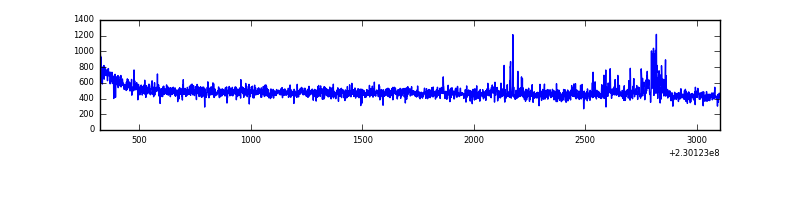 |
| C | 2781 | 2781 | 1 | 1 | 0.04% | 0.04% | 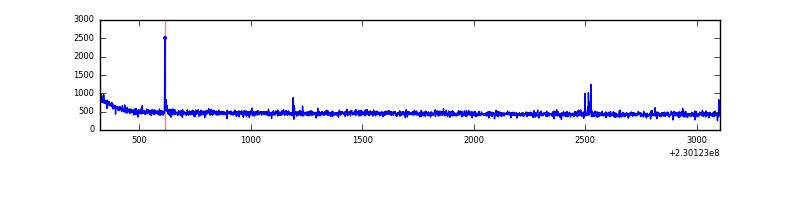 |
| D | 2781 | 2781 | 3 | 3 | 0.11% | 0.11% | 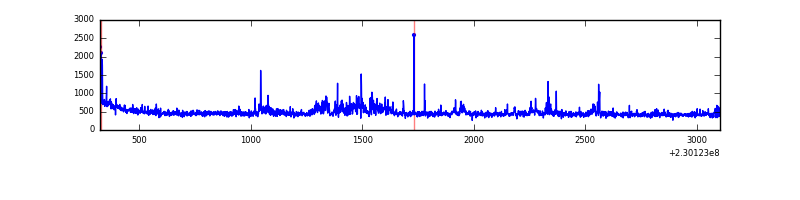 |
Top three noisy pixels from each quadrant. If the there are fewer than three noisy pixels in the level2.evt file, extra rows are filled as -1
| Pixel properties | Quadrant properties | ||||||
|---|---|---|---|---|---|---|---|
| Quadrant | DetID | PixID | Counts | Sigma | Mean | Median | Sigma |
| A | 13 | 248 | 21593 | 301.04 | 336 | 329 | 70.6 |
| A | 12 | 194 | 3055 | 38.59 | 336 | 329 | 70.6 |
| A | 0 | 226 | 3044 | 38.44 | 336 | 329 | 70.6 |
| B | 4 | 48 | 38003 | 569.84 | 335 | 327 | 66.1 |
| B | 12 | 111 | 7216 | 104.19 | 335 | 327 | 66.1 |
| B | 0 | 214 | 6077 | 86.97 | 335 | 327 | 66.1 |
| C | 1 | 16 | 12102 | 151.96 | 324 | 325 | 77.5 |
| C | 13 | 61 | 2431 | 27.17 | 324 | 325 | 77.5 |
| C | 3 | 233 | 913 | 7.58 | 324 | 325 | 77.5 |
| D | 2 | 152 | 49543 | 617.47 | 323 | 314 | 79.7 |
| D | 14 | 34 | 29597 | 367.29 | 323 | 314 | 79.7 |
| D | 2 | 136 | 11923 | 145.61 | 323 | 314 | 79.7 |
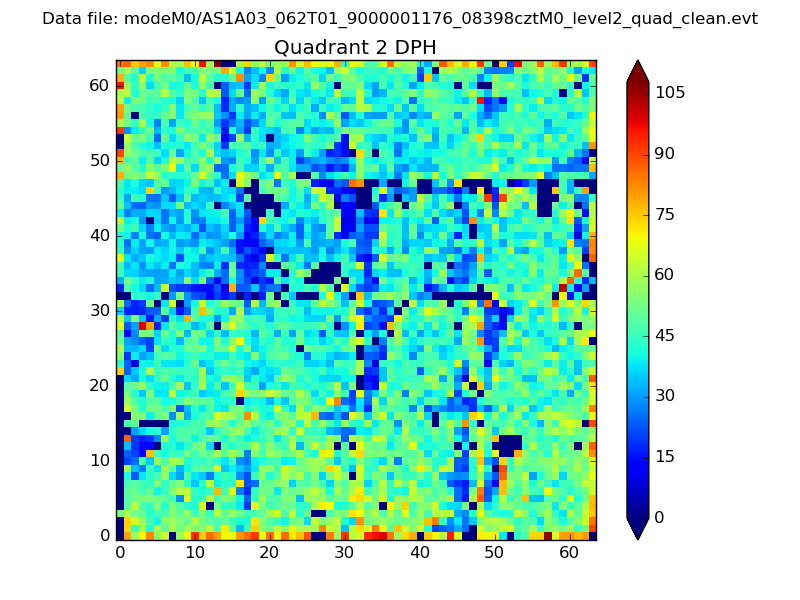
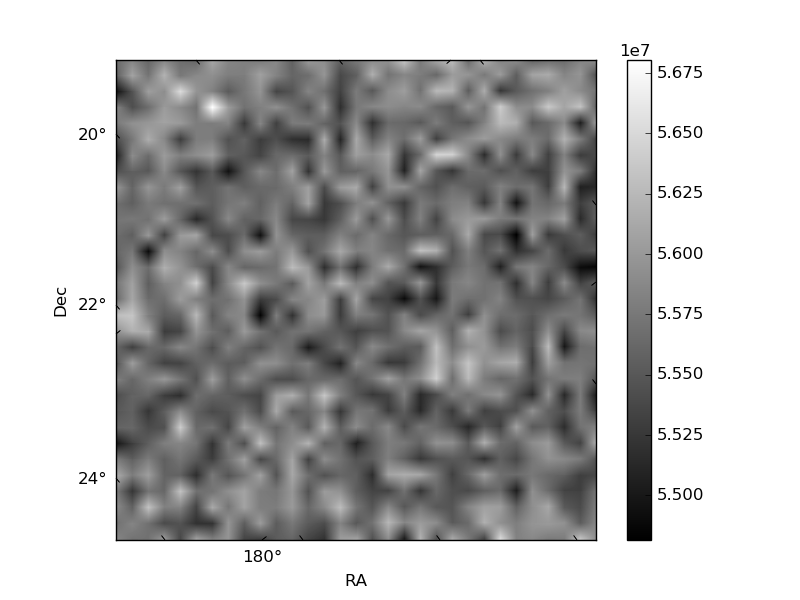
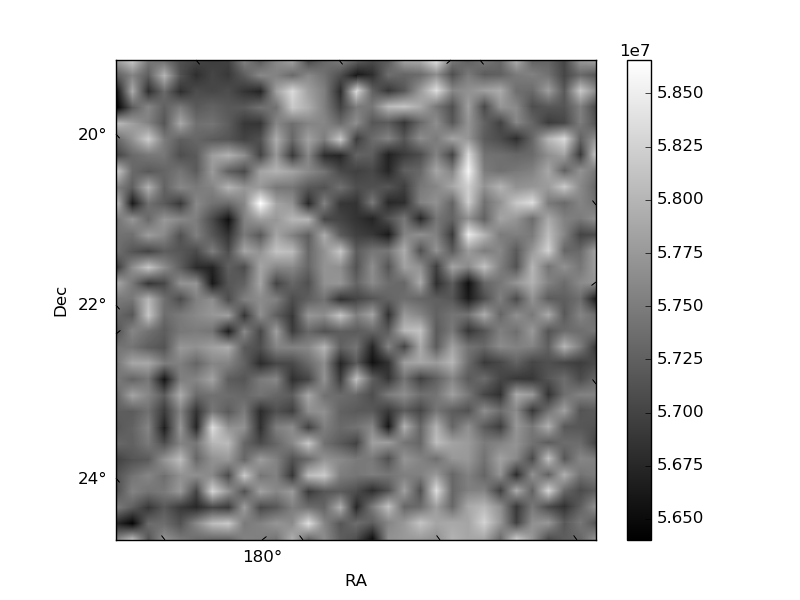
Histogram calculated using DETX and DETY for each event in the final _common_clean file
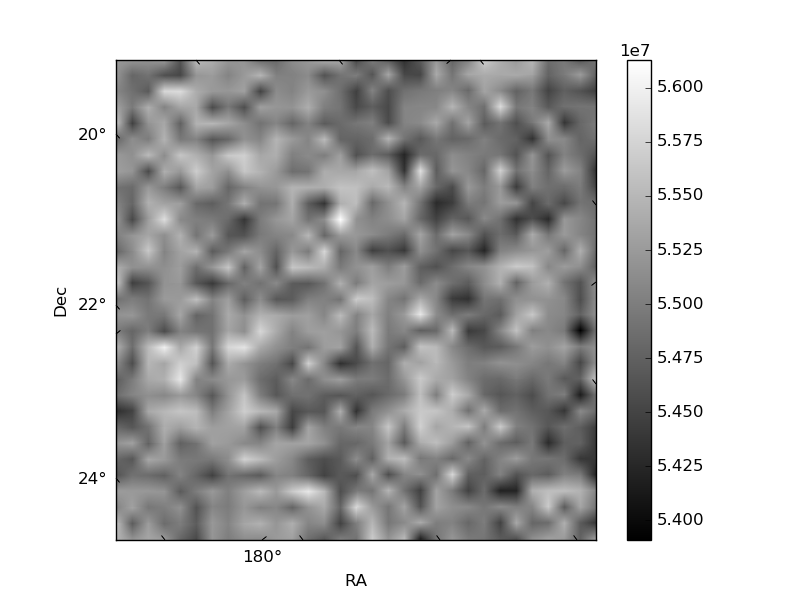
| Quadrant A | 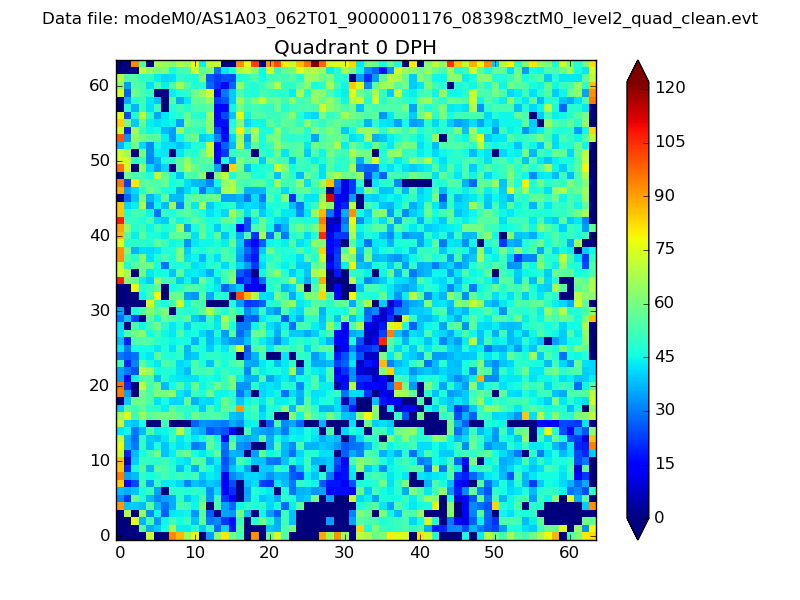 |
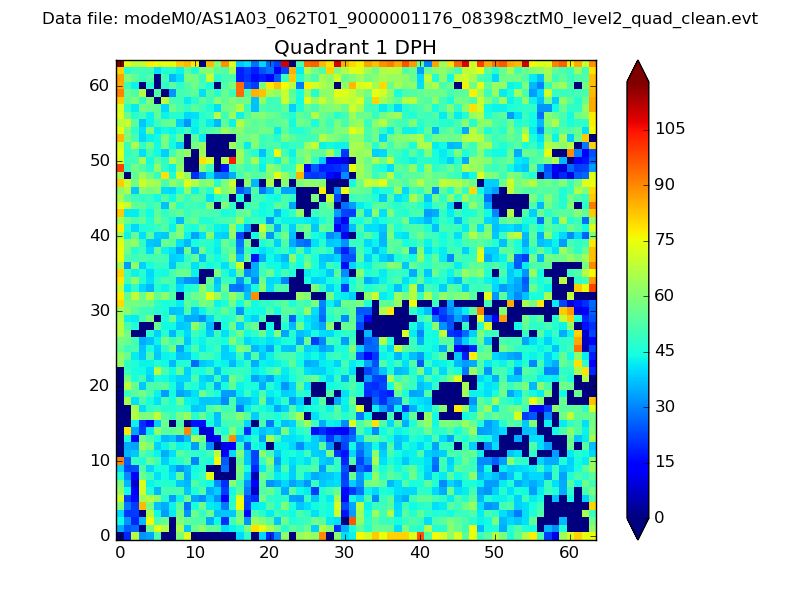 |
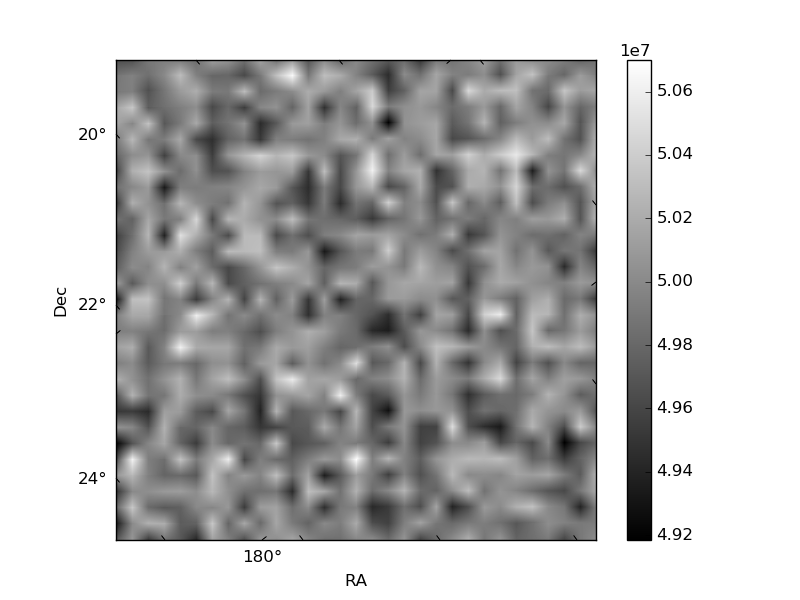
Quadrant B |
|---|---|---|---|
| Quadrant D | 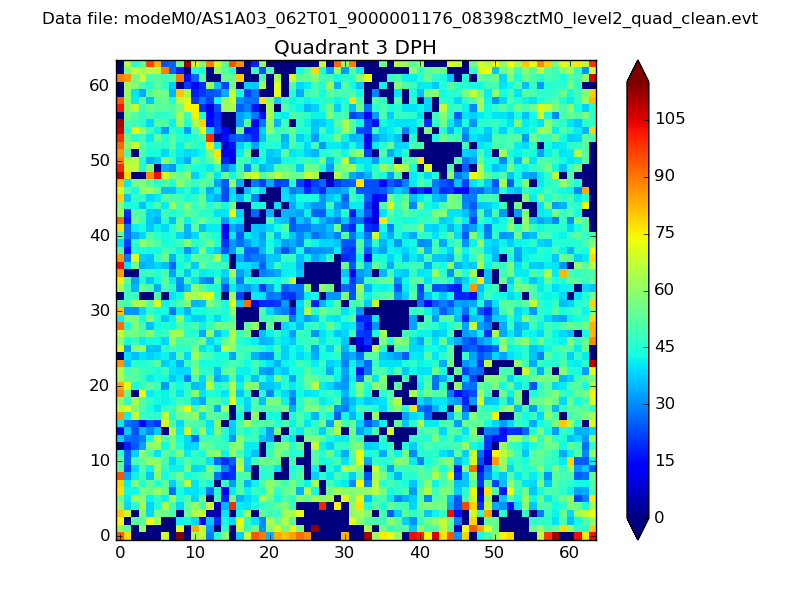 |
 |
Quadrant C |
| Plot type | Count rate plots | Images |
|---|---|---|
| Comparison with Poisson distribution Blue bars denote a histogram of data divided into 1 sec bins. Red curve is a Poisson curve with rate = median count rate of data. |
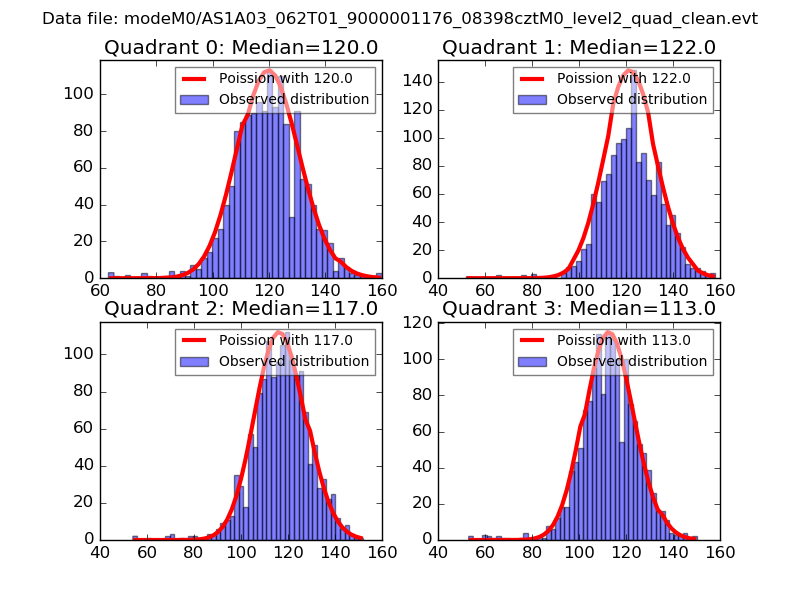 |
 |
| Quadrant-wise count rates Data is divided into 100 sec bins |
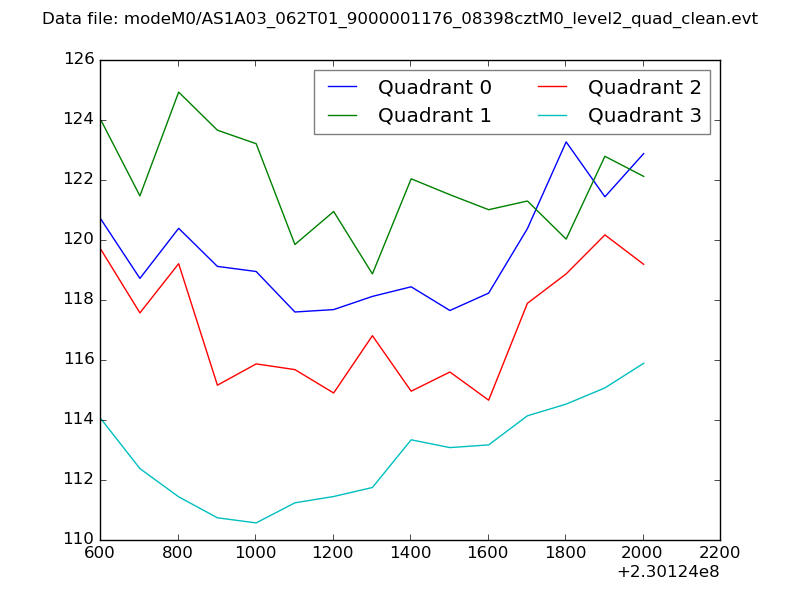 |
|
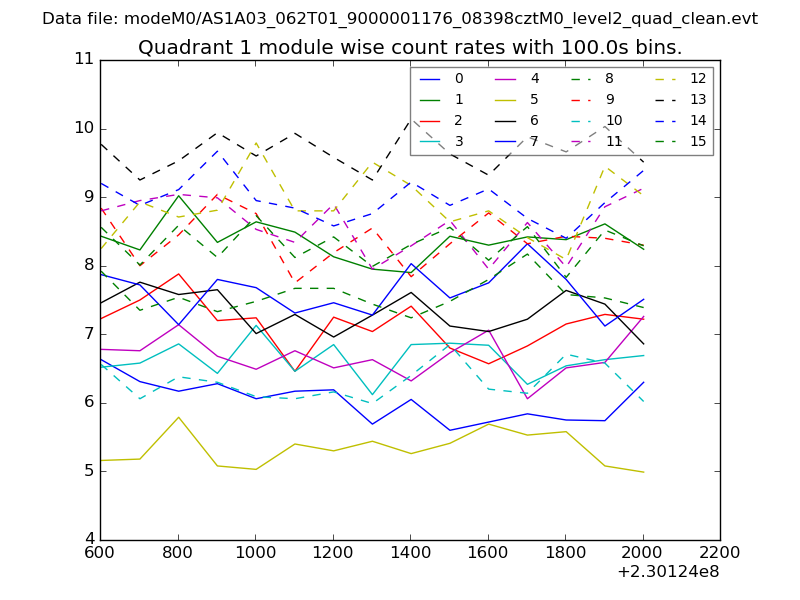
| Module-wise count rates for Quadrant A Data is divided into 100 sec bins |
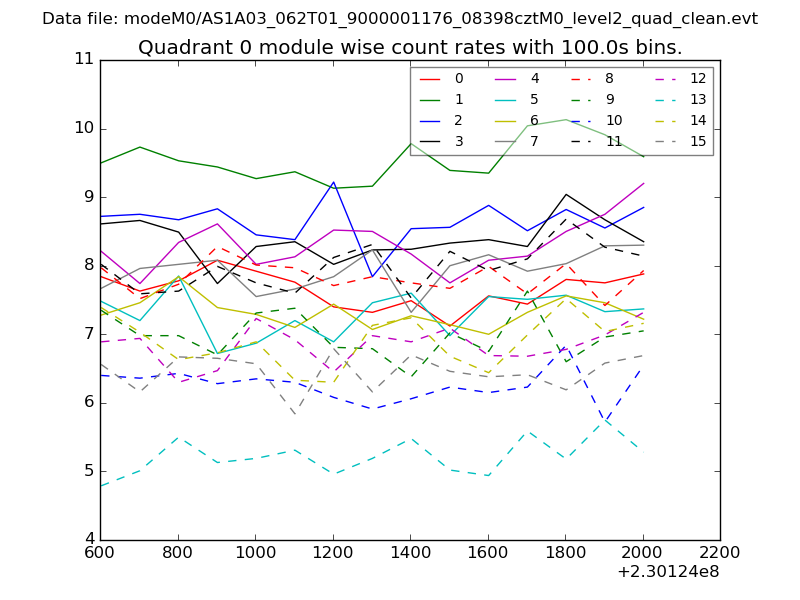 |
 |
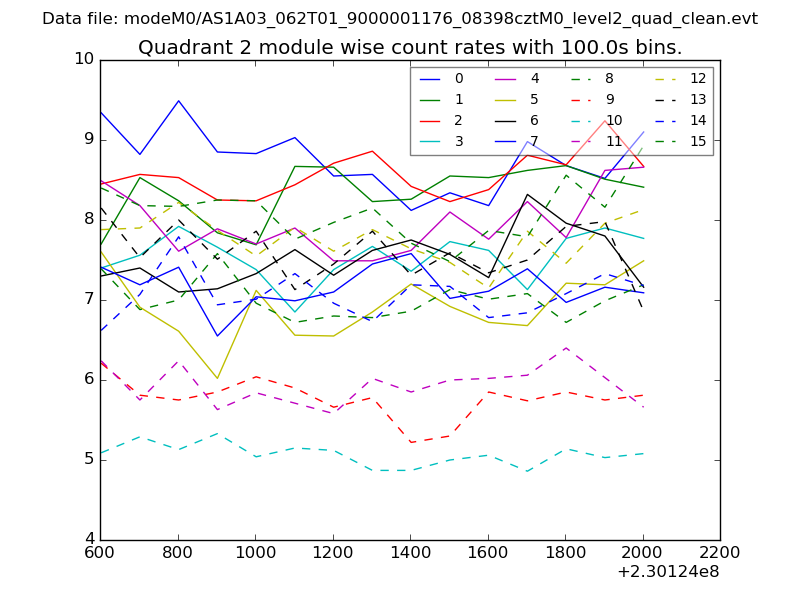
| Module-wise count rates for Quadrant B Data is divided into 100 sec bins |
 |
 |
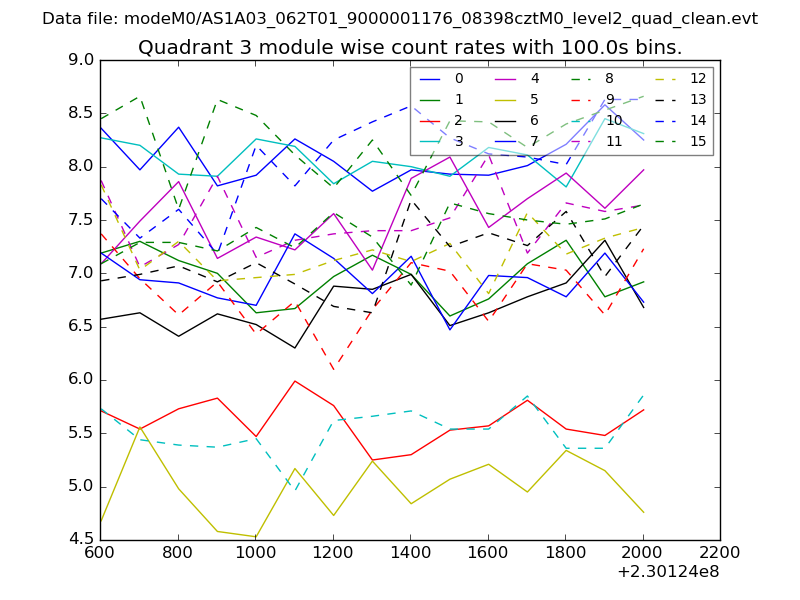
| Module-wise count rates for Quadrant C Data is divided into 100 sec bins |
 |
 |
| Module-wise count rates for Quadrant D Data is divided into 100 sec bins |
 |
 |
| Parameter | Plot |
|---|---|
| CZT HV Monitor | 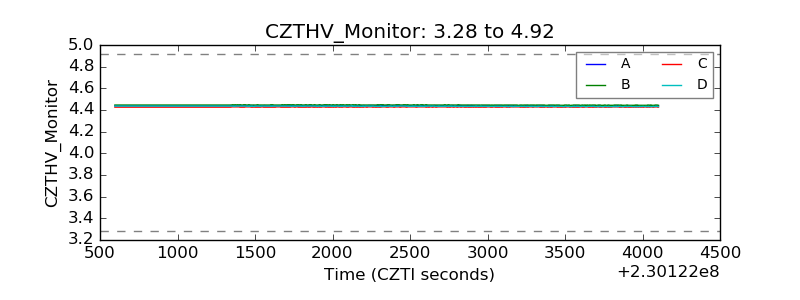 |
| D_VDD | 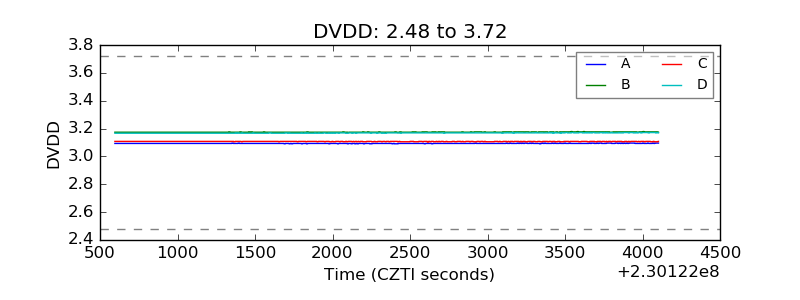 |
| Temperature 1 | 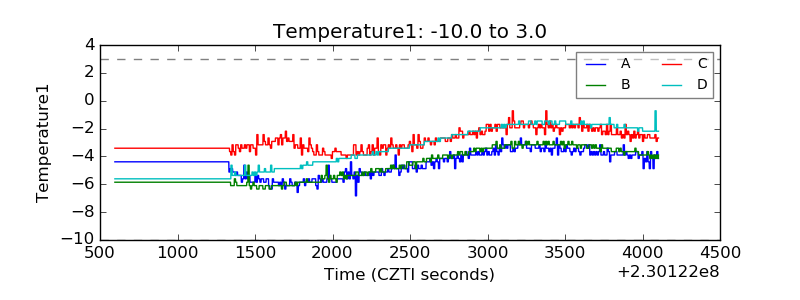 |
| Veto HV Monitor | 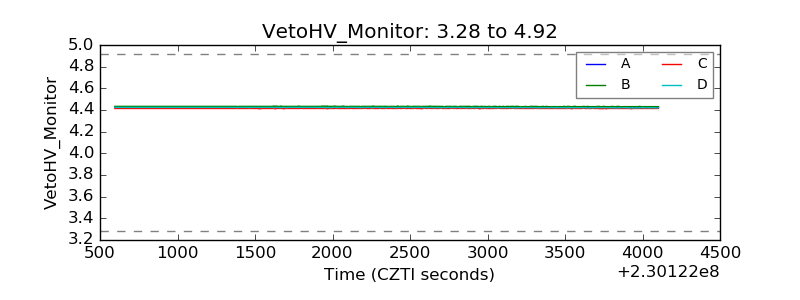 |
| Veto LLD | 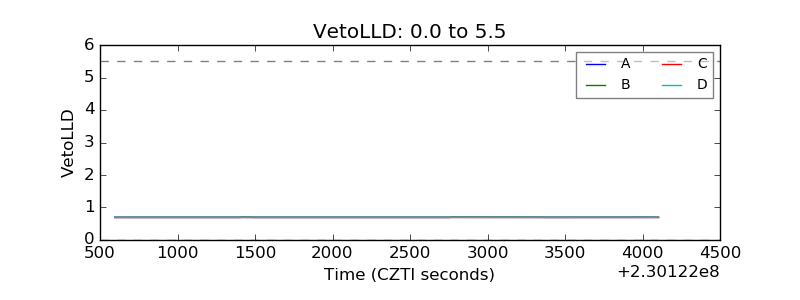 |
| Alpha Counter | 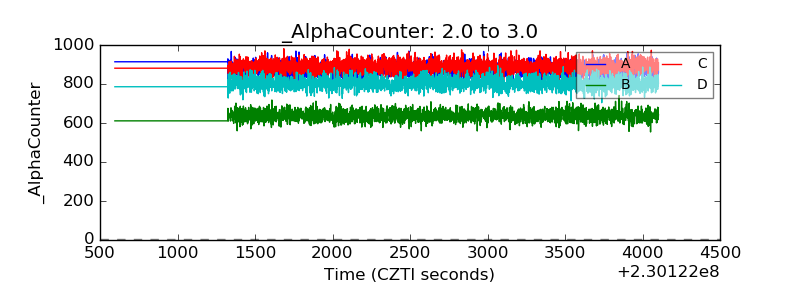 |
| _CPM_Rate | 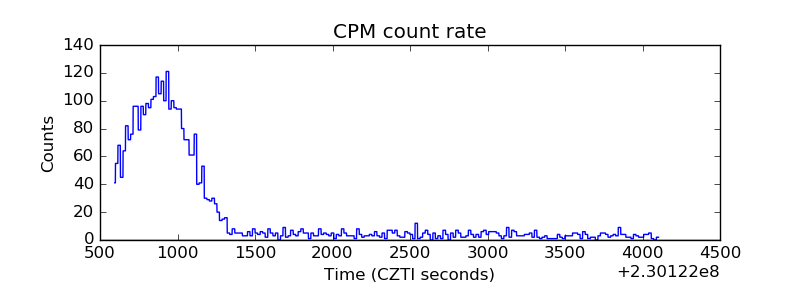 |
| CZT Counter | 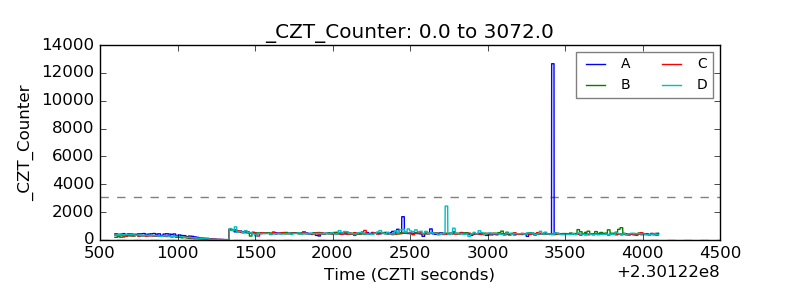 |
| +2.5 Volts monitor |  |
| +5 Volts monitor |  |
| _ROLL_ROT | 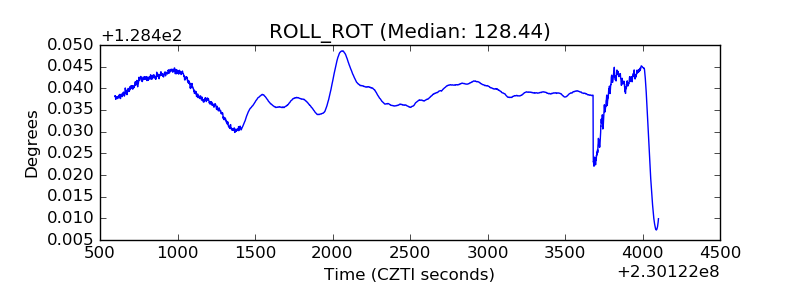 |
| _Roll_DEC | 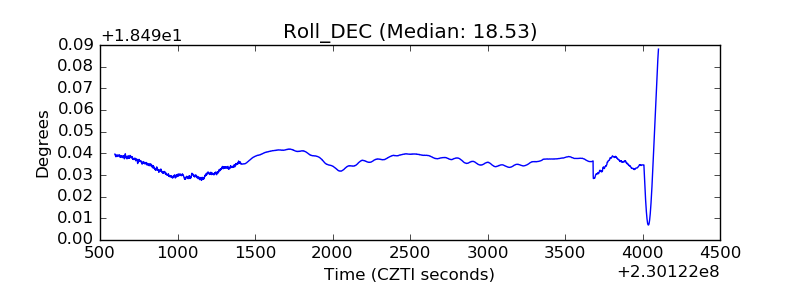 |
| _Roll_RA | 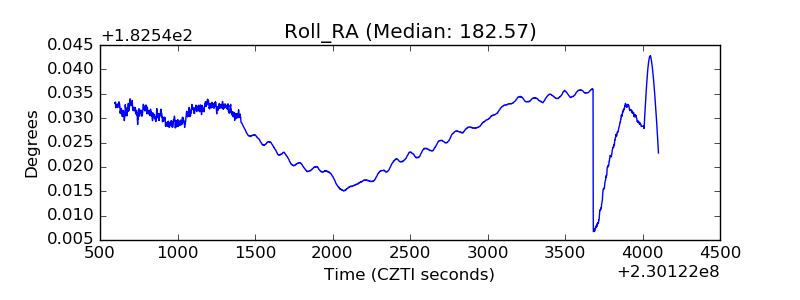 |
| Veto Counter | 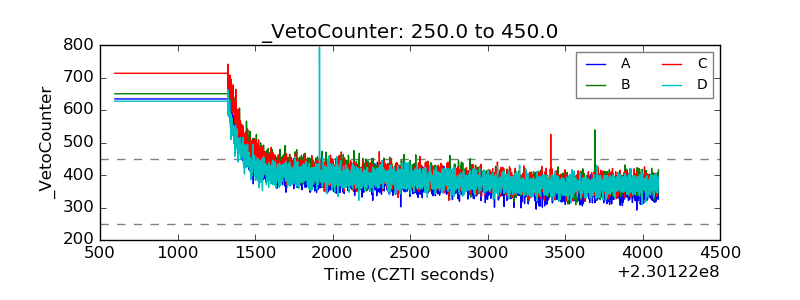 |