| Param | Original file | Final file |
|---|---|---|
| Filename | modeM0/AS1C02_030T01_9000001168cztM0_level2.fits | modeM0/AS1C02_030T01_9000001168cztM0_level2_quad_clean.evt |
| Size (bytes) | 144,653,760 | 136,699,200 |
| Size | 138.0 MB | 130.4 MB |
| Events in quadrant A | 883,058 | 805,787 |
| Events in quadrant B | 851,664 | 815,241 |
| Events in quadrant C | 861,048 | 774,672 |
| Events in quadrant D | 749,542 | 707,535 |
| Mode SS | |||
|---|---|---|---|
| Quadrant | BADHDUFLAG | Total packets | Discarded packets |
| A | 0 | 306 | 0 |
| B | 0 | 306 | 0 |
| C | 0 | 306 | 0 |
| D | 0 | 306 | 0 |
| Mode M9 | |||
|---|---|---|---|
| Quadrant | BADHDUFLAG | Total packets | Discarded packets |
| A | 0 | 36 | 0 |
| B | 0 | 36 | 0 |
| C | 0 | 36 | 0 |
| D | 0 | 36 | 0 |
| Mode M0 | |||
|---|---|---|---|
| Quadrant | BADHDUFLAG | Total packets | Discarded packets |
| A | 0 | 30931 | 0 |
| B | 0 | 31498 | 0 |
| C | 0 | 30482 | 0 |
| D | 0 | 32617 | 0 |
| Quadrant | Total seconds | Saturated seconds | Saturation percentage |
|---|---|---|---|
| A | 15010 | 97 | 0.646236% |
| B | 15002 | 107 | 0.713238% |
| C | 15011 | 30 | 0.199853% |
| D | 15018 | 112 | 0.745772% |
Noise dominated data is calculated using 1-second bins in cleaned event files. If a bin has >2000 counts, and if more than 50% of those come from <1% of pixels, then it is considered to be noise-dominated and hence unusable.
| Quadrant | # 1 sec bins | Bins with >0 counts | Bins with >2000 counts | High rate bins dominated by noise | Noise dominated (total time) | Noise dominated (detector-on time) | Marked lightcurve |
|---|---|---|---|---|---|---|---|
| A | 18630 | 15030 | 0 | 0 | 0.00% | 0.00% | 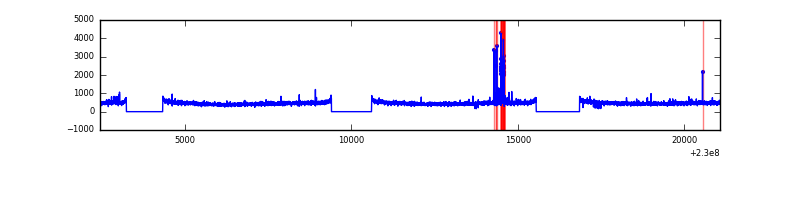 |
| B | 18630 | 15027 | 0 | 0 | 0.00% | 0.00% |  |
| C | 18630 | 15026 | 0 | 0 | 0.00% | 0.00% |  |
| D | 18630 | 15026 | 0 | 0 | 0.00% | 0.00% | 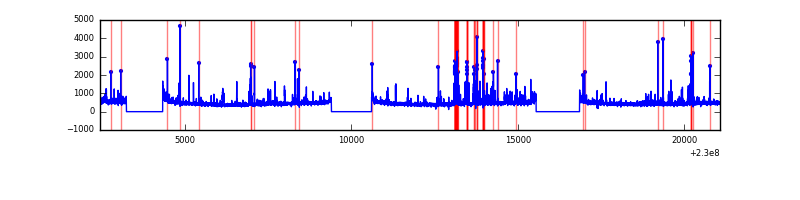 |
Top three noisy pixels from each quadrant. If the there are fewer than three noisy pixels in the level2.evt file, extra rows are filled as -1
| Pixel properties | Quadrant properties | ||||||
|---|---|---|---|---|---|---|---|
| Quadrant | DetID | PixID | Counts | Sigma | Mean | Median | Sigma |
| A | 0 | 29 | 902 | 11.6 | 230 | 218 | 59.0 |
| A | 7 | 110 | 733 | 8.73 | 230 | 218 | 59.0 |
| A | 9 | 19 | 688 | 7.97 | 230 | 218 | 59.0 |
| B | 2 | 9 | 718 | 10.79 | 225 | 216 | 46.5 |
| B | 12 | 226 | 588 | 7.99 | 225 | 216 | 46.5 |
| B | 5 | 128 | 562 | 7.44 | 225 | 216 | 46.5 |
| C | 1 | 80 | 669 | 7.39 | 227 | 212 | 61.8 |
| C | 1 | 81 | 658 | 7.21 | 227 | 212 | 61.8 |
| C | 1 | 65 | 600 | 6.28 | 227 | 212 | 61.8 |
| D | 6 | 231 | 545 | 6.08 | 213 | 195 | 57.5 |
| D | 11 | 82 | 541 | 6.01 | 213 | 195 | 57.5 |
| D | 10 | 113 | 540 | 5.99 | 213 | 195 | 57.5 |
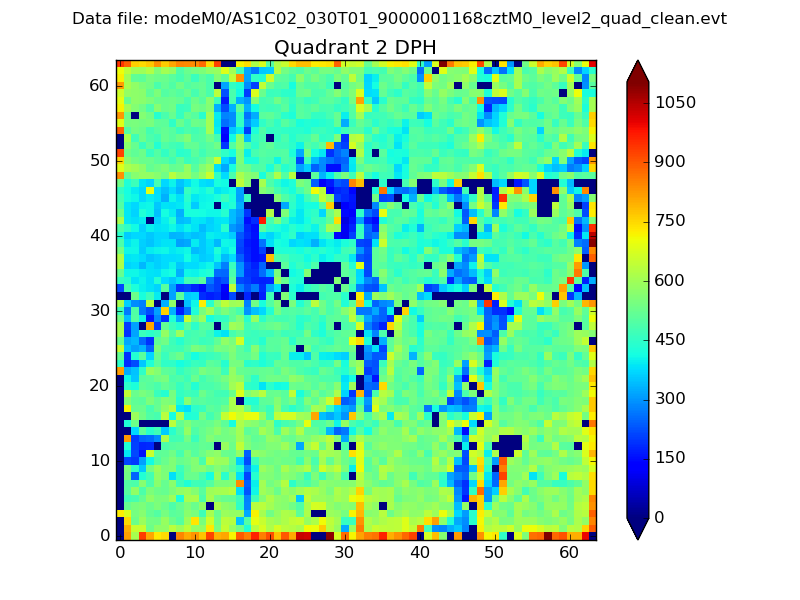
Histogram calculated using DETX and DETY for each event in the final _common_clean file
| Quadrant A | 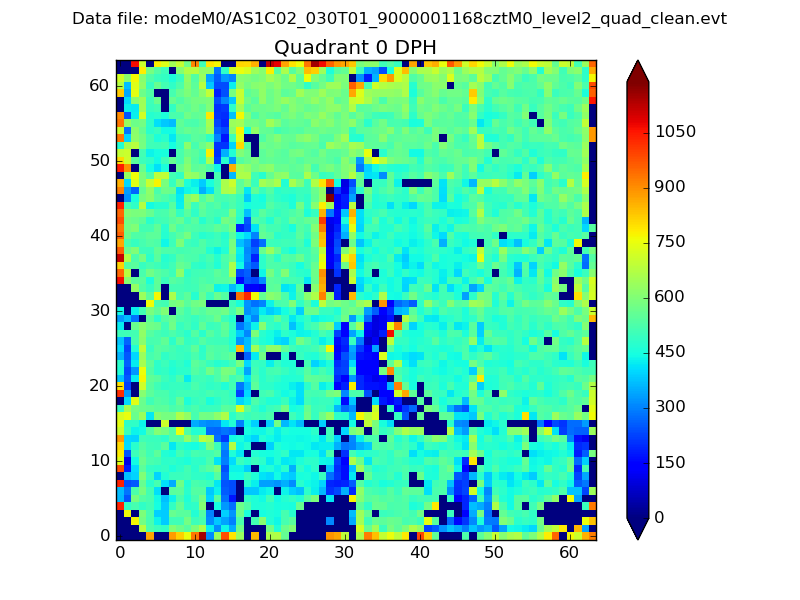 |
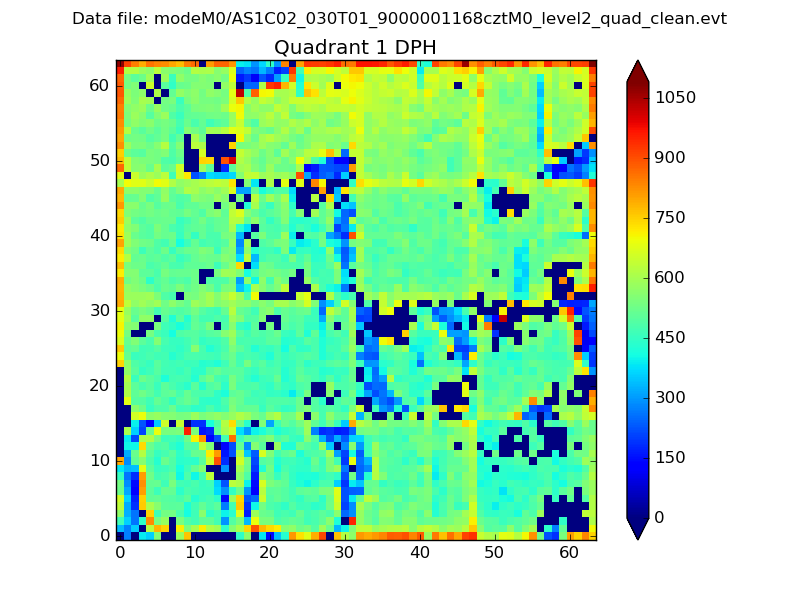 |
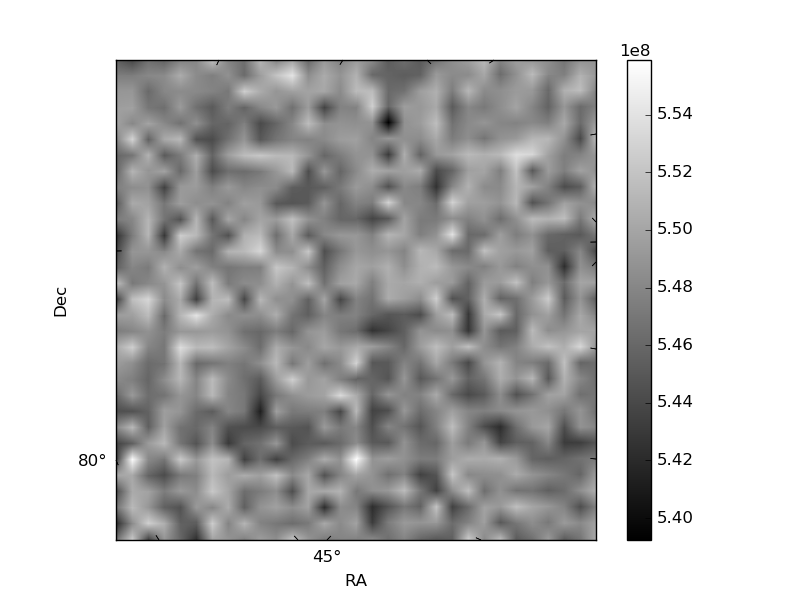
Quadrant B |
|---|---|---|---|
| Quadrant D | 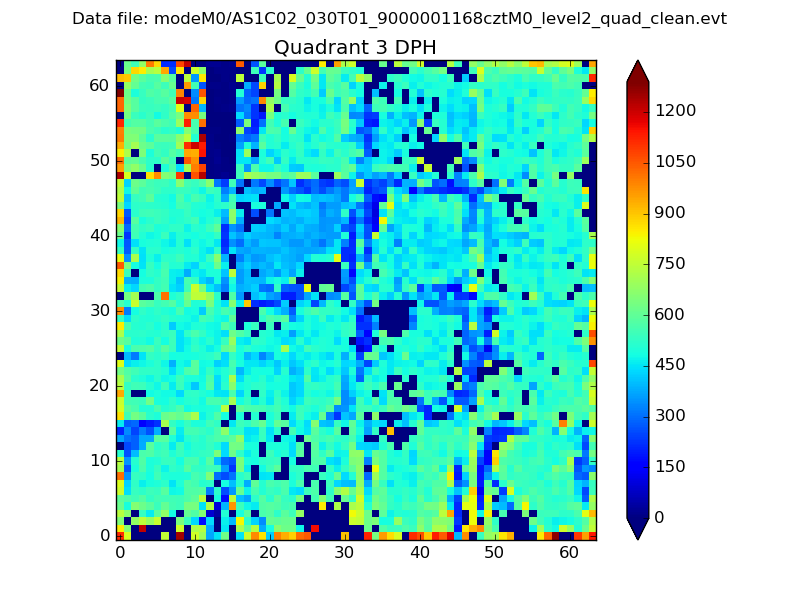 |
 |
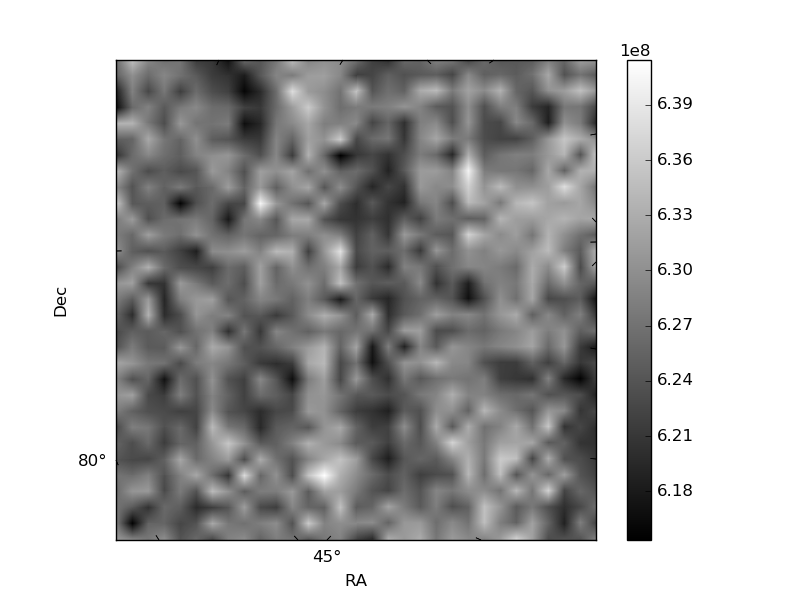
Quadrant C |
| Plot type | Count rate plots | Images |
|---|---|---|
| Comparison with Poisson distribution Blue bars denote a histogram of data divided into 1 sec bins. Red curve is a Poisson curve with rate = median count rate of data. |
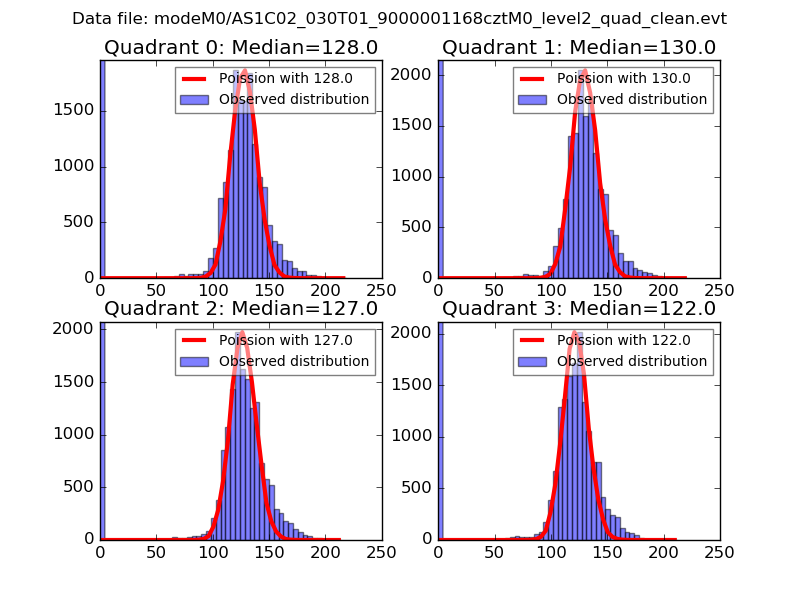 |
 |
| Quadrant-wise count rates Data is divided into 100 sec bins |
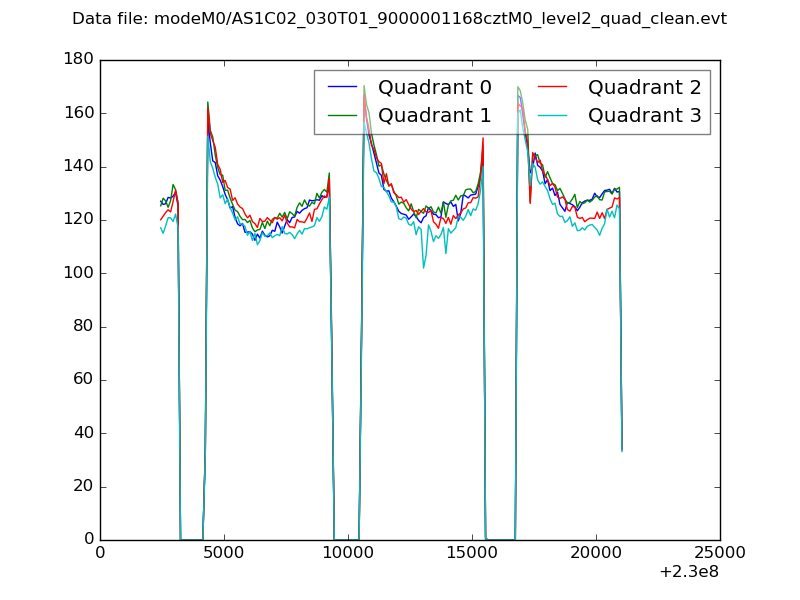 |
|
| Module-wise count rates for Quadrant A Data is divided into 100 sec bins |
 |
 |
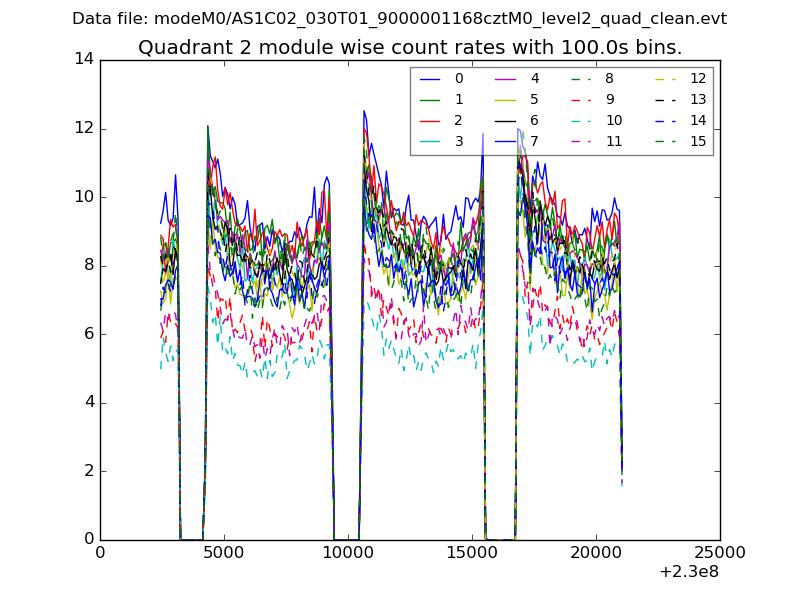
| Module-wise count rates for Quadrant B Data is divided into 100 sec bins |
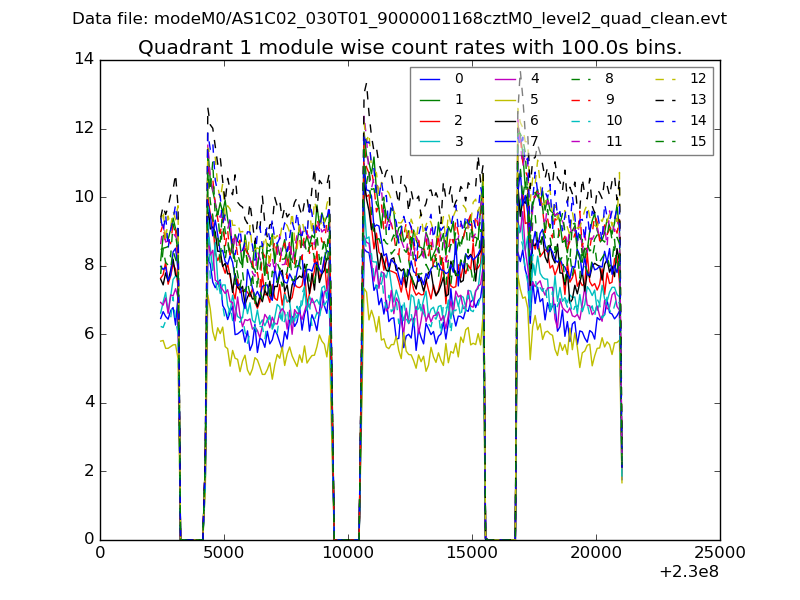 |
 |
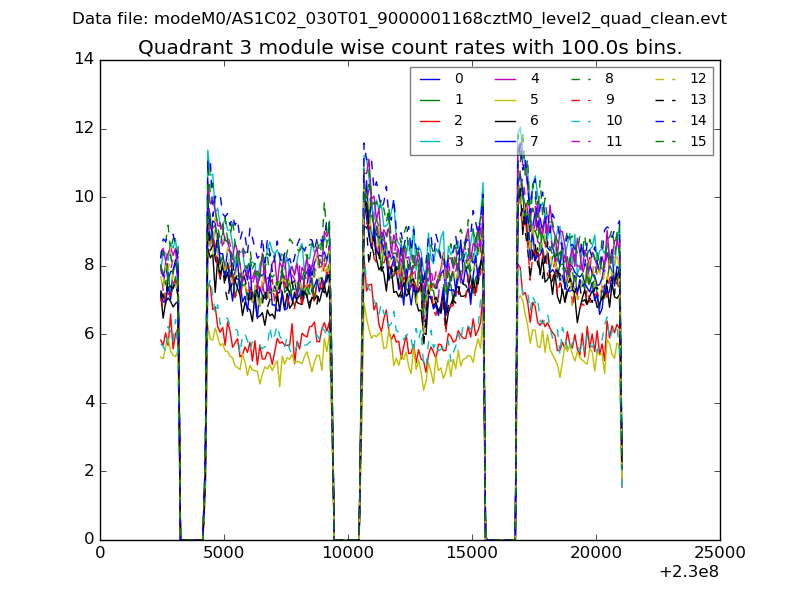
| Module-wise count rates for Quadrant C Data is divided into 100 sec bins |
 |
 |
| Module-wise count rates for Quadrant D Data is divided into 100 sec bins |
 |
 |
| Parameter | Plot |
|---|---|
| CZT HV Monitor |  |
| D_VDD | 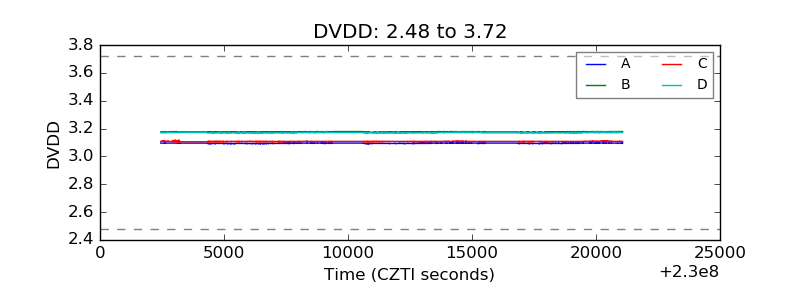 |
| Temperature 1 |  |
| Veto HV Monitor | 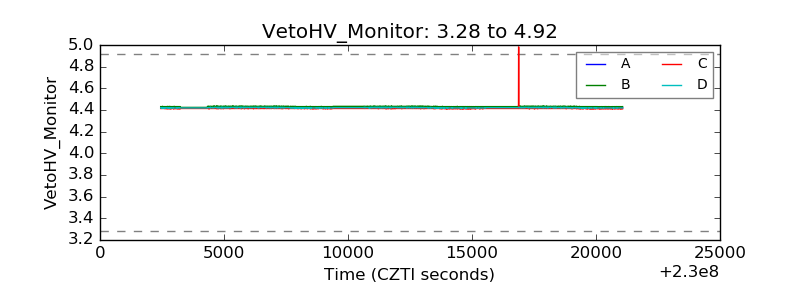 |
| Veto LLD | 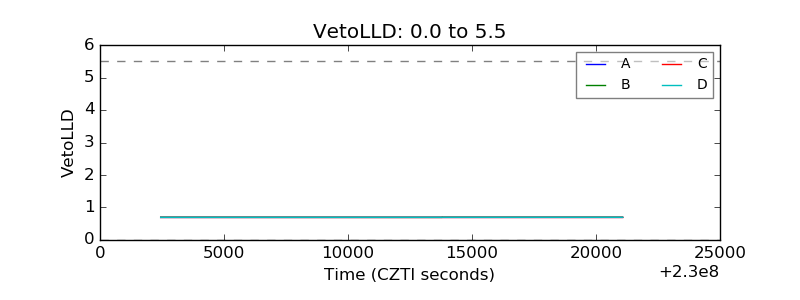 |
| Alpha Counter | 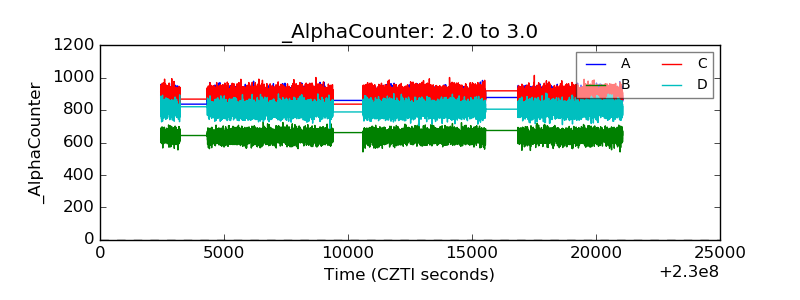 |
| _CPM_Rate | 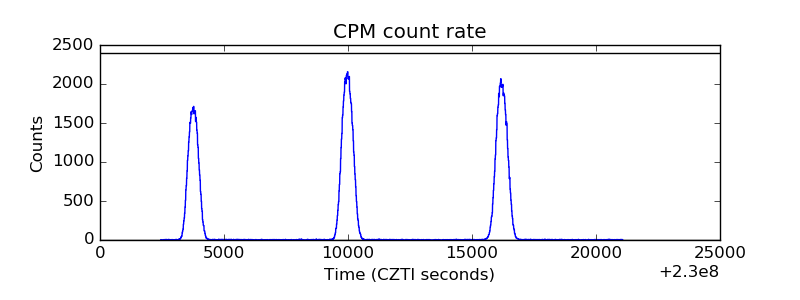 |
| CZT Counter |  |
| +2.5 Volts monitor | 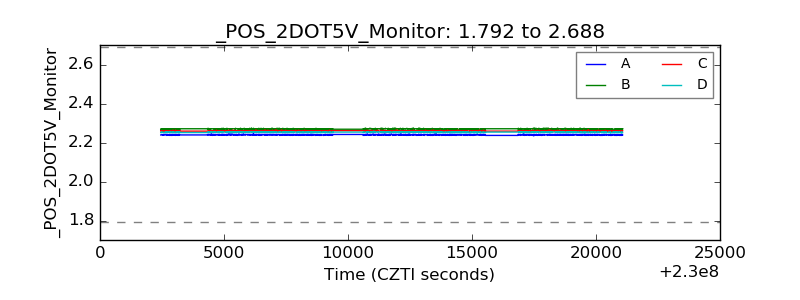 |
| +5 Volts monitor |  |
| _ROLL_ROT | 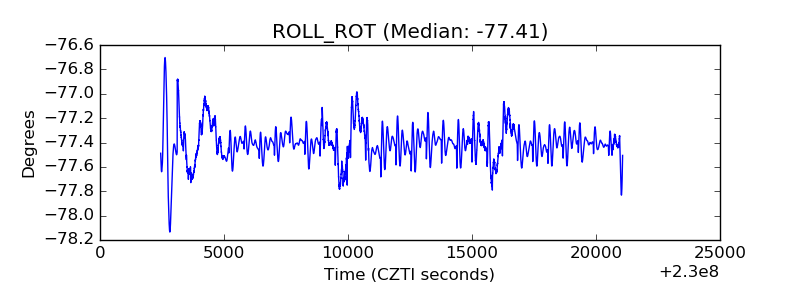 |
| _Roll_DEC | 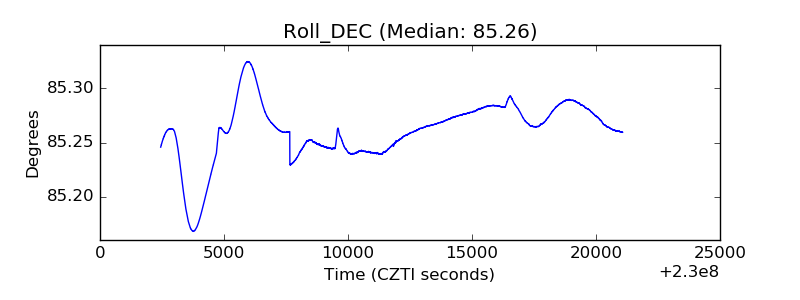 |
| _Roll_RA | 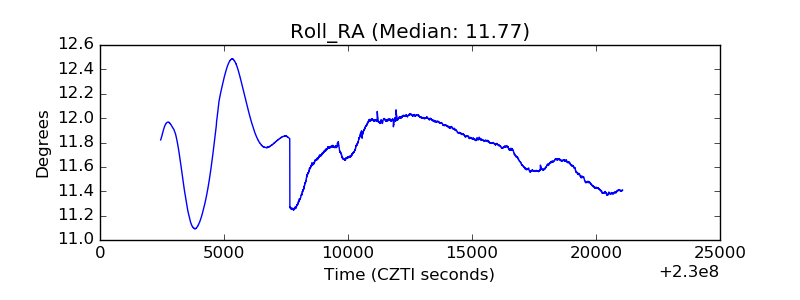 |
| Veto Counter | 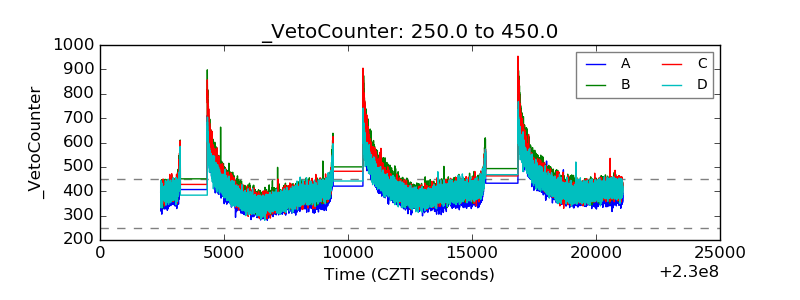 |