| Param | Original file | Final file |
|---|---|---|
| Filename | modeM0/AS1C02_030T01_9000001168_08378cztM0_level2.evt | modeM0/AS1C02_030T01_9000001168_08378cztM0_level2_quad_clean.evt |
| Size (bytes) | 411,779,520 | 124,551,360 |
| Size | 392.7 MB | 118.8 MB |
| Events in quadrant A | 2,928,963 | 828,073 |
| Events in quadrant B | 3,159,727 | 848,716 |
| Events in quadrant C | 2,888,963 | 841,240 |
| Events in quadrant D | 3,053,933 | 804,231 |
| Mode SS | |||
|---|---|---|---|
| Quadrant | BADHDUFLAG | Total packets | Discarded packets |
| A | 0 | 130 | 0 |
| B | 0 | 130 | 0 |
| C | 0 | 130 | 0 |
| D | 0 | 130 | 0 |
| Mode M9 | |||
|---|---|---|---|
| Quadrant | BADHDUFLAG | Total packets | Discarded packets |
| A | 0 | 18 | 0 |
| B | 0 | 18 | 0 |
| C | 0 | 18 | 0 |
| D | 0 | 19 | 0 |
| Mode M0 | |||
|---|---|---|---|
| Quadrant | BADHDUFLAG | Total packets | Discarded packets |
| A | 0 | 13161 | 3 |
| B | 0 | 13606 | 2 |
| C | 0 | 13159 | 2 |
| D | 0 | 13706 | 2 |
| Quadrant | Total seconds | Saturated seconds | Saturation percentage |
|---|---|---|---|
| A | 6458 | 30 | 0.464540% |
| B | 6458 | 50 | 0.774234% |
| C | 6458 | 14 | 0.216785% |
| D | 6458 | 27 | 0.418086% |
Noise dominated data is calculated using 1-second bins in cleaned event files. If a bin has >2000 counts, and if more than 50% of those come from <1% of pixels, then it is considered to be noise-dominated and hence unusable.
| Quadrant | # 1 sec bins | Bins with >0 counts | Bins with >2000 counts | High rate bins dominated by noise | Noise dominated (total time) | Noise dominated (detector-on time) | Marked lightcurve |
|---|---|---|---|---|---|---|---|
| A | 7663 | 6459 | 0 | 0 | 0.00% | 0.00% | 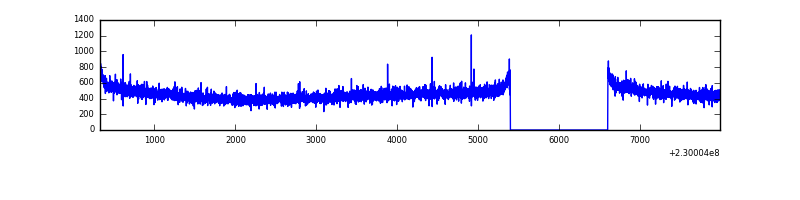 |
| B | 7663 | 6459 | 3 | 3 | 0.04% | 0.05% | 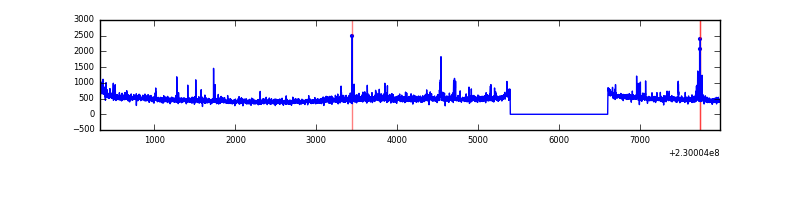 |
| C | 7663 | 6459 | 0 | 0 | 0.00% | 0.00% | 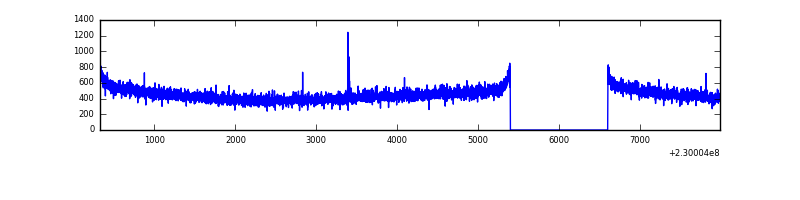 |
| D | 7663 | 6459 | 9 | 9 | 0.12% | 0.14% | 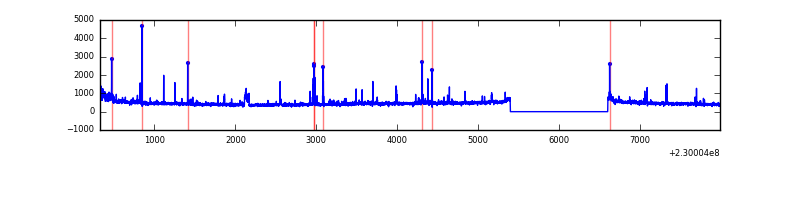 |
Top three noisy pixels from each quadrant. If the there are fewer than three noisy pixels in the level2.evt file, extra rows are filled as -1
| Pixel properties | Quadrant properties | ||||||
|---|---|---|---|---|---|---|---|
| Quadrant | DetID | PixID | Counts | Sigma | Mean | Median | Sigma |
| A | 0 | 226 | 7056 | 41.46 | 759 | 744 | 152.2 |
| A | 12 | 194 | 6873 | 40.26 | 759 | 744 | 152.2 |
| A | 13 | 14 | 5534 | 31.46 | 759 | 744 | 152.2 |
| B | 0 | 214 | 86644 | 599.21 | 767 | 750 | 143.3 |
| B | 4 | 81 | 31113 | 211.82 | 767 | 750 | 143.3 |
| B | 10 | 16 | 25770 | 174.54 | 767 | 750 | 143.3 |
| C | 1 | 16 | 10502 | 57.6 | 738 | 742 | 169.5 |
| C | 13 | 61 | 5791 | 29.8 | 738 | 742 | 169.5 |
| C | 3 | 202 | 1851 | 6.54 | 738 | 742 | 169.5 |
| D | 8 | 195 | 49452 | 264.43 | 727 | 709 | 184.3 |
| D | 1 | 52 | 45034 | 240.46 | 727 | 709 | 184.3 |
| D | 5 | 97 | 44233 | 236.11 | 727 | 709 | 184.3 |
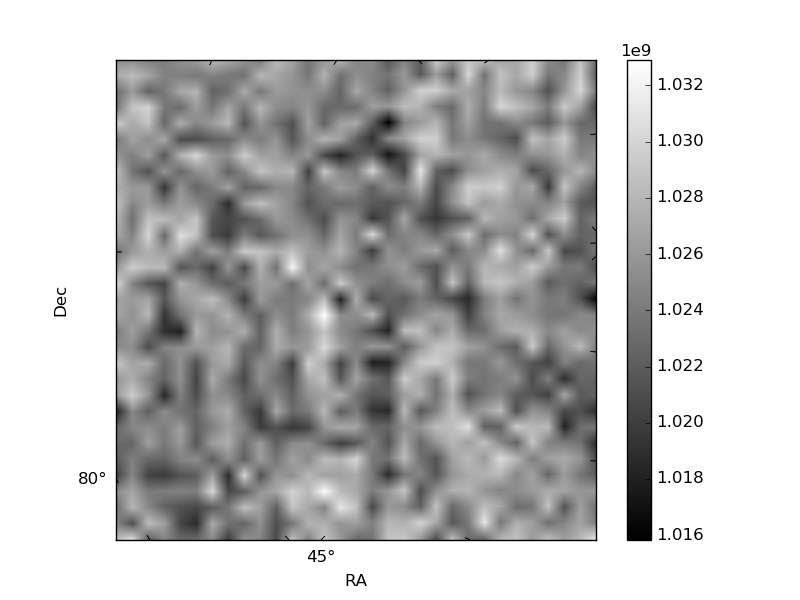
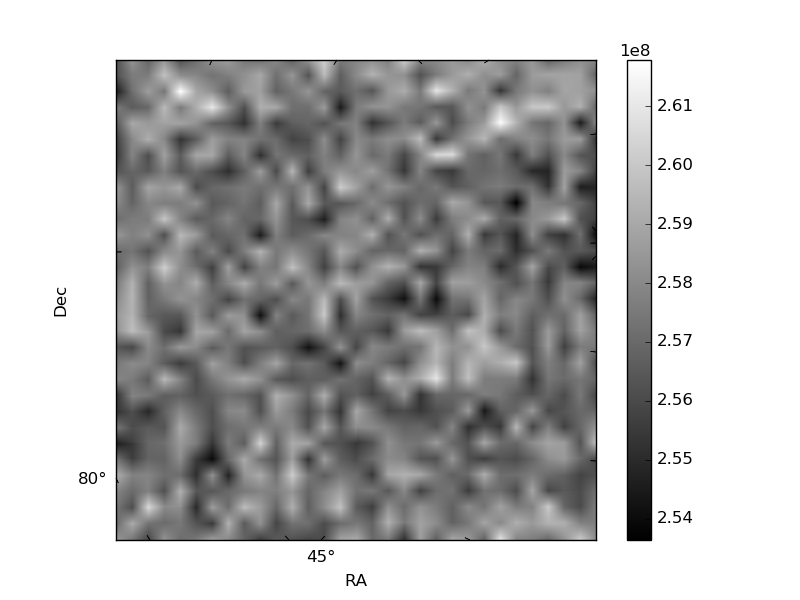
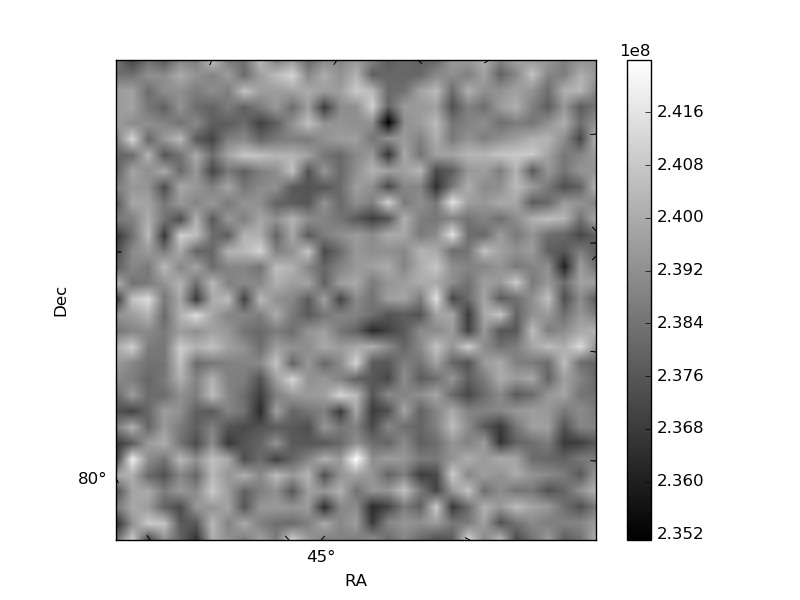
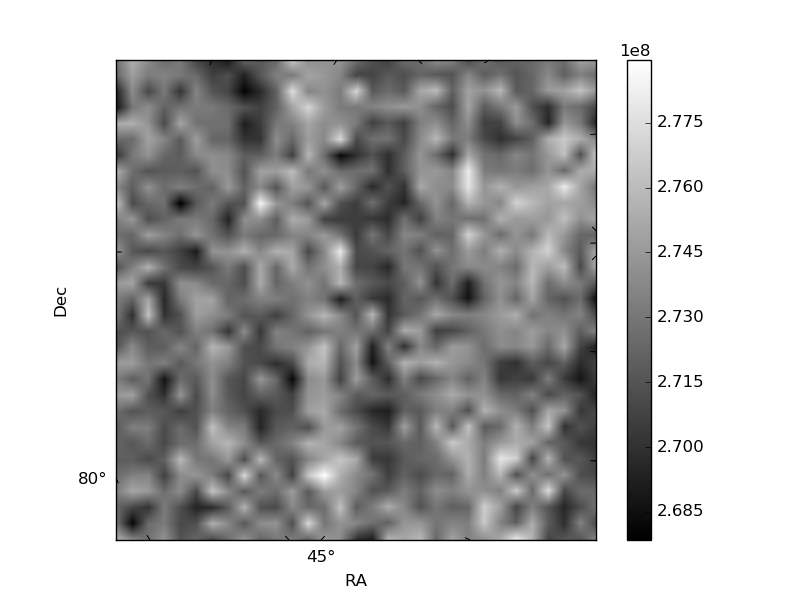
Histogram calculated using DETX and DETY for each event in the final _common_clean file
| Quadrant A | 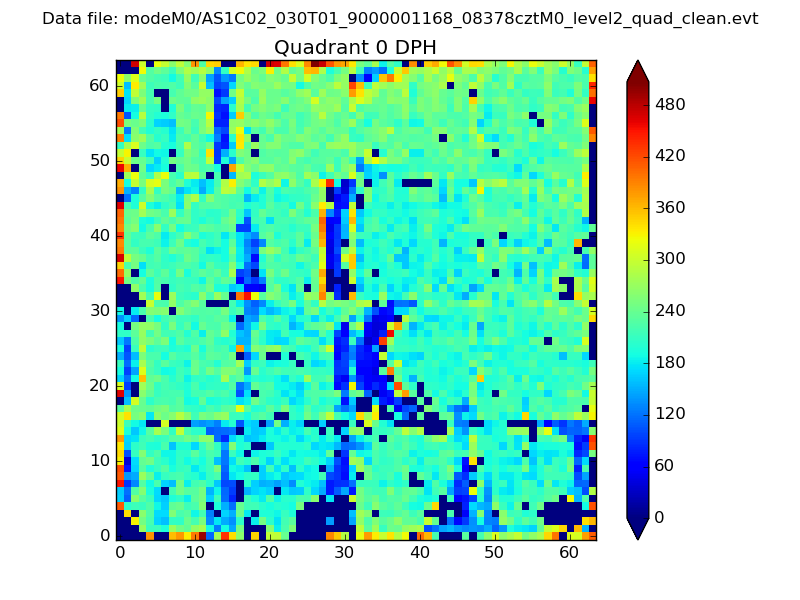 |
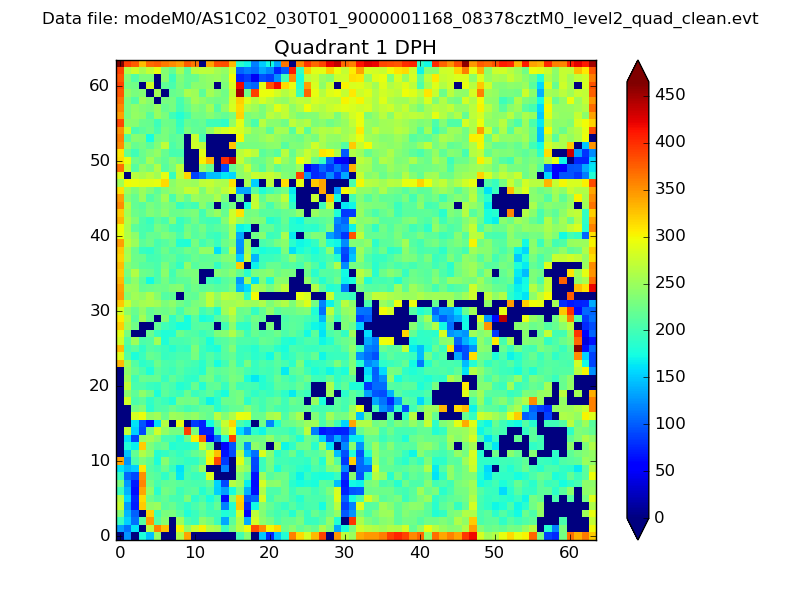 |
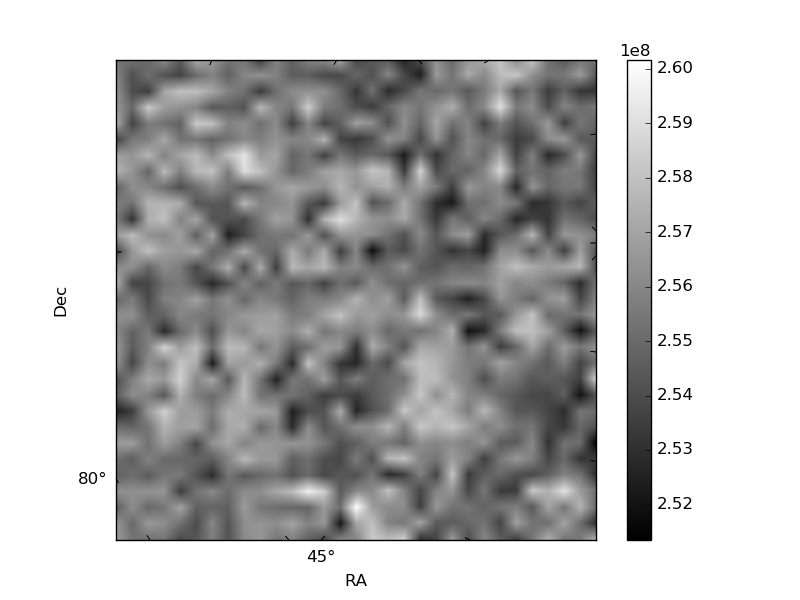
Quadrant B |
|---|---|---|---|
| Quadrant D | 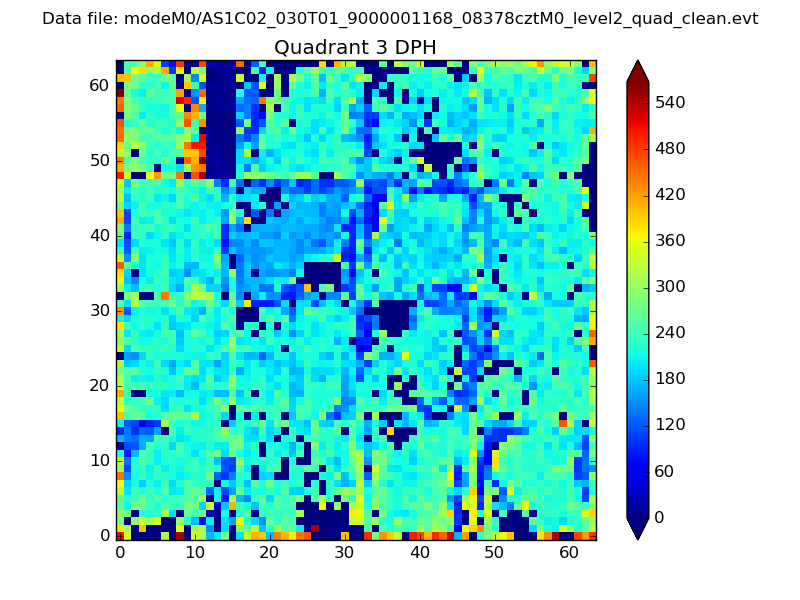 |
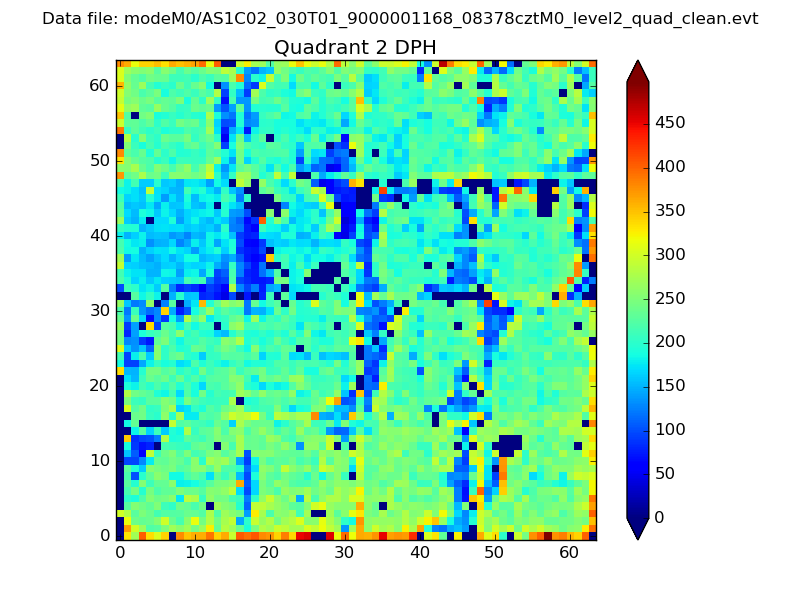 |
Quadrant C |
| Plot type | Count rate plots | Images |
|---|---|---|
| Comparison with Poisson distribution Blue bars denote a histogram of data divided into 1 sec bins. Red curve is a Poisson curve with rate = median count rate of data. |
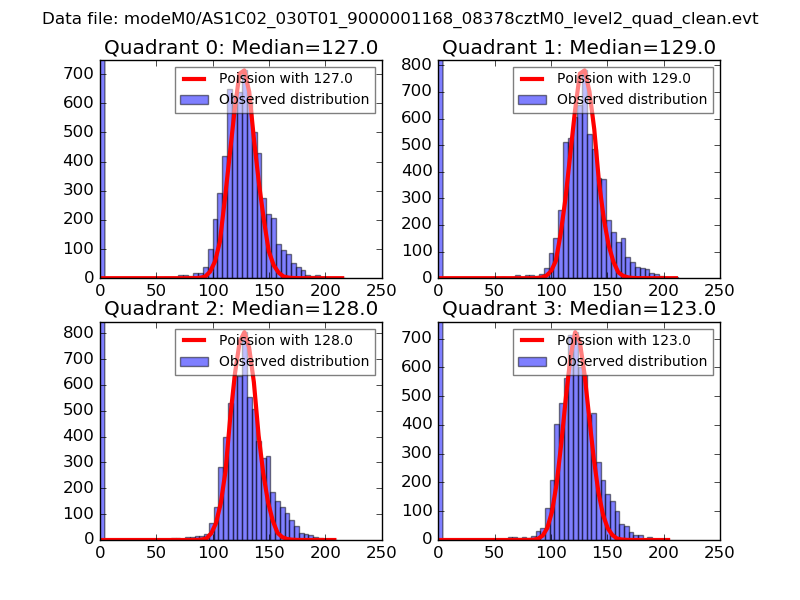 |
 |
| Quadrant-wise count rates Data is divided into 100 sec bins |
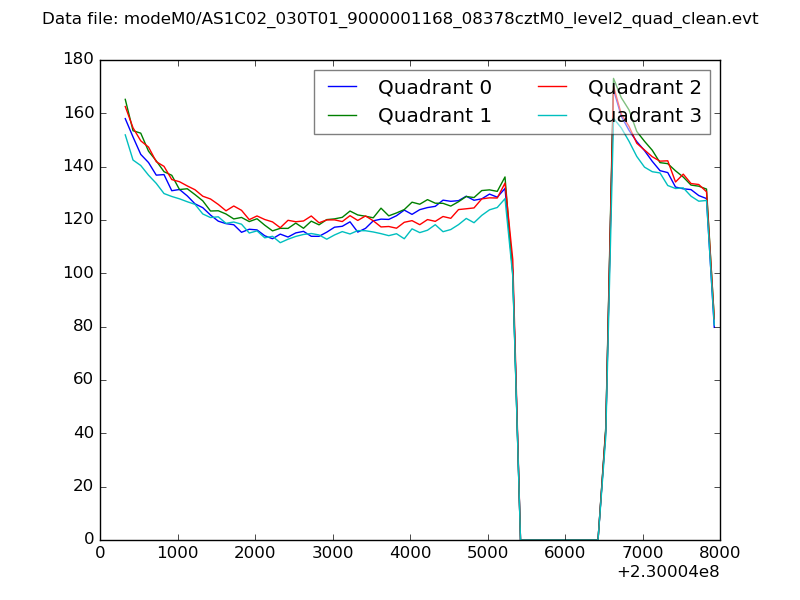 |
|
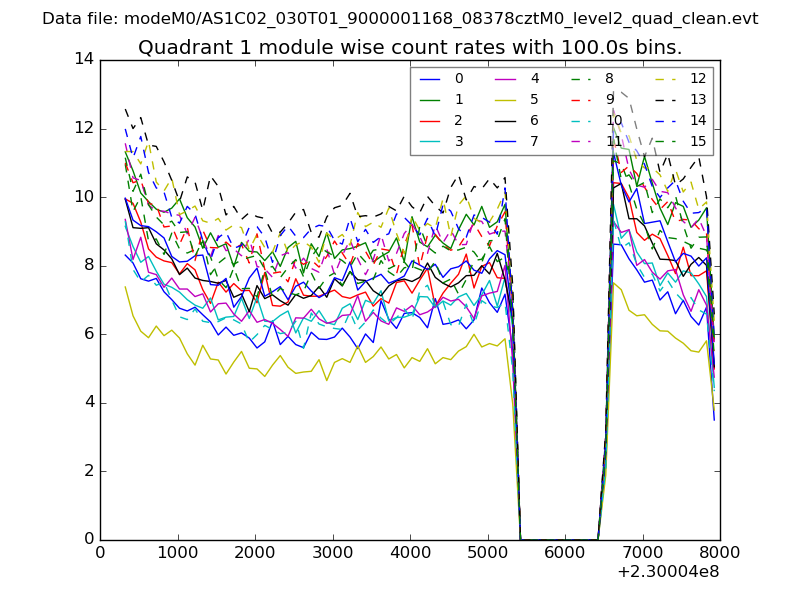
| Module-wise count rates for Quadrant A Data is divided into 100 sec bins |
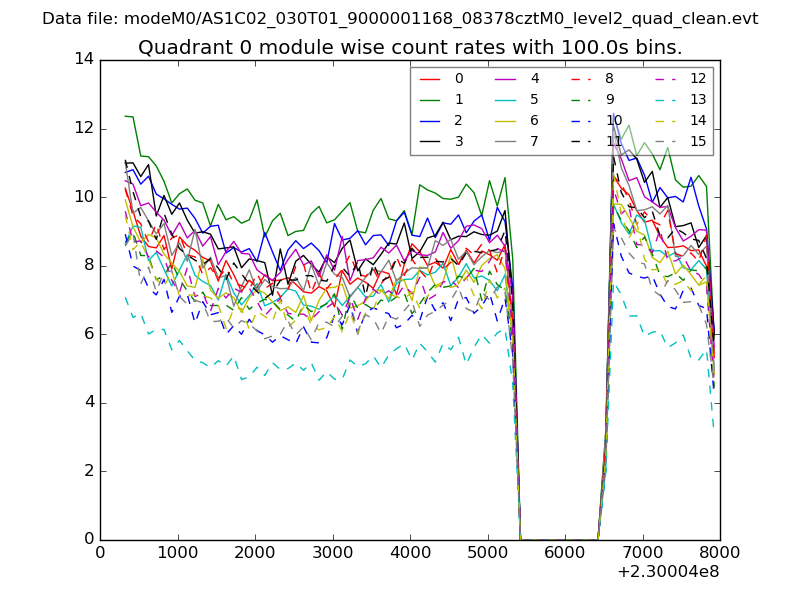 |
 |
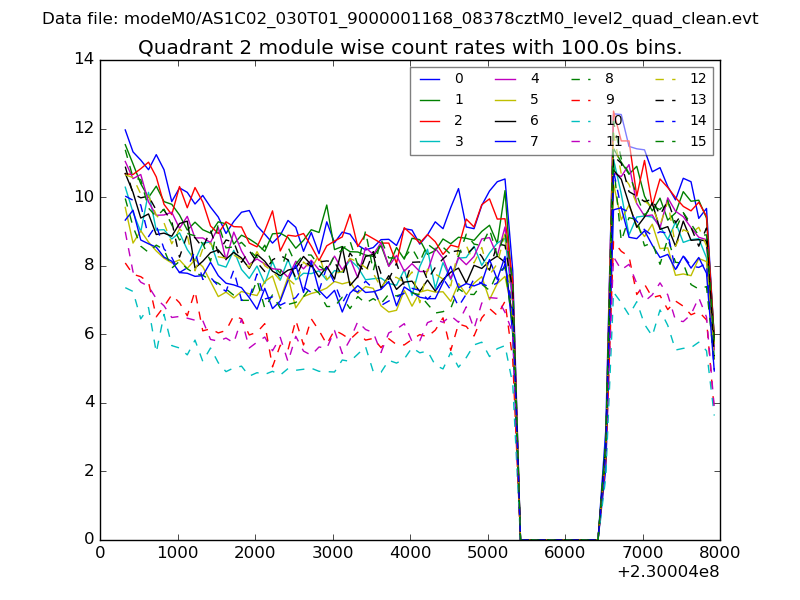
| Module-wise count rates for Quadrant B Data is divided into 100 sec bins |
 |
 |
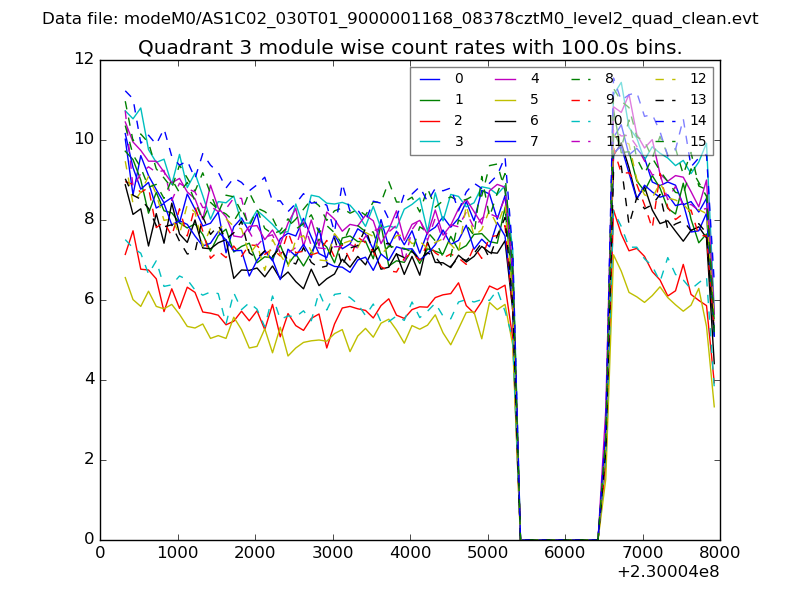
| Module-wise count rates for Quadrant C Data is divided into 100 sec bins |
 |
 |
| Module-wise count rates for Quadrant D Data is divided into 100 sec bins |
 |
 |
| Parameter | Plot |
|---|---|
| CZT HV Monitor | 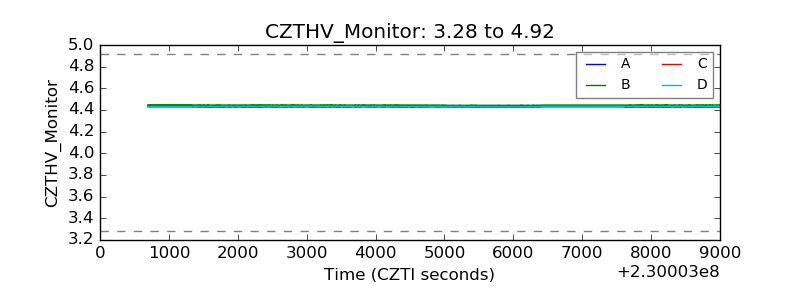 |
| D_VDD | 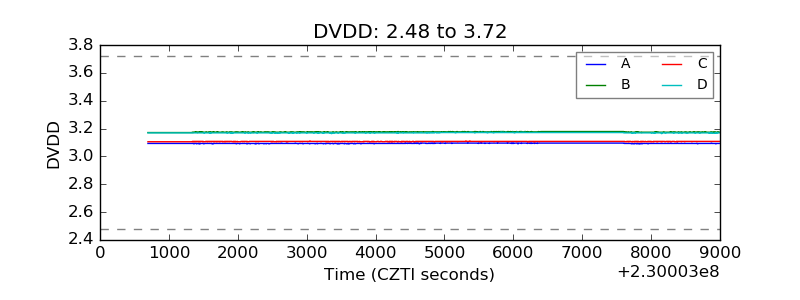 |
| Temperature 1 | 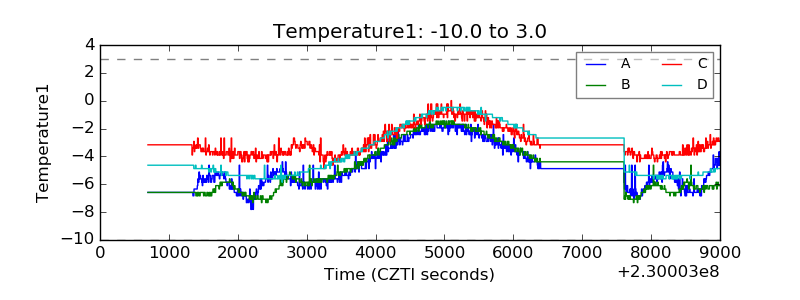 |
| Veto HV Monitor | 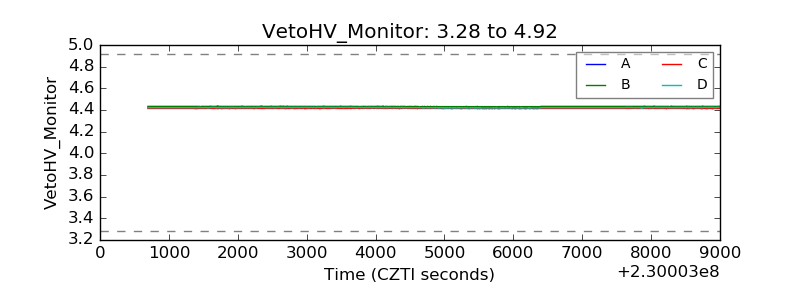 |
| Veto LLD | 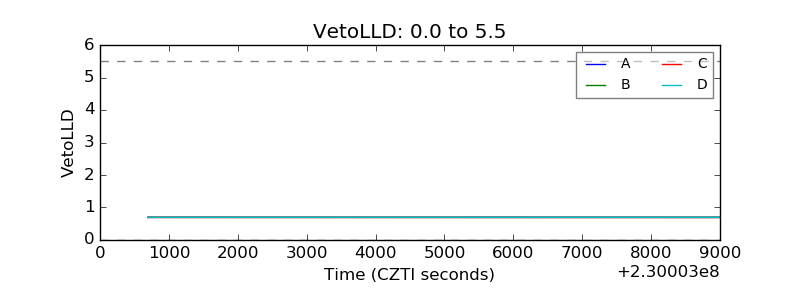 |
| Alpha Counter | 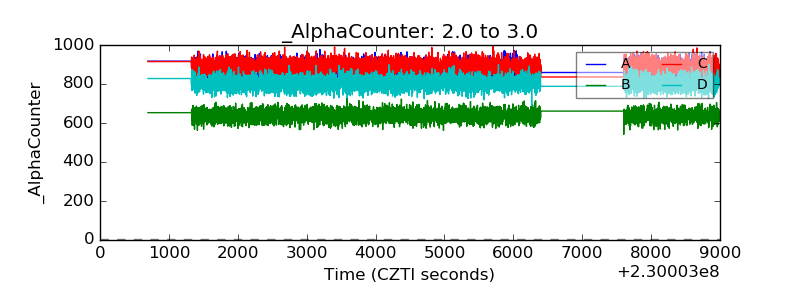 |
| _CPM_Rate | 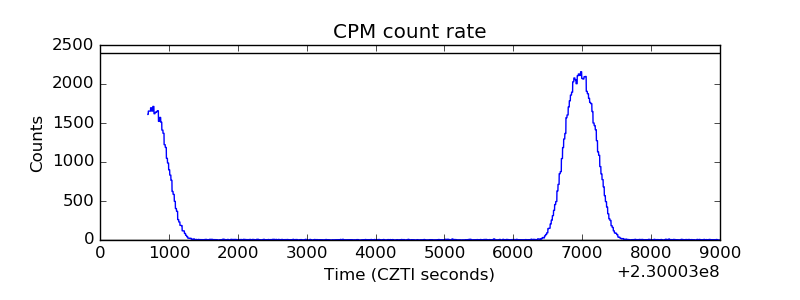 |
| CZT Counter | 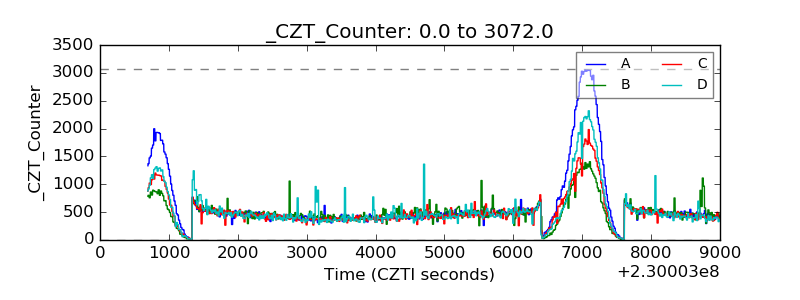 |
| +2.5 Volts monitor |  |
| +5 Volts monitor |  |
| _ROLL_ROT | 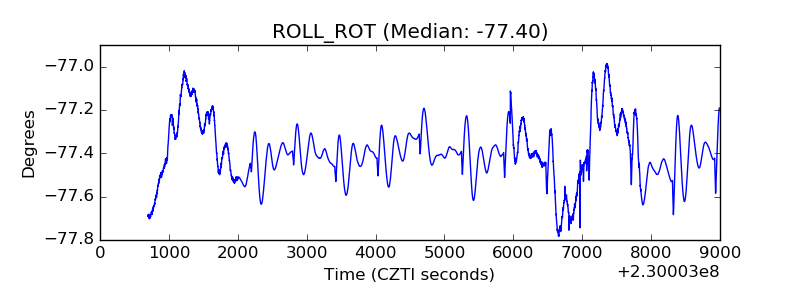 |
| _Roll_DEC | 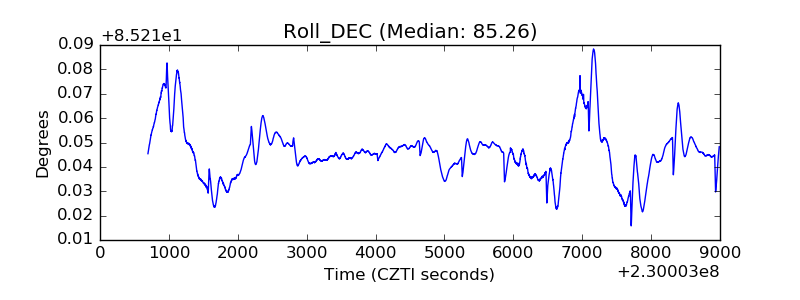 |
| _Roll_RA | 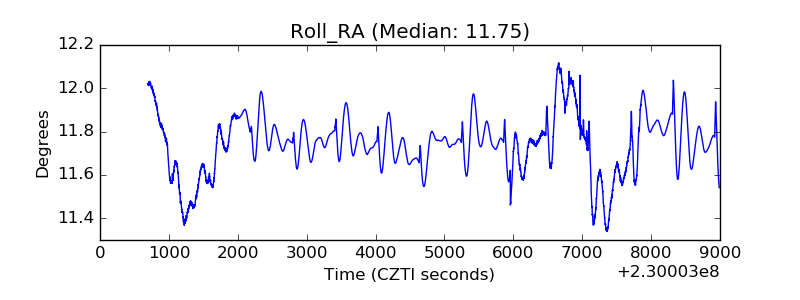 |
| Veto Counter | 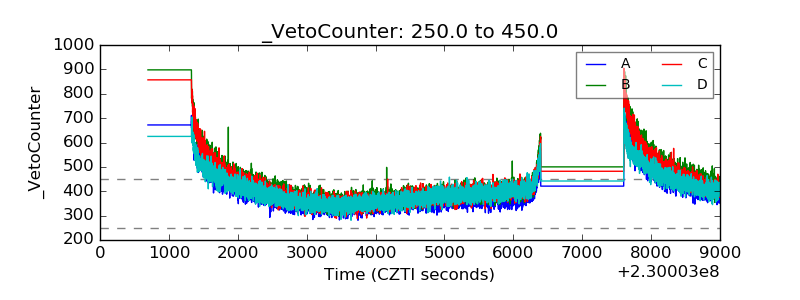 |