| Param | Original file | Final file |
|---|---|---|
| Filename | modeM0/AS1C02_030T01_9000001168_08379cztM0_level2.evt | modeM0/AS1C02_030T01_9000001168_08379cztM0_level2_quad_clean.evt |
| Size (bytes) | 396,236,160 | 118,123,200 |
| Size | 377.9 MB | 112.7 MB |
| Events in quadrant A | 2,877,679 | 794,506 |
| Events in quadrant B | 2,966,392 | 808,699 |
| Events in quadrant C | 2,680,752 | 794,177 |
| Events in quadrant D | 3,067,585 | 762,053 |
| Mode SS | |||
|---|---|---|---|
| Quadrant | BADHDUFLAG | Total packets | Discarded packets |
| A | 0 | 122 | 0 |
| B | 0 | 122 | 0 |
| C | 0 | 122 | 0 |
| D | 0 | 122 | 0 |
| Mode M9 | |||
|---|---|---|---|
| Quadrant | BADHDUFLAG | Total packets | Discarded packets |
| A | 0 | 13 | 0 |
| B | 0 | 13 | 0 |
| C | 0 | 13 | 0 |
| D | 0 | 13 | 0 |
| Mode M0 | |||
|---|---|---|---|
| Quadrant | BADHDUFLAG | Total packets | Discarded packets |
| A | 0 | 12577 | 48 |
| B | 0 | 12631 | 58 |
| C | 0 | 12194 | 40 |
| D | 0 | 13336 | 30 |
| Quadrant | Total seconds | Saturated seconds | Saturation percentage |
|---|---|---|---|
| A | 5990 | 55 | 0.918197% |
| B | 5982 | 37 | 0.618522% |
| C | 5990 | 7 | 0.116861% |
| D | 5997 | 68 | 1.133900% |
Noise dominated data is calculated using 1-second bins in cleaned event files. If a bin has >2000 counts, and if more than 50% of those come from <1% of pixels, then it is considered to be noise-dominated and hence unusable.
| Quadrant | # 1 sec bins | Bins with >0 counts | Bins with >2000 counts | High rate bins dominated by noise | Noise dominated (total time) | Noise dominated (detector-on time) | Marked lightcurve |
|---|---|---|---|---|---|---|---|
| A | 7315 | 6011 | 25 | 25 | 0.34% | 0.42% | 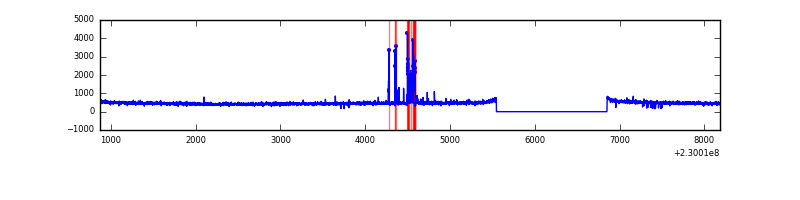 |
| B | 7315 | 6009 | 7 | 7 | 0.10% | 0.12% | 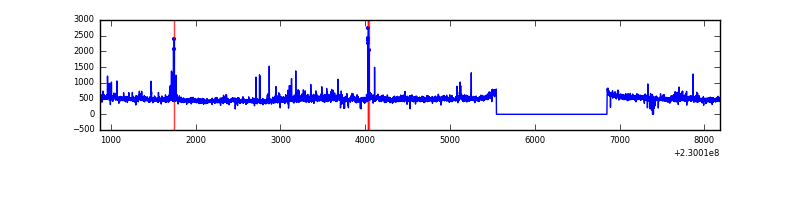 |
| C | 7315 | 6007 | 1 | 1 | 0.01% | 0.02% | 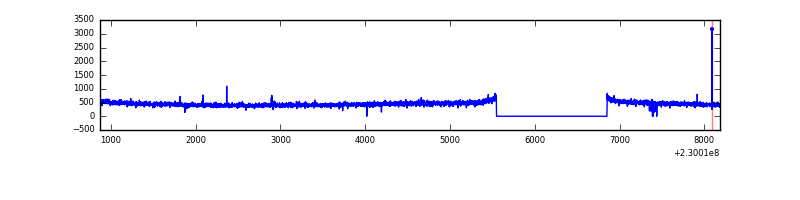 |
| D | 7315 | 6011 | 50 | 50 | 0.68% | 0.83% | 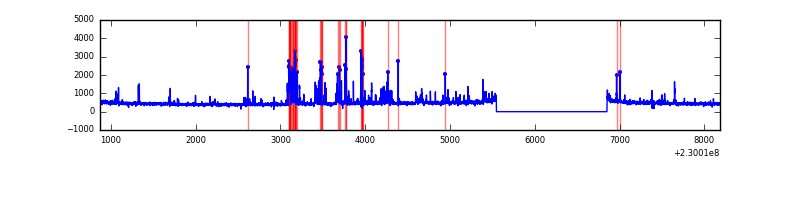 |
Top three noisy pixels from each quadrant. If the there are fewer than three noisy pixels in the level2.evt file, extra rows are filled as -1
| Pixel properties | Quadrant properties | ||||||
|---|---|---|---|---|---|---|---|
| Quadrant | DetID | PixID | Counts | Sigma | Mean | Median | Sigma |
| A | 14 | 111 | 125560 | 869.77 | 711 | 698 | 143.6 |
| A | 1 | 162 | 8344 | 53.26 | 711 | 698 | 143.6 |
| A | 0 | 226 | 7011 | 43.98 | 711 | 698 | 143.6 |
| B | 0 | 214 | 75644 | 567.42 | 714 | 698 | 132.1 |
| B | 10 | 16 | 39781 | 295.9 | 714 | 698 | 132.1 |
| B | 4 | 81 | 36857 | 273.76 | 714 | 698 | 132.1 |
| C | 1 | 16 | 15294 | 92.91 | 683 | 685 | 157.2 |
| C | 13 | 61 | 5317 | 29.46 | 683 | 685 | 157.2 |
| C | 3 | 202 | 1782 | 6.98 | 683 | 685 | 157.2 |
| D | 13 | 122 | 170170 | 1036.8 | 681 | 660 | 163.5 |
| D | 12 | 233 | 104953 | 637.9 | 681 | 660 | 163.5 |
| D | 7 | 71 | 49454 | 298.45 | 681 | 660 | 163.5 |
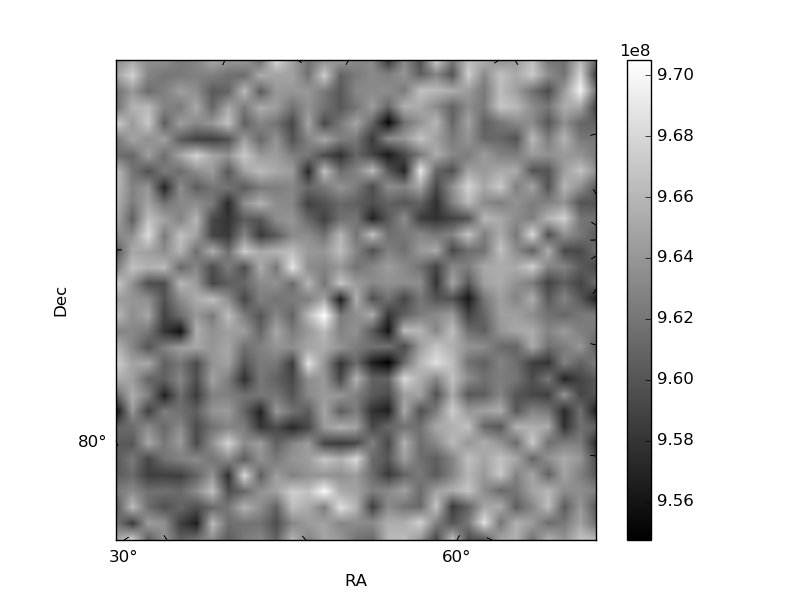
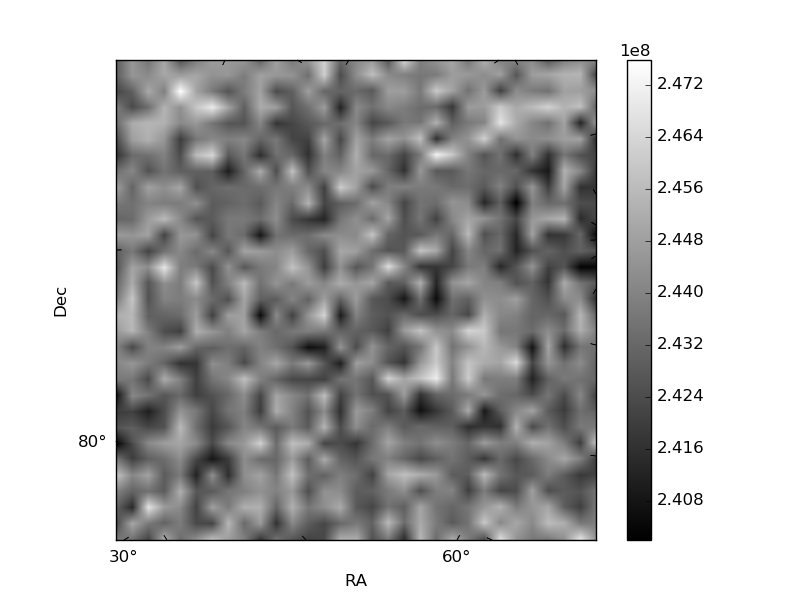
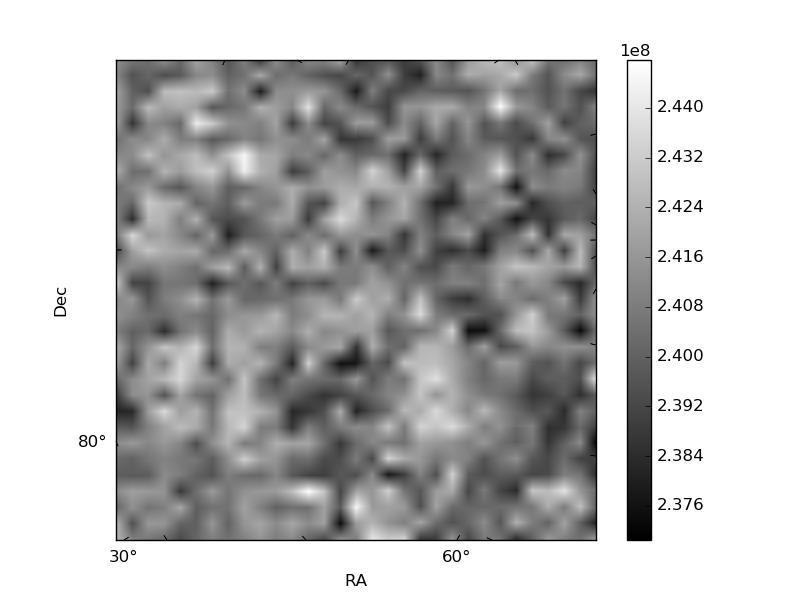
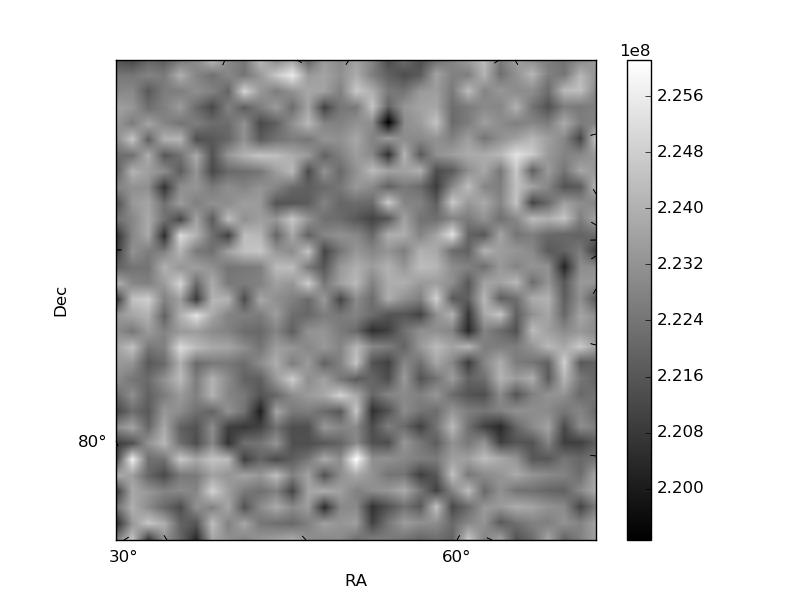
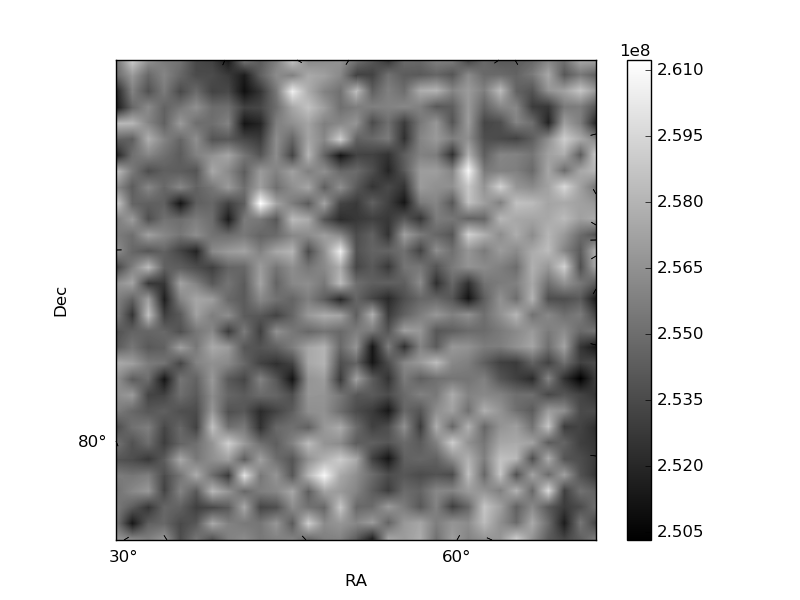
Histogram calculated using DETX and DETY for each event in the final _common_clean file
| Quadrant A | 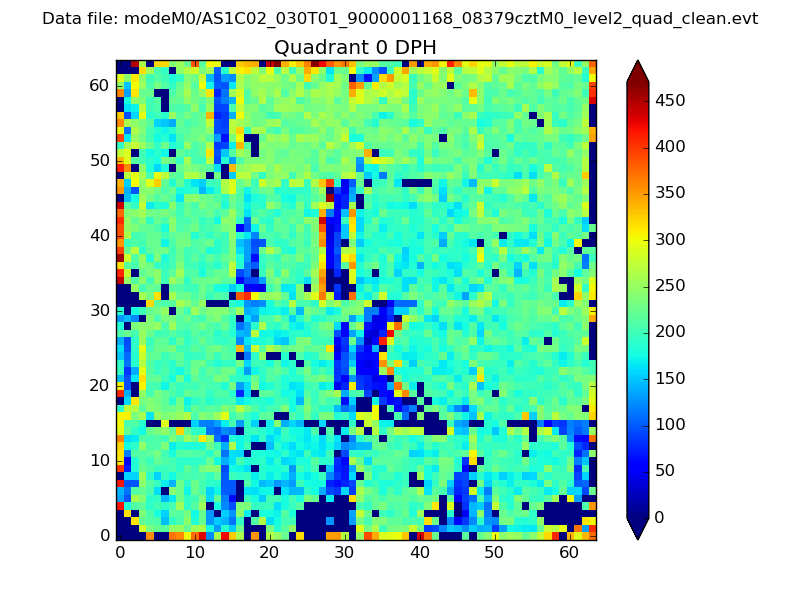 |
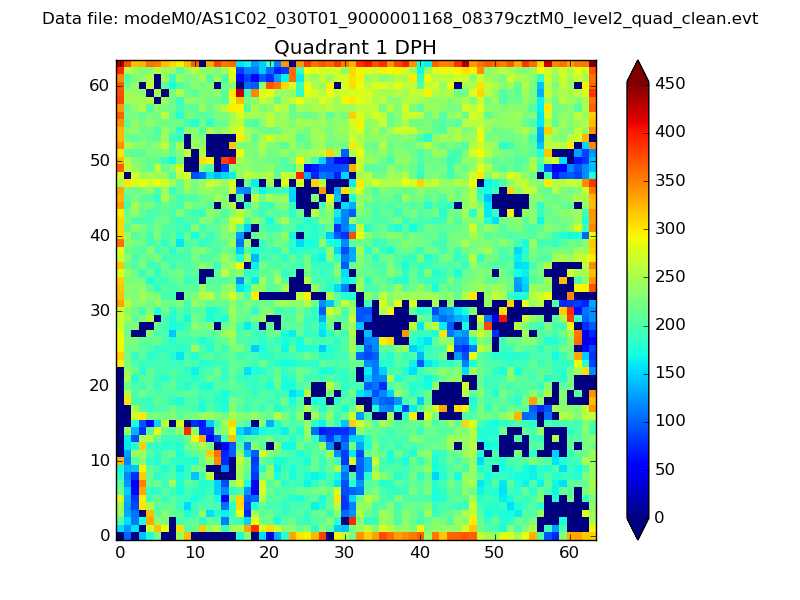 |
Quadrant B |
|---|---|---|---|
| Quadrant D | 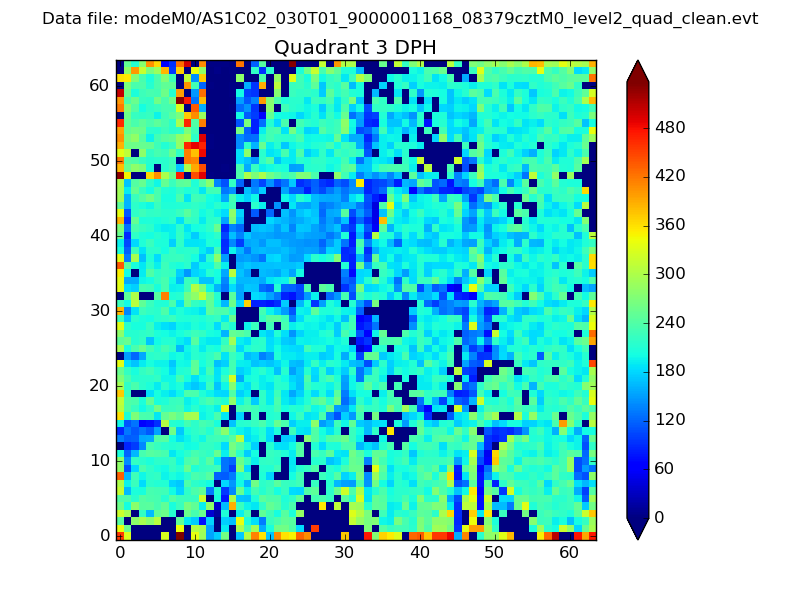 |
 |
Quadrant C |
| Plot type | Count rate plots | Images |
|---|---|---|
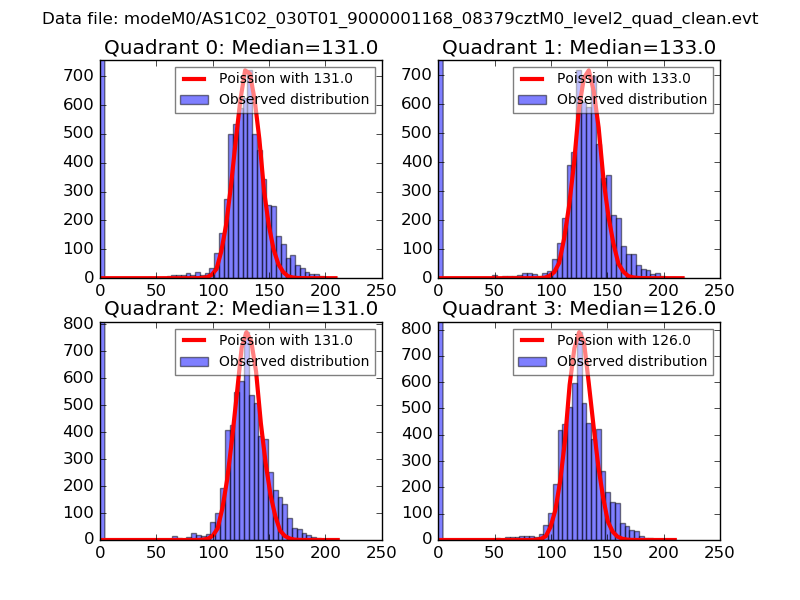
| Comparison with Poisson distribution Blue bars denote a histogram of data divided into 1 sec bins. Red curve is a Poisson curve with rate = median count rate of data. |
 |
 |
| Quadrant-wise count rates Data is divided into 100 sec bins |
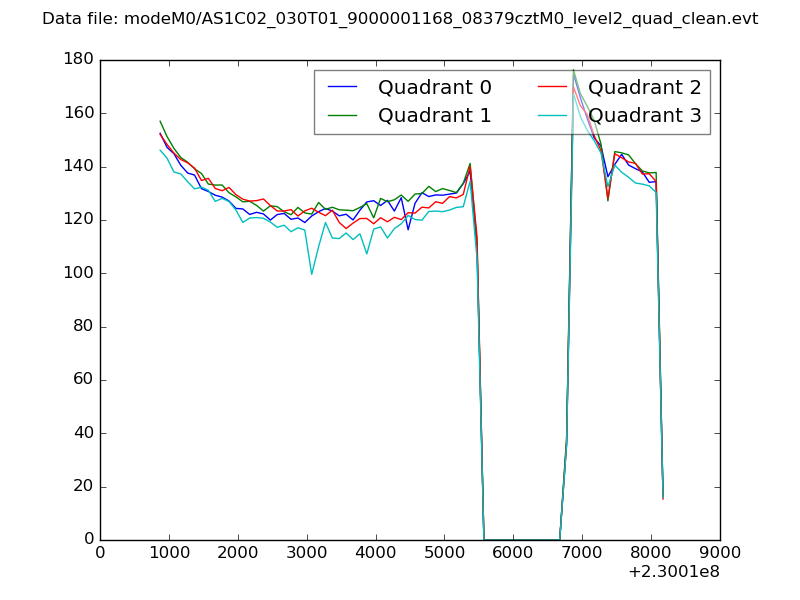 |
|
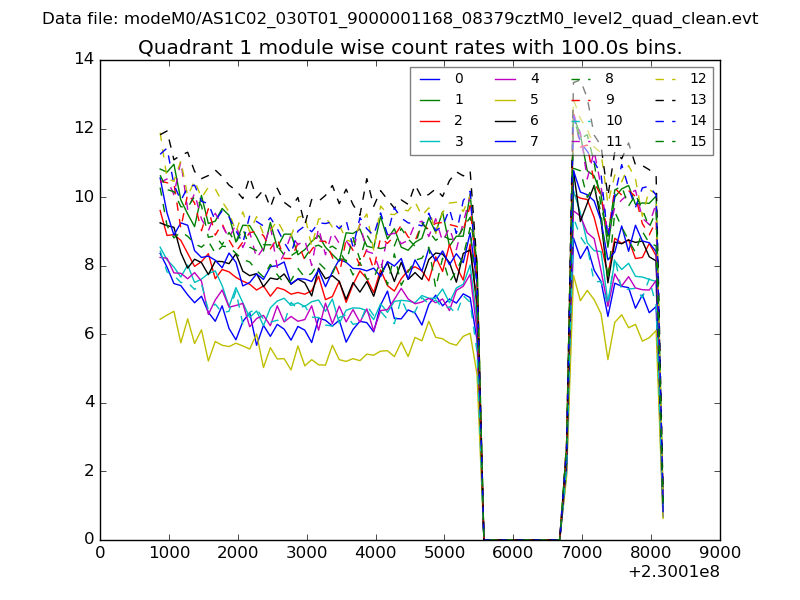
| Module-wise count rates for Quadrant A Data is divided into 100 sec bins |
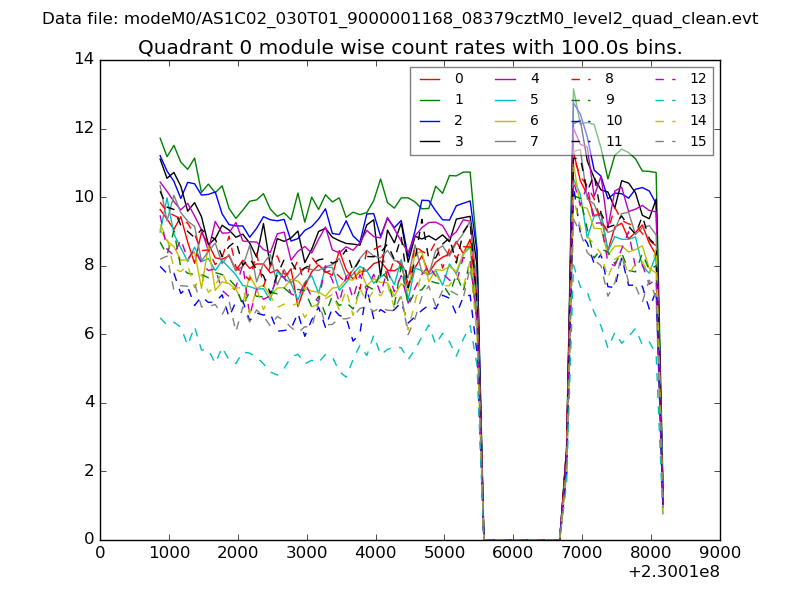 |
 |
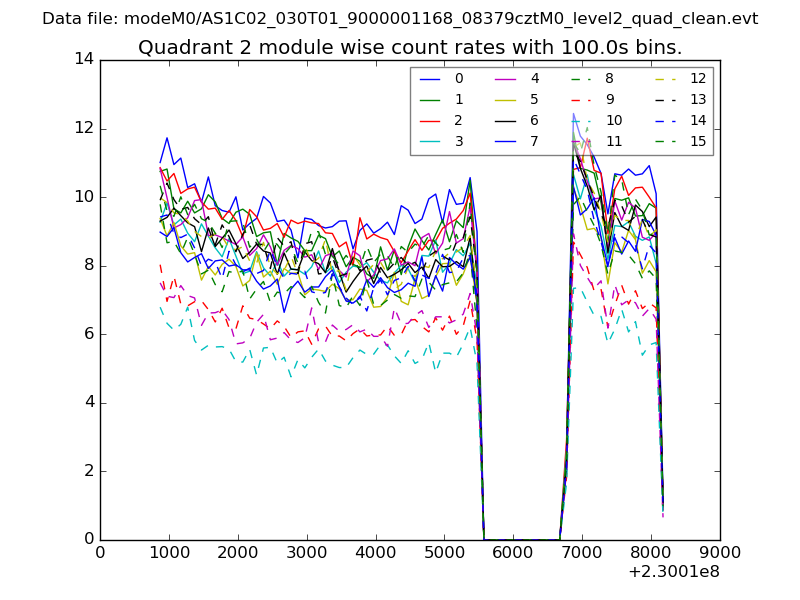
| Module-wise count rates for Quadrant B Data is divided into 100 sec bins |
 |
 |
| Module-wise count rates for Quadrant C Data is divided into 100 sec bins |
 |
 |
| Module-wise count rates for Quadrant D Data is divided into 100 sec bins |
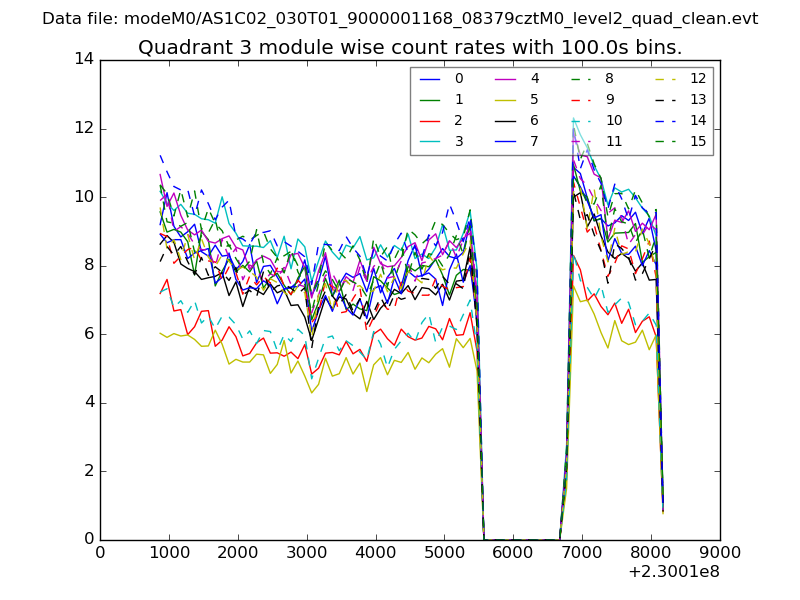 |
 |
| Parameter | Plot |
|---|---|
| CZT HV Monitor | 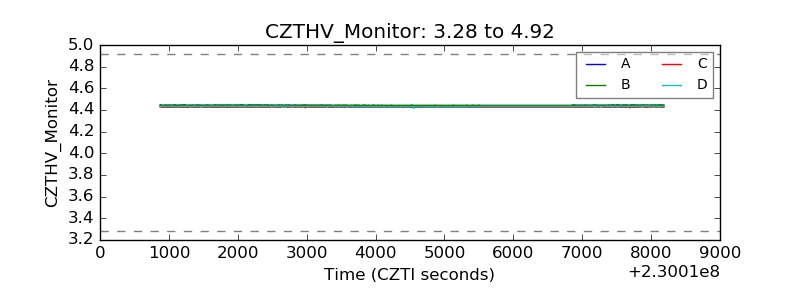 |
| D_VDD | 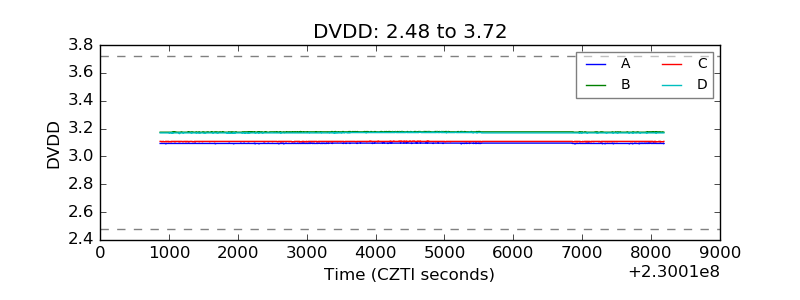 |
| Temperature 1 |  |
| Veto HV Monitor | 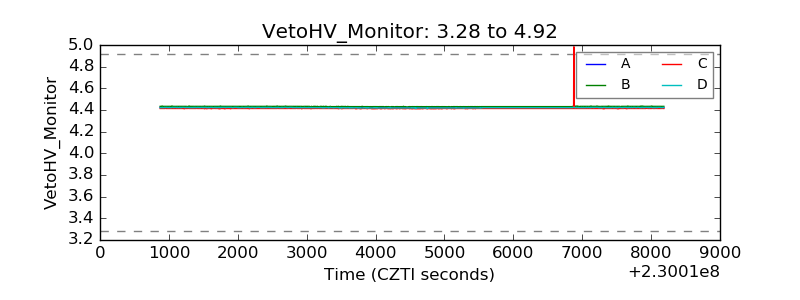 |
| Veto LLD | 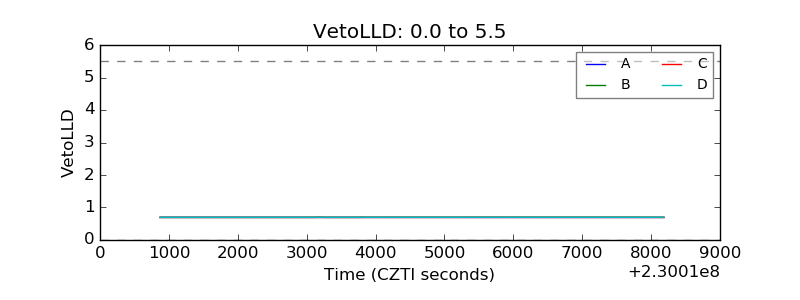 |
| Alpha Counter | 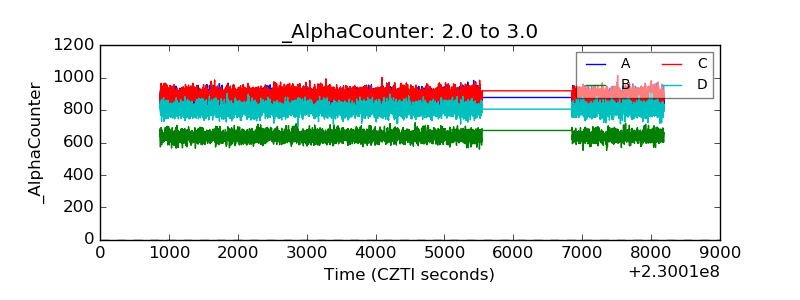 |
| _CPM_Rate | 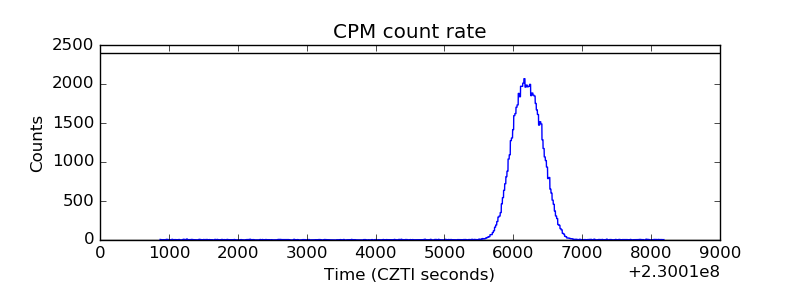 |
| CZT Counter |  |
| +2.5 Volts monitor | 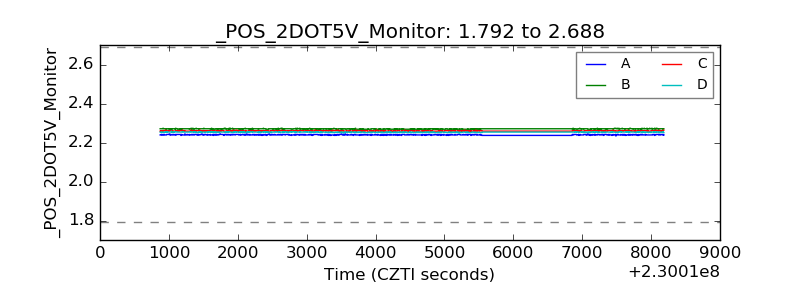 |
| +5 Volts monitor | 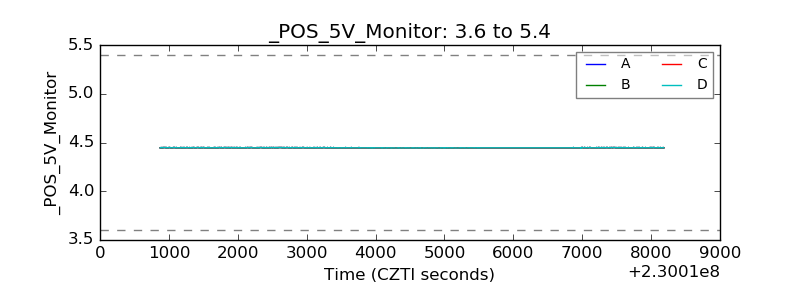 |
| _ROLL_ROT | 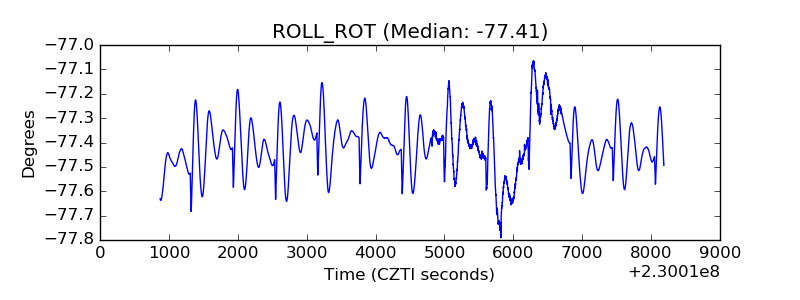 |
| _Roll_DEC | 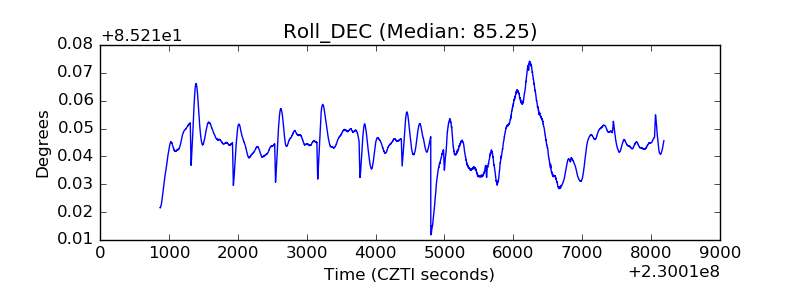 |
| _Roll_RA | 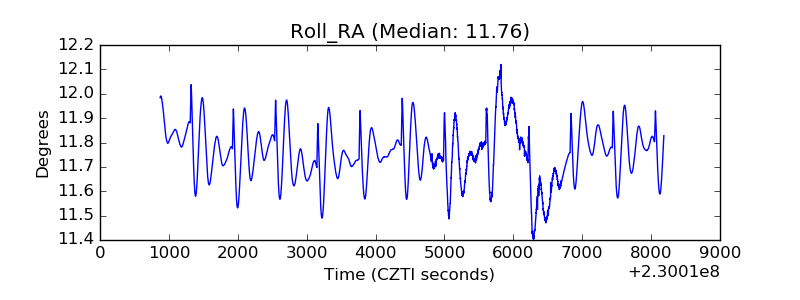 |
| Veto Counter | 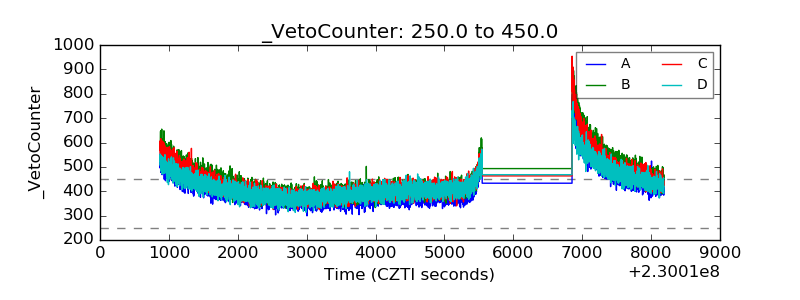 |