| Param | Original file | Final file |
|---|---|---|
| Filename | modeM0/AS1C02_037T02_9000001170cztM0_level2.fits | modeM0/AS1C02_037T02_9000001170cztM0_level2_quad_clean.evt |
| Size (bytes) | 144,362,880 | 158,901,120 |
| Size | 137.7 MB | 151.5 MB |
| Events in quadrant A | 892,200 | 1,000,360 |
| Events in quadrant B | 855,734 | 996,906 |
| Events in quadrant C | 866,664 | 940,201 |
| Events in quadrant D | 754,200 | 871,238 |
| Mode SS | |||
|---|---|---|---|
| Quadrant | BADHDUFLAG | Total packets | Discarded packets |
| A | 0 | 296 | 0 |
| B | 0 | 296 | 0 |
| C | 0 | 296 | 0 |
| D | 0 | 296 | 0 |
| Mode M0 | |||
|---|---|---|---|
| Quadrant | BADHDUFLAG | Total packets | Discarded packets |
| A | 0 | 30263 | 0 |
| B | 0 | 31577 | 0 |
| C | 0 | 29891 | 0 |
| D | 0 | 31643 | 0 |
| Mode M9 | |||
|---|---|---|---|
| Quadrant | BADHDUFLAG | Total packets | Discarded packets |
| A | 0 | 36 | 0 |
| B | 0 | 36 | 0 |
| C | 0 | 36 | 0 |
| D | 0 | 36 | 0 |
| Quadrant | Total seconds | Saturated seconds | Saturation percentage |
|---|---|---|---|
| A | 14540 | 180 | 1.237964% |
| B | 14540 | 226 | 1.554333% |
| C | 14540 | 93 | 0.639615% |
| D | 14540 | 191 | 1.313618% |
Noise dominated data is calculated using 1-second bins in cleaned event files. If a bin has >2000 counts, and if more than 50% of those come from <1% of pixels, then it is considered to be noise-dominated and hence unusable.
| Quadrant | # 1 sec bins | Bins with >0 counts | Bins with >2000 counts | High rate bins dominated by noise | Noise dominated (total time) | Noise dominated (detector-on time) | Marked lightcurve |
|---|---|---|---|---|---|---|---|
| A | 16954 | 14539 | 0 | 0 | 0.00% | 0.00% |  |
| B | 16954 | 14538 | 0 | 0 | 0.00% | 0.00% | 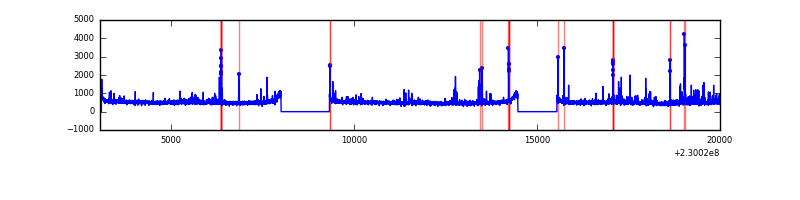 |
| C | 16955 | 14540 | 0 | 0 | 0.00% | 0.00% | 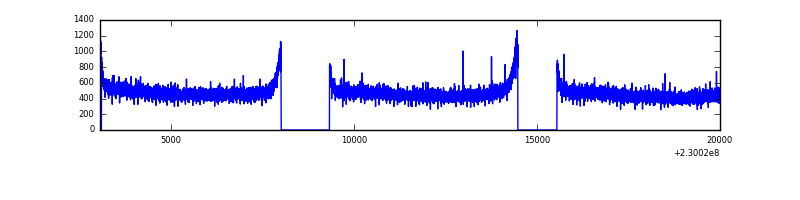 |
| D | 16954 | 14538 | 0 | 0 | 0.00% | 0.00% | 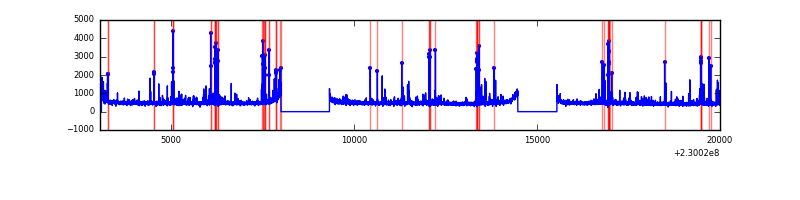 |
Top three noisy pixels from each quadrant. If the there are fewer than three noisy pixels in the level2.evt file, extra rows are filled as -1
| Pixel properties | Quadrant properties | ||||||
|---|---|---|---|---|---|---|---|
| Quadrant | DetID | PixID | Counts | Sigma | Mean | Median | Sigma |
| A | 0 | 29 | 782 | 9.67 | 232 | 218 | 58.4 |
| A | 7 | 110 | 776 | 9.56 | 232 | 218 | 58.4 |
| A | 9 | 19 | 667 | 7.69 | 232 | 218 | 58.4 |
| B | 2 | 9 | 740 | 11.11 | 226 | 216 | 47.2 |
| B | 3 | 17 | 612 | 8.4 | 226 | 216 | 47.2 |
| B | 5 | 128 | 573 | 7.57 | 226 | 216 | 47.2 |
| C | 1 | 81 | 665 | 7.38 | 228 | 213 | 61.3 |
| C | 1 | 80 | 606 | 6.41 | 228 | 213 | 61.3 |
| C | 12 | 241 | 592 | 6.18 | 228 | 213 | 61.3 |
| D | 10 | 189 | 549 | 6.1 | 214 | 196 | 57.8 |
| D | 6 | 83 | 536 | 5.88 | 214 | 196 | 57.8 |
| D | 6 | 231 | 534 | 5.84 | 214 | 196 | 57.8 |
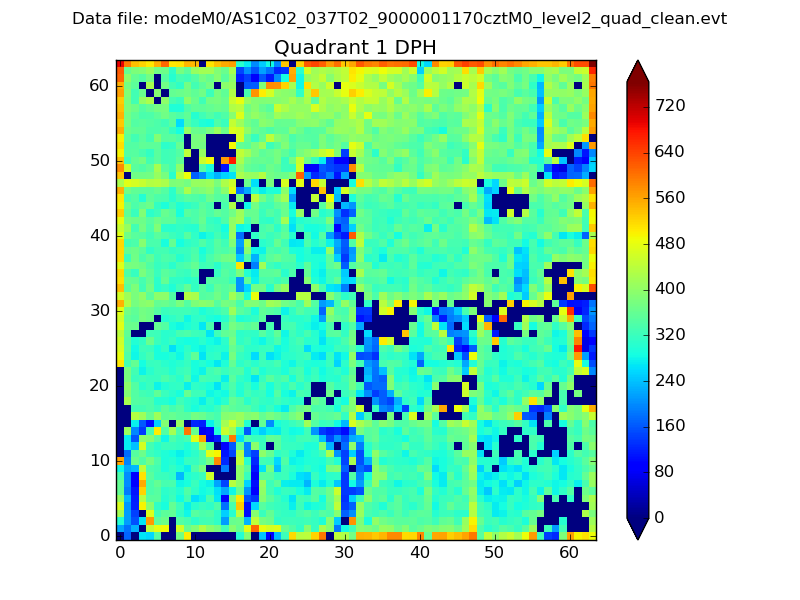
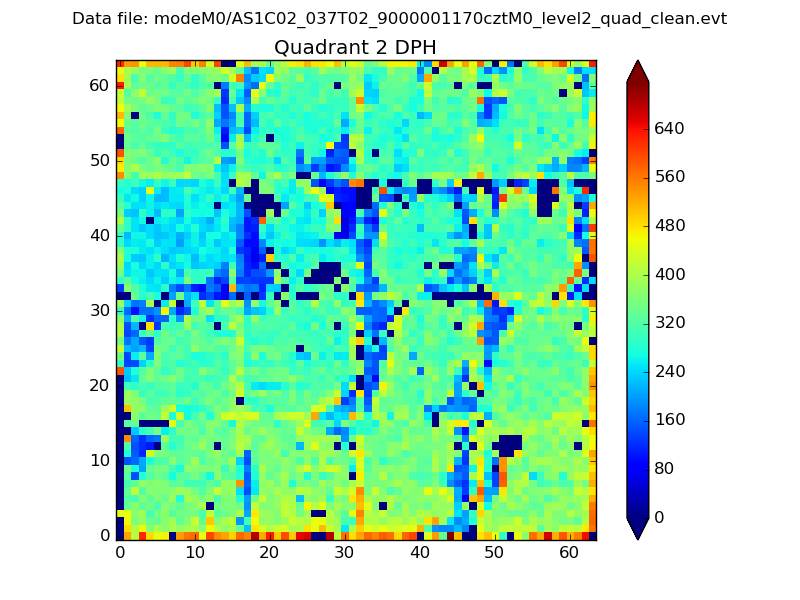
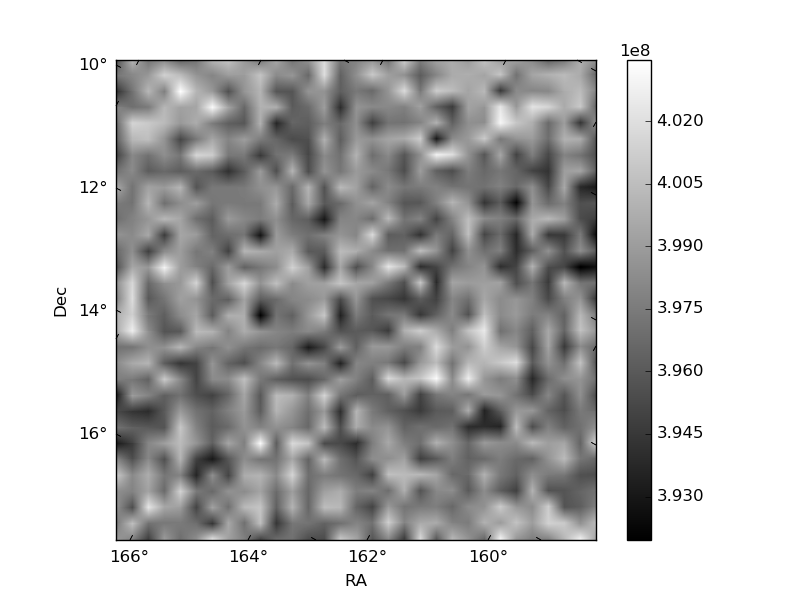
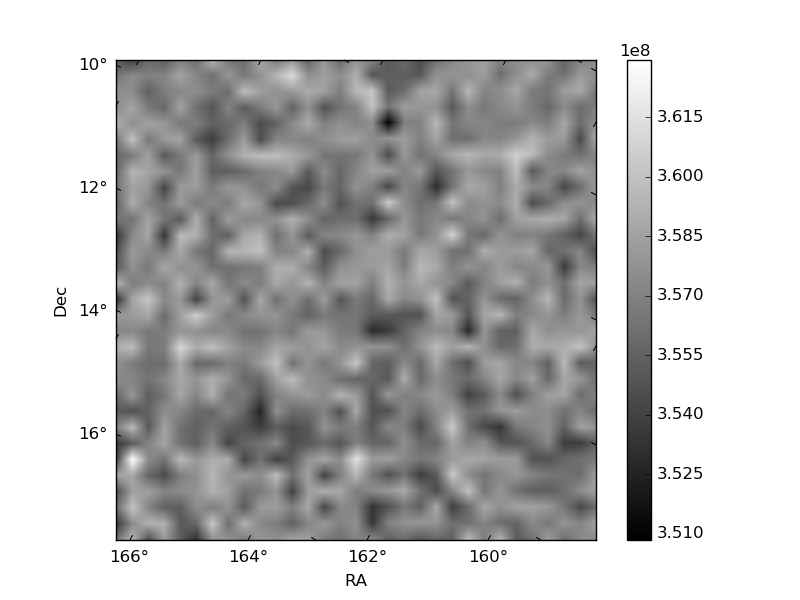
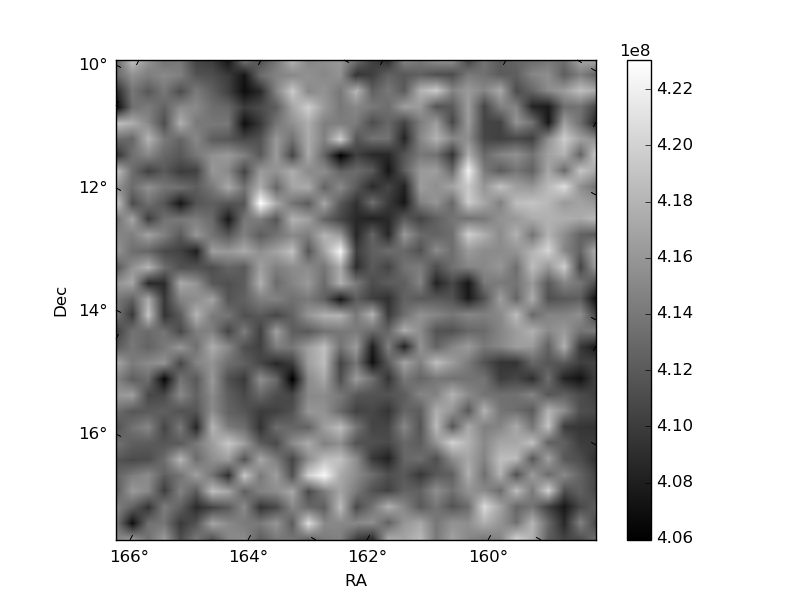
Histogram calculated using DETX and DETY for each event in the final _common_clean file
| Quadrant A | 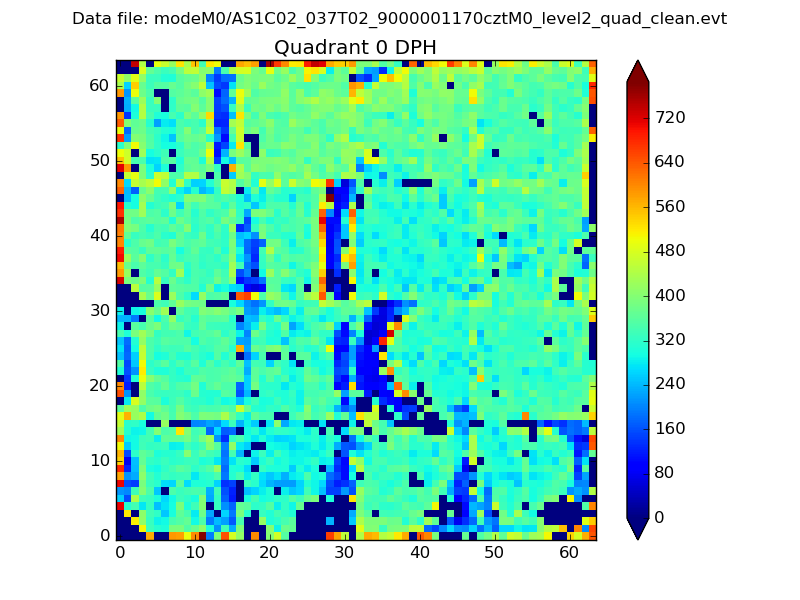 |
 |
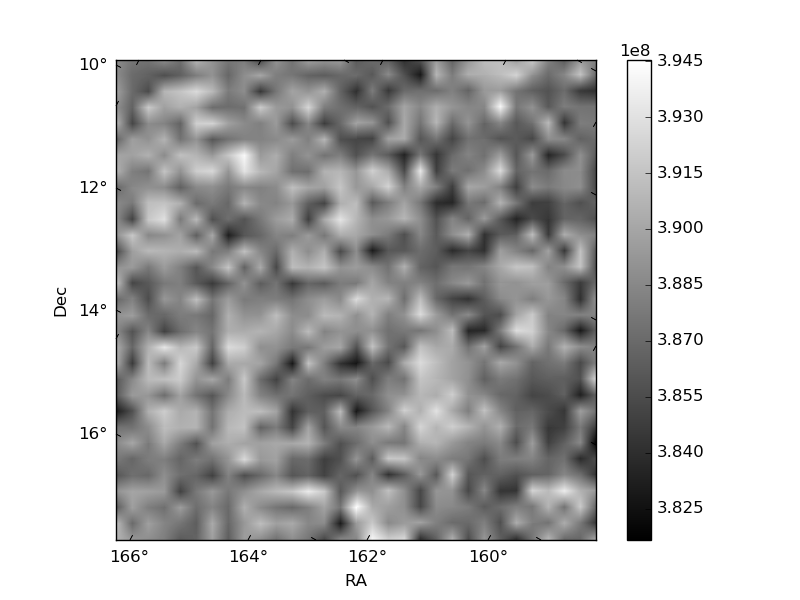
Quadrant B |
|---|---|---|---|
| Quadrant D | 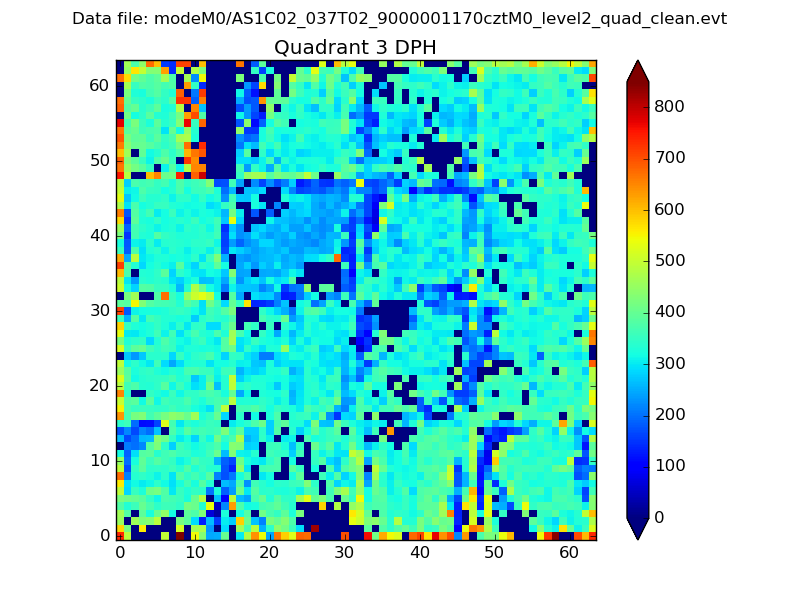 |
 |
Quadrant C |
| Plot type | Count rate plots | Images |
|---|---|---|
| Comparison with Poisson distribution Blue bars denote a histogram of data divided into 1 sec bins. Red curve is a Poisson curve with rate = median count rate of data. |
 |
 |
| Quadrant-wise count rates Data is divided into 100 sec bins |
 |
|
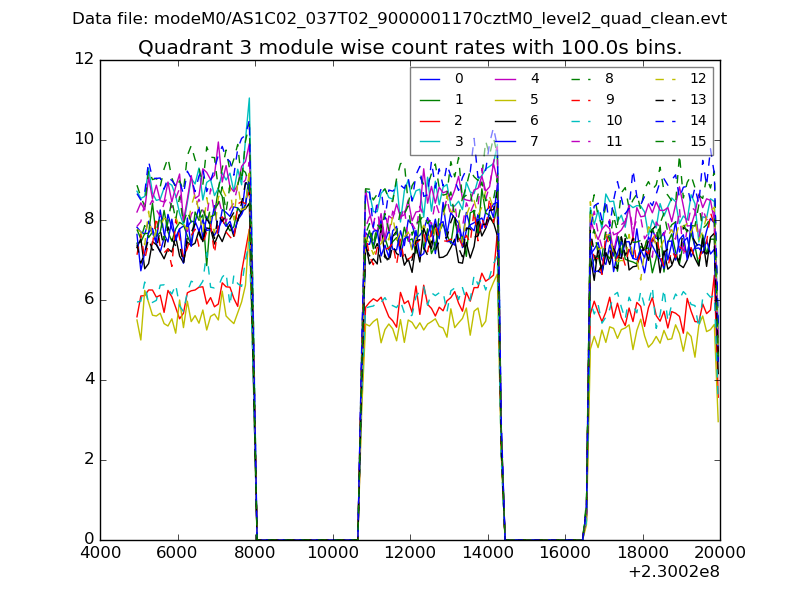
| Module-wise count rates for Quadrant A Data is divided into 100 sec bins |
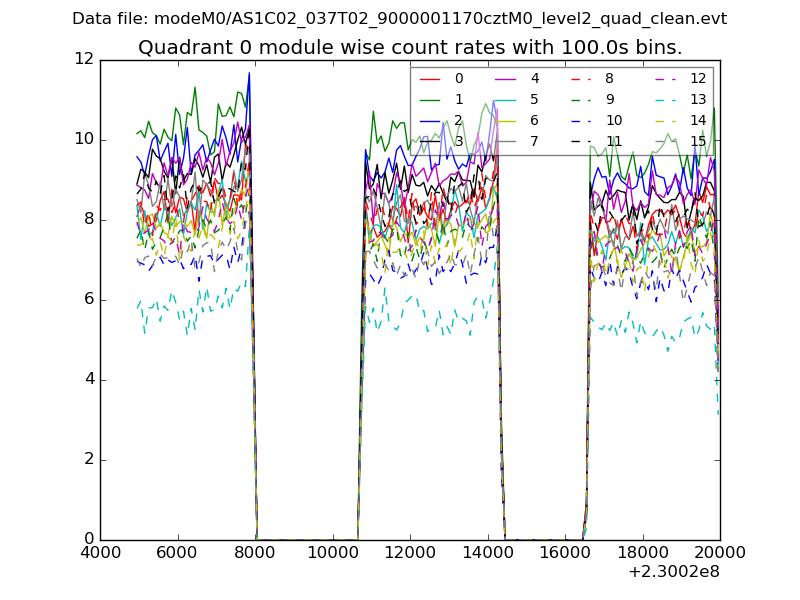 |
 |
| Module-wise count rates for Quadrant B Data is divided into 100 sec bins |
 |
 |
| Module-wise count rates for Quadrant C Data is divided into 100 sec bins |
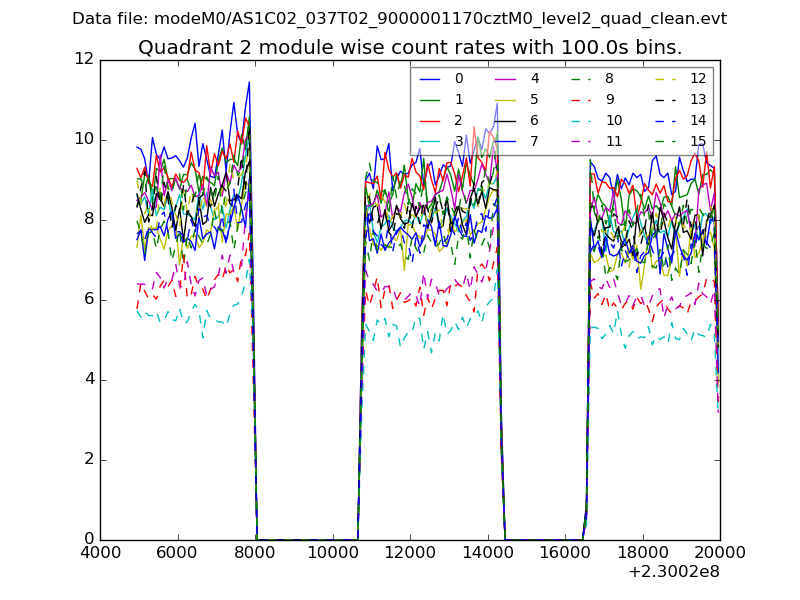 |
 |
| Module-wise count rates for Quadrant D Data is divided into 100 sec bins |
 |
 |
| Parameter | Plot |
|---|---|
| CZT HV Monitor | 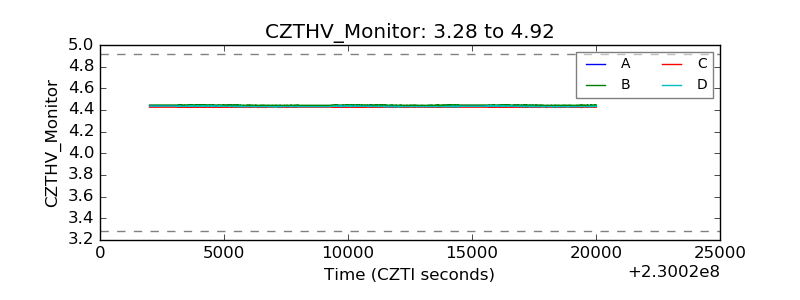 |
| D_VDD | 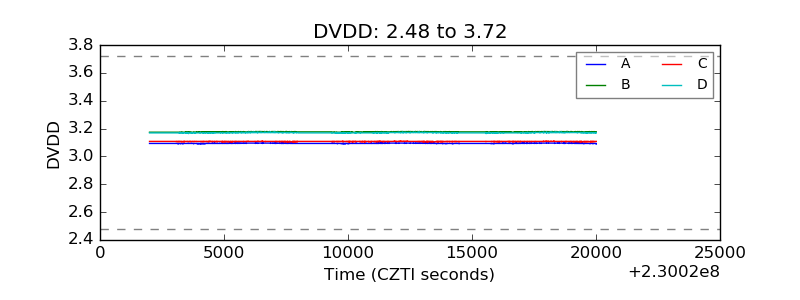 |
| Temperature 1 | 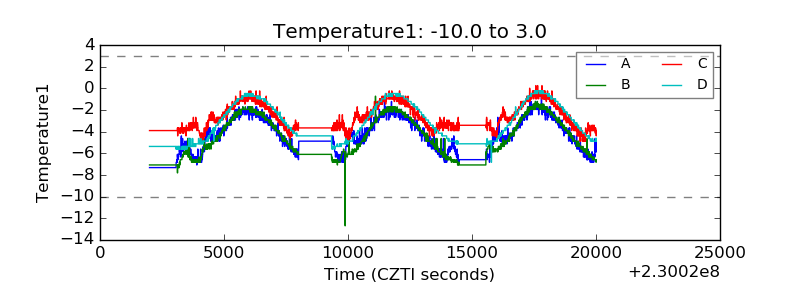 |
| Veto HV Monitor |  |
| Veto LLD | 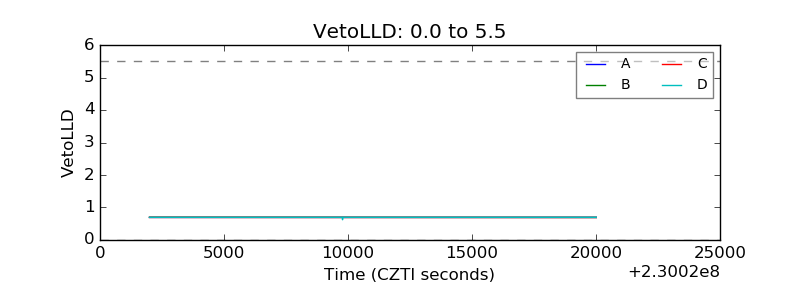 |
| Alpha Counter | 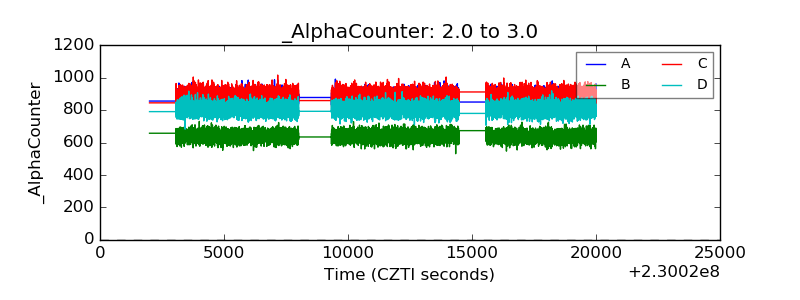 |
| _CPM_Rate |  |
| CZT Counter | 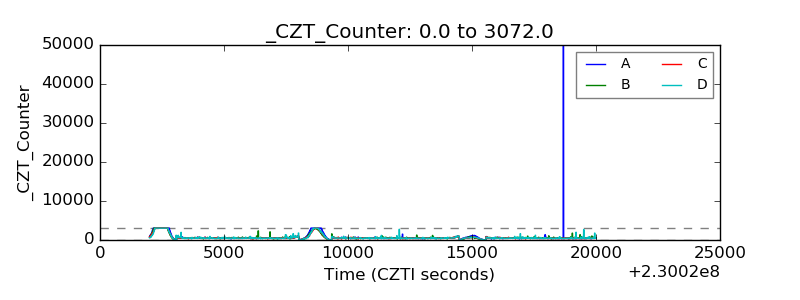 |
| +2.5 Volts monitor | 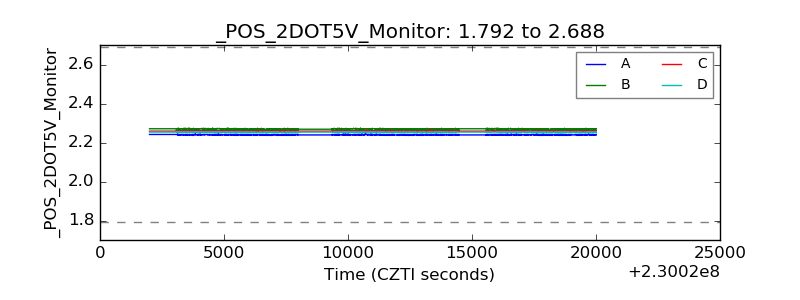 |
| +5 Volts monitor |  |
| _ROLL_ROT | 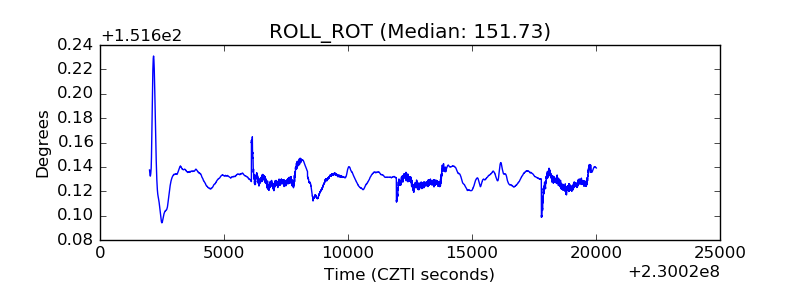 |
| _Roll_DEC | 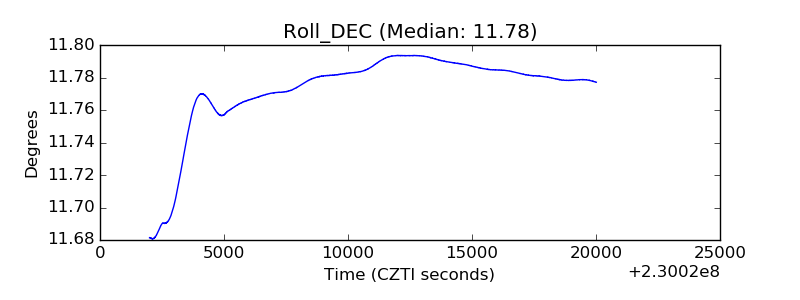 |
| _Roll_RA | 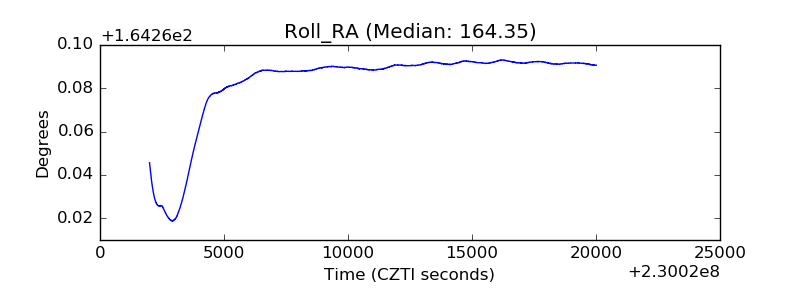 |
| Veto Counter |  |