| Param | Original file | Final file |
|---|---|---|
| Filename | modeM0/AS1C02_037T02_9000001170_08381cztM0_level2.evt | modeM0/AS1C02_037T02_9000001170_08381cztM0_level2_quad_clean.evt |
| Size (bytes) | 439,352,640 | 67,440,960 |
| Size | 419.0 MB | 64.3 MB |
| Events in quadrant A | 3,174,904 | 409,597 |
| Events in quadrant B | 3,354,221 | 412,964 |
| Events in quadrant C | 3,044,814 | 400,355 |
| Events in quadrant D | 3,309,698 | 385,349 |
| Mode SS | |||
|---|---|---|---|
| Quadrant | BADHDUFLAG | Total packets | Discarded packets |
| A | 0 | 128 | 0 |
| B | 0 | 128 | 0 |
| C | 0 | 128 | 0 |
| D | 0 | 128 | 0 |
| Mode M0 | |||
|---|---|---|---|
| Quadrant | BADHDUFLAG | Total packets | Discarded packets |
| A | 0 | 13041 | 3 |
| B | 0 | 13592 | 2 |
| C | 0 | 12861 | 2 |
| D | 0 | 13782 | 2 |
| Mode M9 | |||
|---|---|---|---|
| Quadrant | BADHDUFLAG | Total packets | Discarded packets |
| A | 0 | 20 | 0 |
| B | 0 | 20 | 0 |
| C | 0 | 20 | 0 |
| D | 0 | 21 | 0 |
| Quadrant | Total seconds | Saturated seconds | Saturation percentage |
|---|---|---|---|
| A | 6214 | 69 | 1.110396% |
| B | 6214 | 103 | 1.657547% |
| C | 6214 | 30 | 0.482781% |
| D | 6214 | 82 | 1.319601% |
Noise dominated data is calculated using 1-second bins in cleaned event files. If a bin has >2000 counts, and if more than 50% of those come from <1% of pixels, then it is considered to be noise-dominated and hence unusable.
| Quadrant | # 1 sec bins | Bins with >0 counts | Bins with >2000 counts | High rate bins dominated by noise | Noise dominated (total time) | Noise dominated (detector-on time) | Marked lightcurve |
|---|---|---|---|---|---|---|---|
| A | 7559 | 6216 | 0 | 0 | 0.00% | 0.00% | 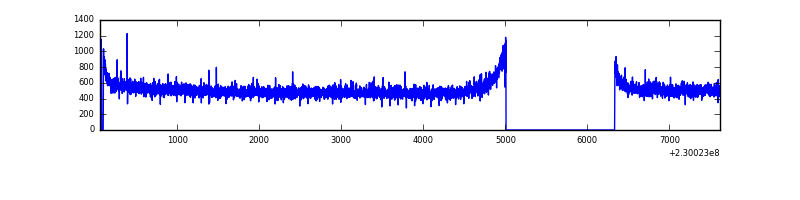 |
| B | 7559 | 6216 | 9 | 9 | 0.12% | 0.14% | 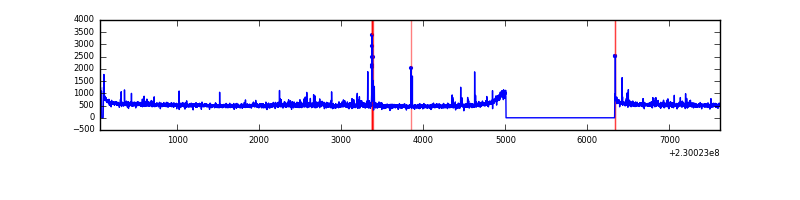 |
| C | 7559 | 6216 | 0 | 0 | 0.00% | 0.00% | 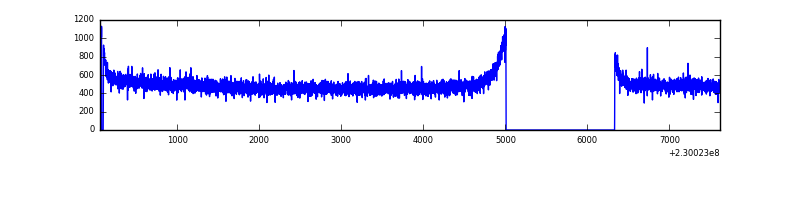 |
| D | 7559 | 6216 | 32 | 32 | 0.42% | 0.51% | 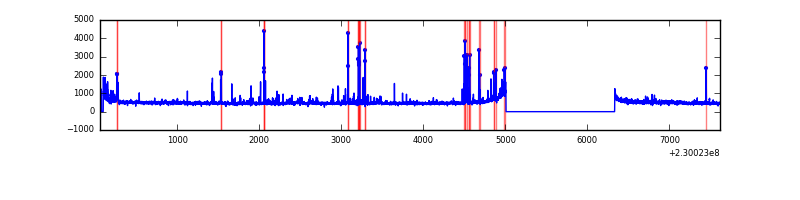 |
Top three noisy pixels from each quadrant. If the there are fewer than three noisy pixels in the level2.evt file, extra rows are filled as -1
| Pixel properties | Quadrant properties | ||||||
|---|---|---|---|---|---|---|---|
| Quadrant | DetID | PixID | Counts | Sigma | Mean | Median | Sigma |
| A | 1 | 162 | 11257 | 63.13 | 817 | 801 | 165.6 |
| A | 0 | 226 | 7835 | 42.47 | 817 | 801 | 165.6 |
| A | 12 | 194 | 7352 | 39.55 | 817 | 801 | 165.6 |
| B | 0 | 214 | 98088 | 629.57 | 818 | 802 | 154.5 |
| B | 4 | 81 | 33350 | 210.63 | 818 | 802 | 154.5 |
| B | 12 | 111 | 15807 | 97.1 | 818 | 802 | 154.5 |
| C | 13 | 61 | 5970 | 28.45 | 781 | 788 | 182.2 |
| C | 3 | 202 | 1964 | 6.46 | 781 | 788 | 182.2 |
| C | -1 | -1 | -1 | -1.0 | 781 | 788 | 182.2 |
| D | 12 | 233 | 97530 | 507.24 | 779 | 756 | 190.8 |
| D | 14 | 34 | 77337 | 401.4 | 779 | 756 | 190.8 |
| D | 2 | 14 | 67773 | 351.27 | 779 | 756 | 190.8 |
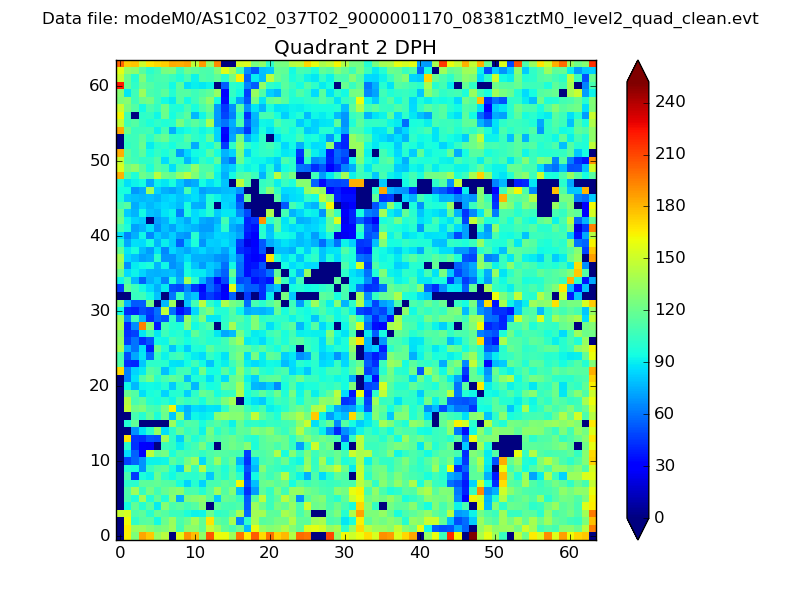
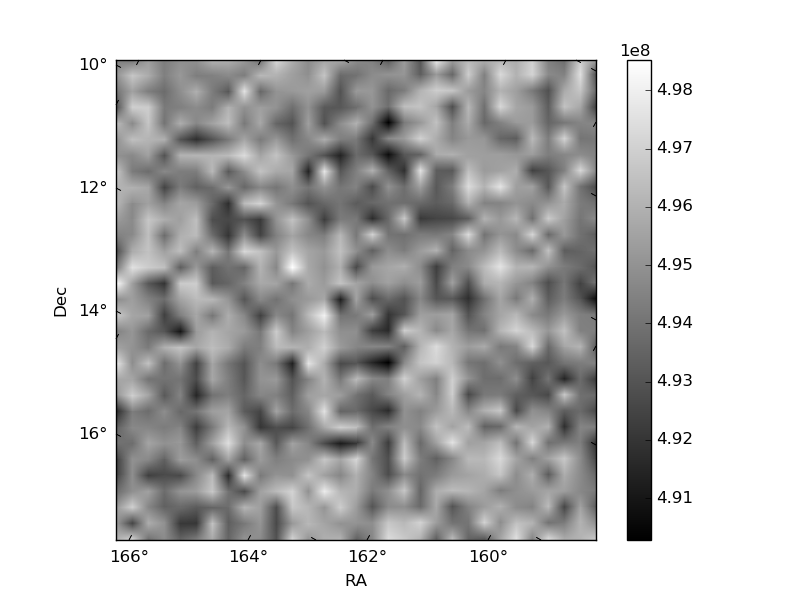
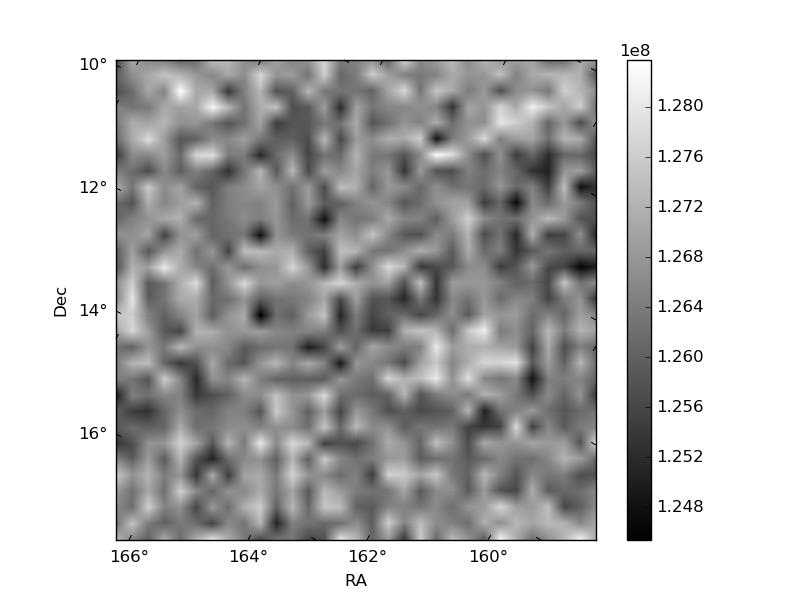
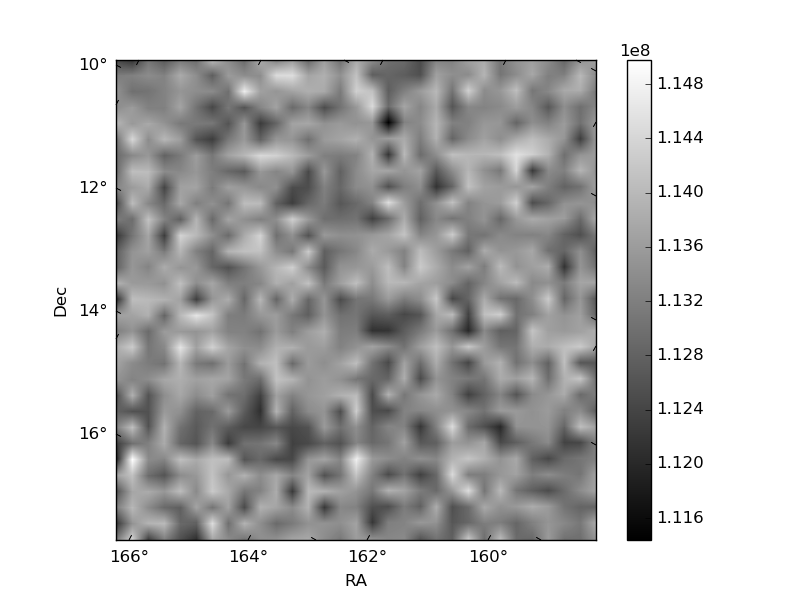
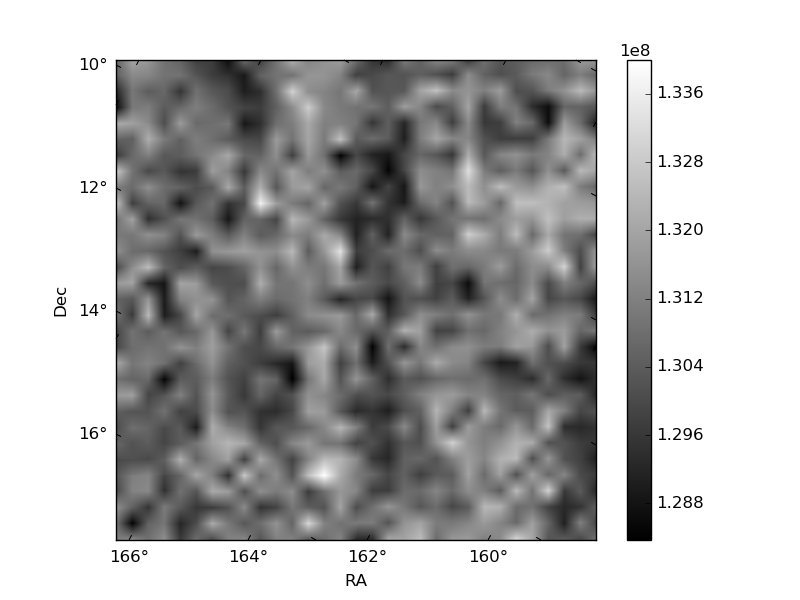
Histogram calculated using DETX and DETY for each event in the final _common_clean file
| Quadrant A | 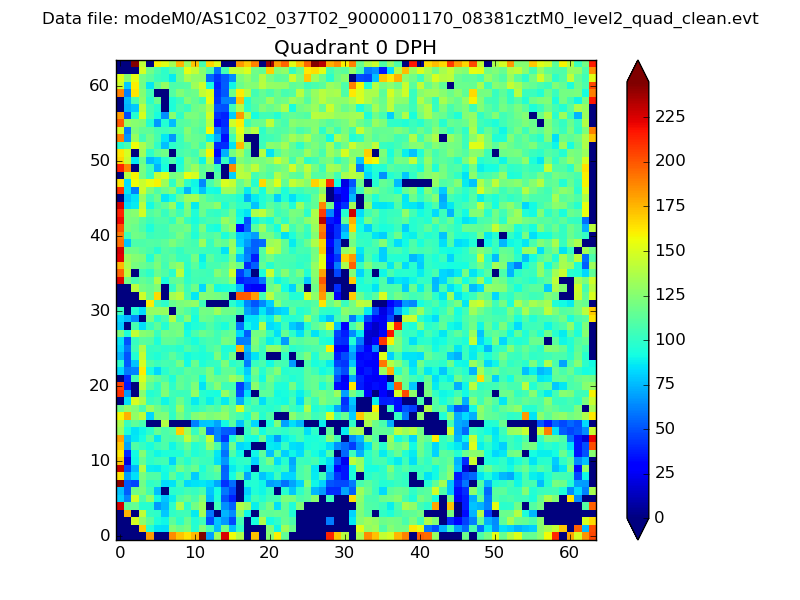 |
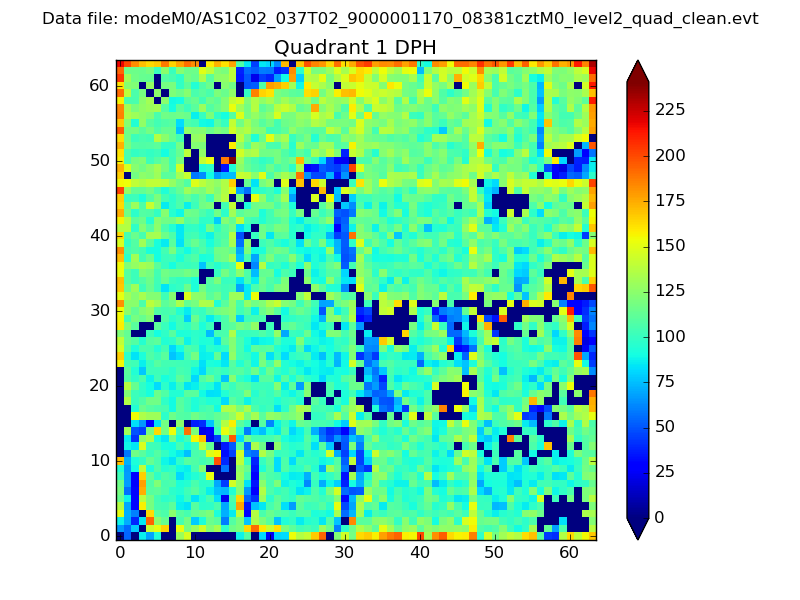 |
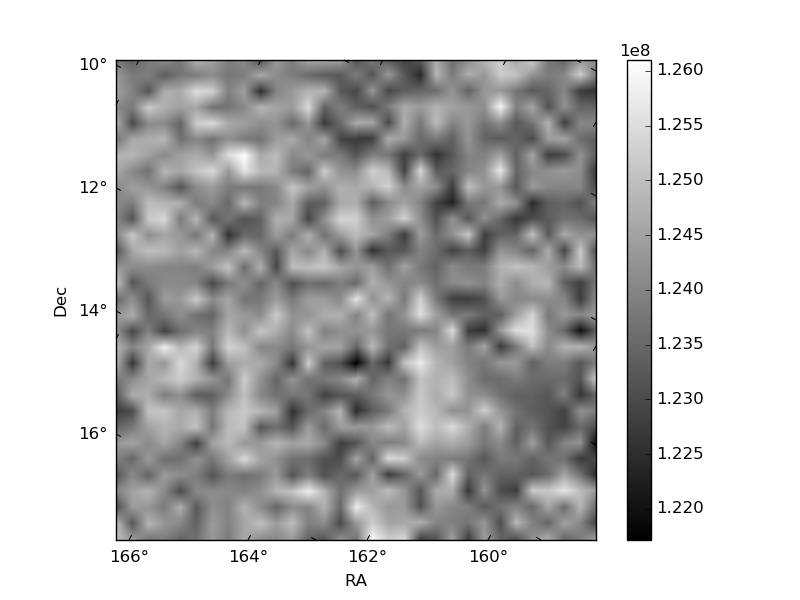
Quadrant B |
|---|---|---|---|
| Quadrant D | 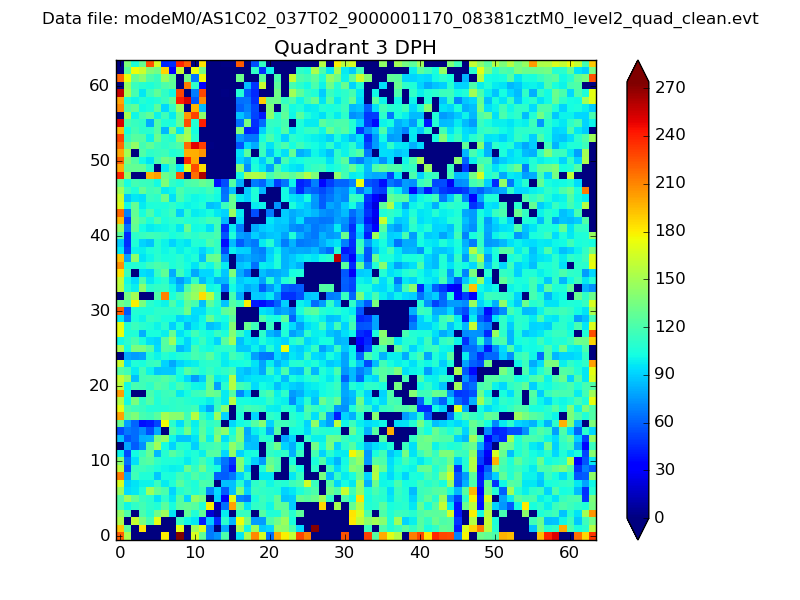 |
 |
Quadrant C |
| Plot type | Count rate plots | Images |
|---|---|---|
| Comparison with Poisson distribution Blue bars denote a histogram of data divided into 1 sec bins. Red curve is a Poisson curve with rate = median count rate of data. |
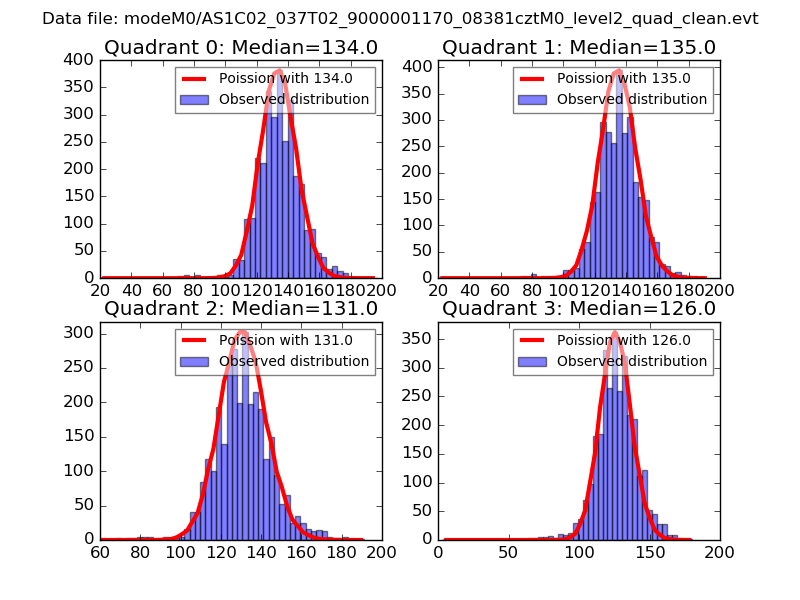 |
 |
| Quadrant-wise count rates Data is divided into 100 sec bins |
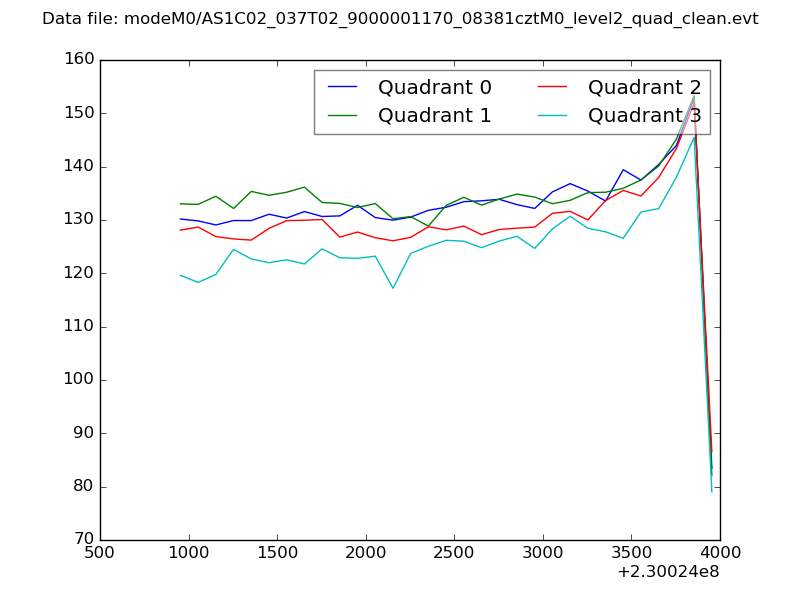 |
|
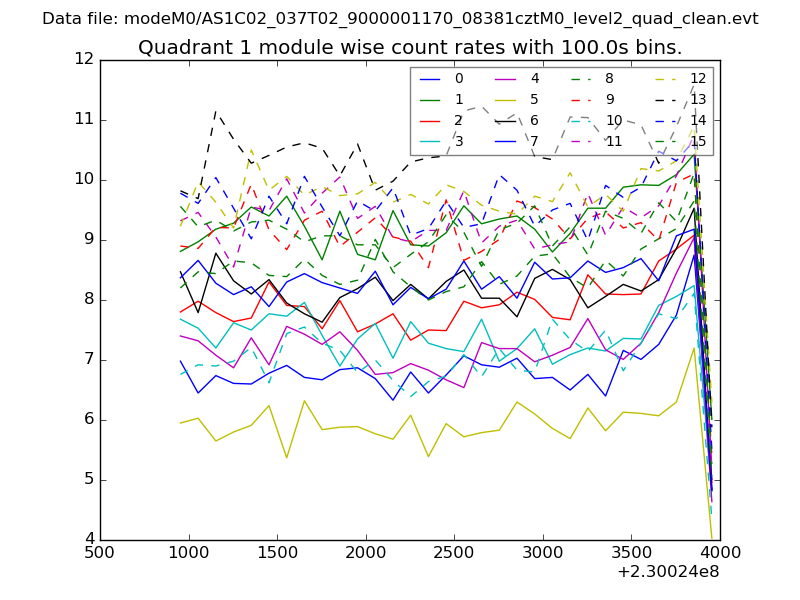
| Module-wise count rates for Quadrant A Data is divided into 100 sec bins |
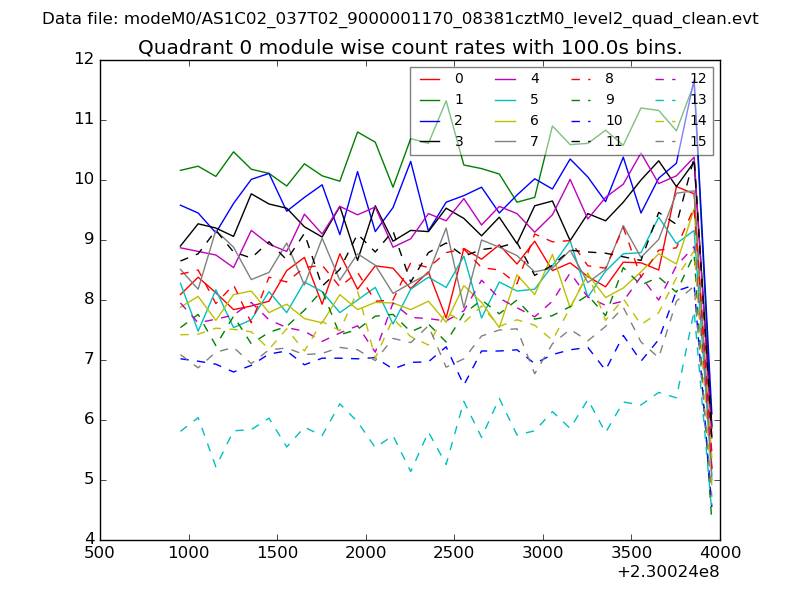 |
 |
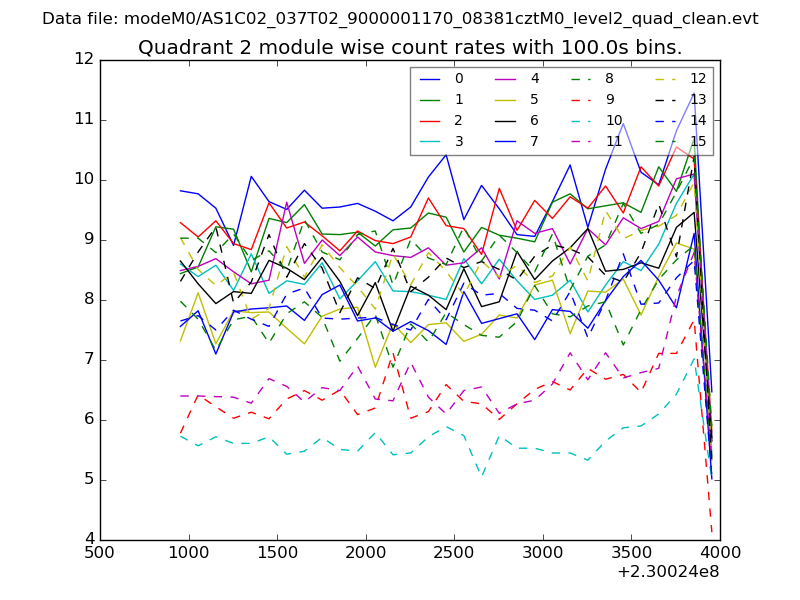
| Module-wise count rates for Quadrant B Data is divided into 100 sec bins |
 |
 |
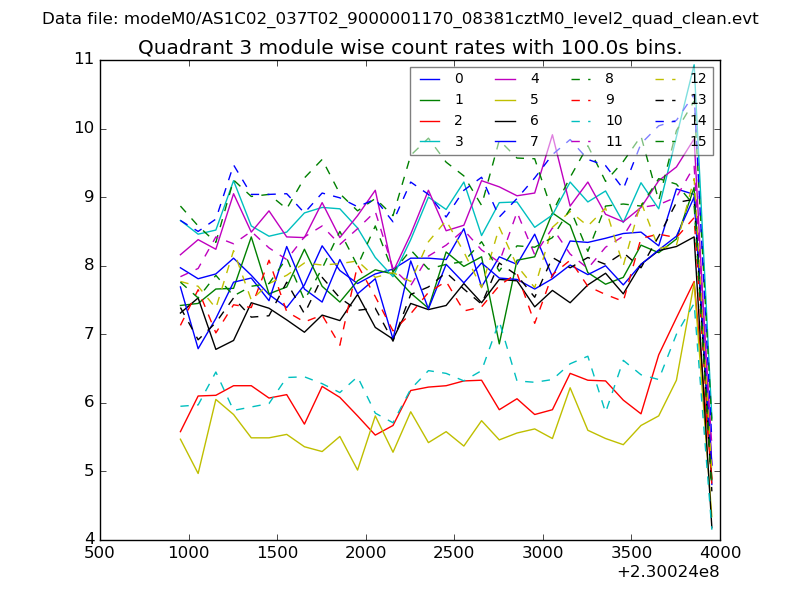
| Module-wise count rates for Quadrant C Data is divided into 100 sec bins |
 |
 |
| Module-wise count rates for Quadrant D Data is divided into 100 sec bins |
 |
 |
| Parameter | Plot |
|---|---|
| CZT HV Monitor | 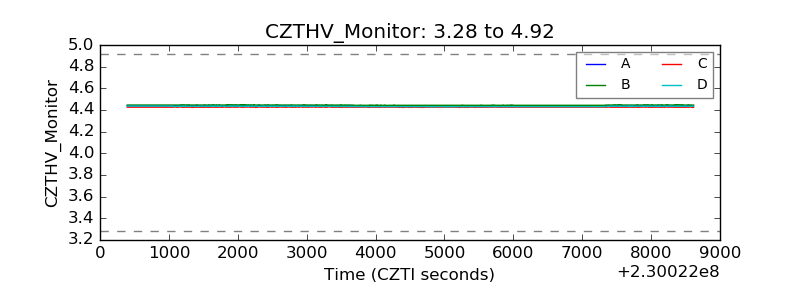 |
| D_VDD |  |
| Temperature 1 | 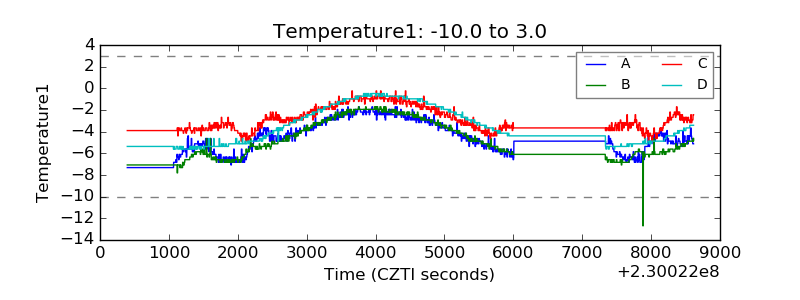 |
| Veto HV Monitor | 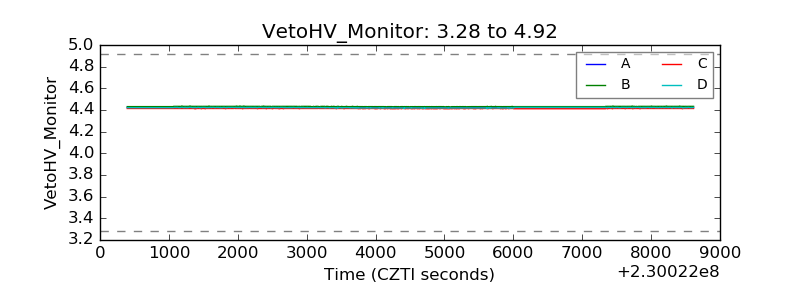 |
| Veto LLD | 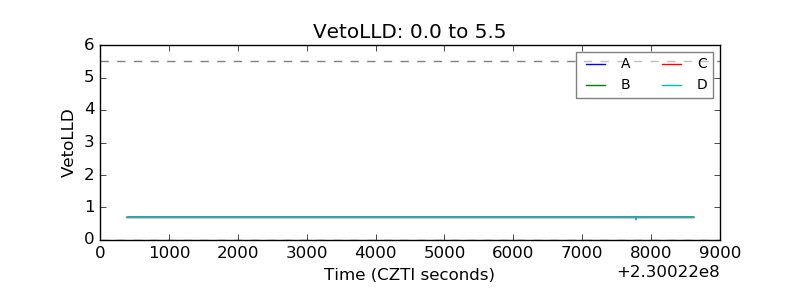 |
| Alpha Counter | 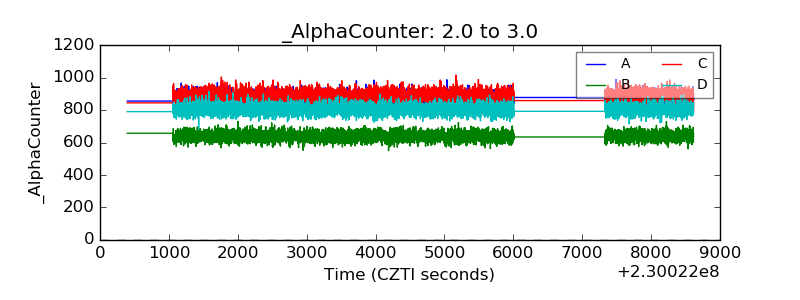 |
| _CPM_Rate | 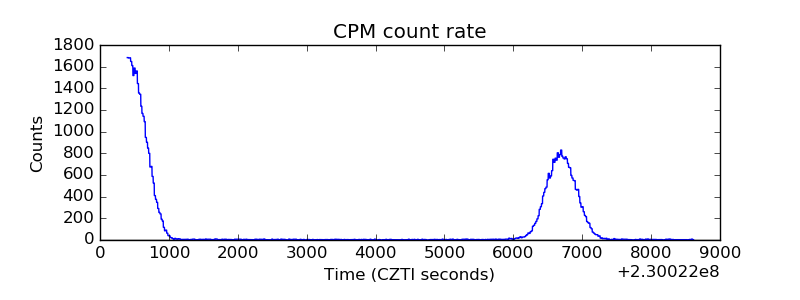 |
| CZT Counter | 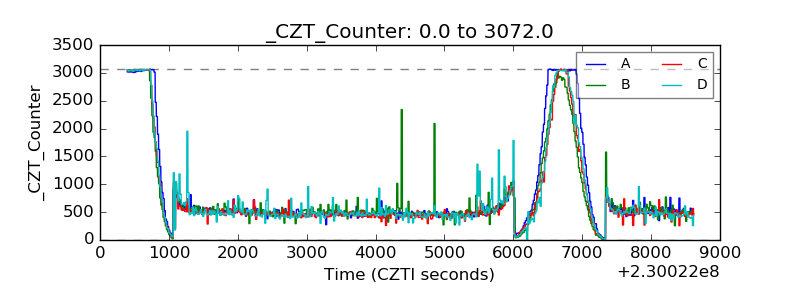 |
| +2.5 Volts monitor | 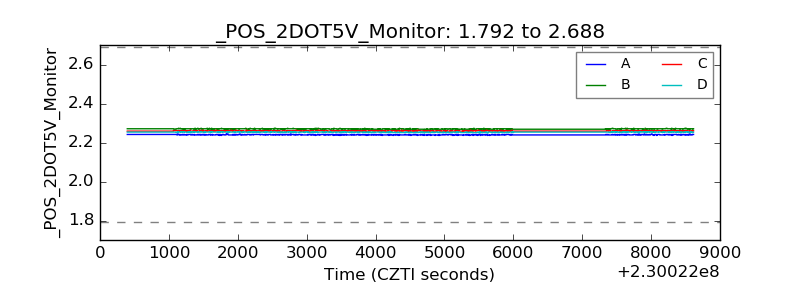 |
| +5 Volts monitor |  |
| _ROLL_ROT | 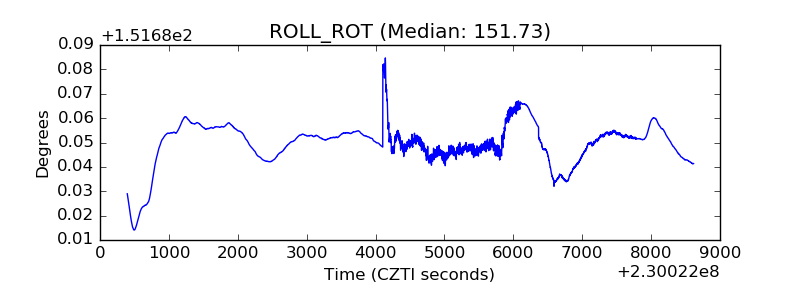 |
| _Roll_DEC | 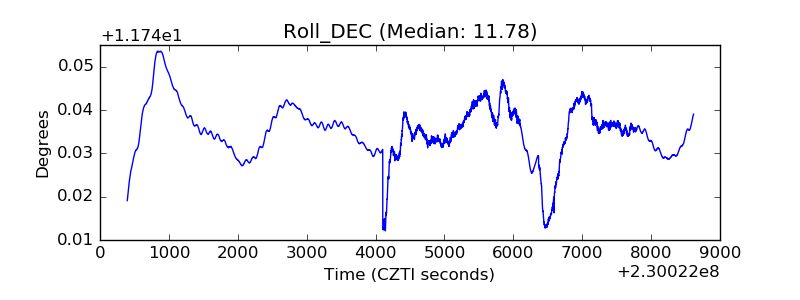 |
| _Roll_RA | 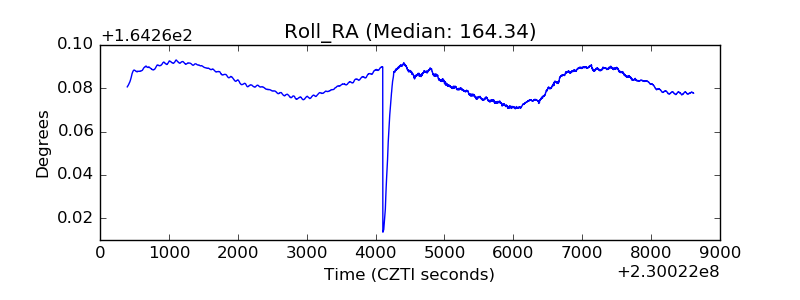 |
| Veto Counter | 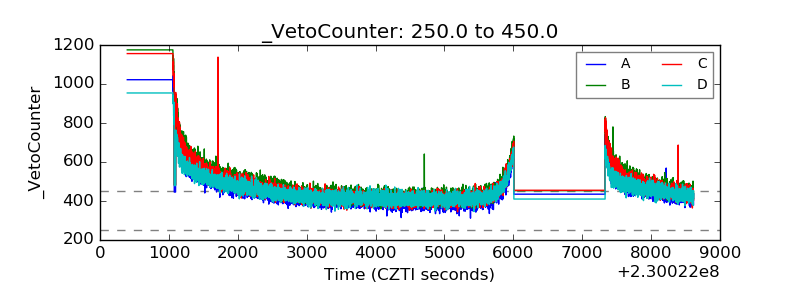 |