| Param | Original file | Final file |
|---|---|---|
| Filename | modeM0/AS1C02_037T02_9000001170_08382cztM0_level2.evt | modeM0/AS1C02_037T02_9000001170_08382cztM0_level2_quad_clean.evt |
| Size (bytes) | 495,927,360 | 91,869,120 |
| Size | 473.0 MB | 87.6 MB |
| Events in quadrant A | 3,589,083 | 582,589 |
| Events in quadrant B | 3,773,311 | 586,173 |
| Events in quadrant C | 3,460,118 | 570,182 |
| Events in quadrant D | 3,715,241 | 549,533 |
| Mode SS | |||
|---|---|---|---|
| Quadrant | BADHDUFLAG | Total packets | Discarded packets |
| A | 0 | 144 | 0 |
| B | 0 | 144 | 0 |
| C | 0 | 144 | 0 |
| D | 0 | 144 | 0 |
| Mode M0 | |||
|---|---|---|---|
| Quadrant | BADHDUFLAG | Total packets | Discarded packets |
| A | 0 | 15008 | 3 |
| B | 0 | 15484 | 2 |
| C | 0 | 14856 | 2 |
| D | 0 | 15682 | 2 |
| Mode M9 | |||
|---|---|---|---|
| Quadrant | BADHDUFLAG | Total packets | Discarded packets |
| A | 0 | 24 | 0 |
| B | 0 | 24 | 0 |
| C | 0 | 24 | 0 |
| D | 0 | 24 | 0 |
| Quadrant | Total seconds | Saturated seconds | Saturation percentage |
|---|---|---|---|
| A | 7094 | 144 | 2.029884% |
| B | 7094 | 172 | 2.424584% |
| C | 7094 | 75 | 1.057231% |
| D | 7094 | 126 | 1.776149% |
Noise dominated data is calculated using 1-second bins in cleaned event files. If a bin has >2000 counts, and if more than 50% of those come from <1% of pixels, then it is considered to be noise-dominated and hence unusable.
| Quadrant | # 1 sec bins | Bins with >0 counts | Bins with >2000 counts | High rate bins dominated by noise | Noise dominated (total time) | Noise dominated (detector-on time) | Marked lightcurve |
|---|---|---|---|---|---|---|---|
| A | 9489 | 7096 | 0 | 0 | 0.00% | 0.00% | 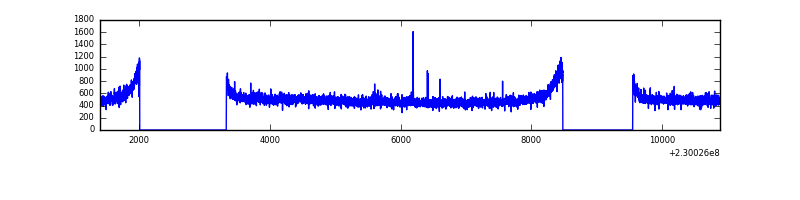 |
| B | 9489 | 7095 | 11 | 11 | 0.12% | 0.16% | 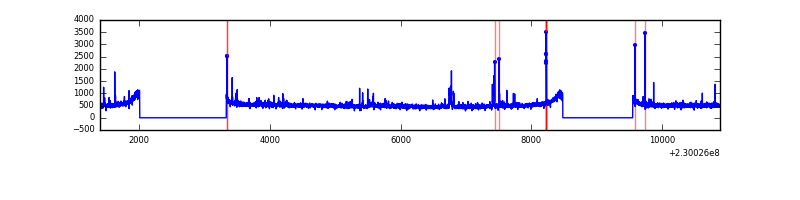 |
| C | 9489 | 7096 | 0 | 0 | 0.00% | 0.00% | 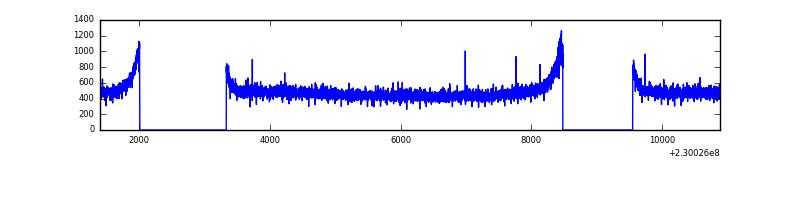 |
| D | 9489 | 7096 | 32 | 32 | 0.34% | 0.45% | 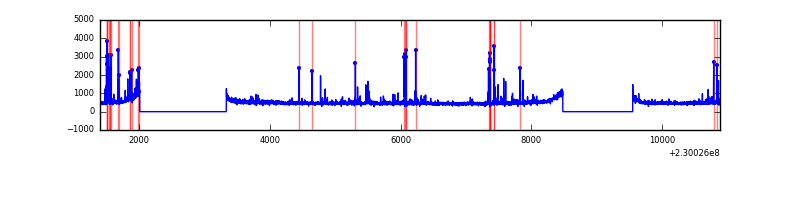 |
Top three noisy pixels from each quadrant. If the there are fewer than three noisy pixels in the level2.evt file, extra rows are filled as -1
| Pixel properties | Quadrant properties | ||||||
|---|---|---|---|---|---|---|---|
| Quadrant | DetID | PixID | Counts | Sigma | Mean | Median | Sigma |
| A | 0 | 226 | 8821 | 41.52 | 925 | 904 | 190.7 |
| A | 12 | 194 | 8108 | 37.78 | 925 | 904 | 190.7 |
| A | 1 | 162 | 6925 | 31.58 | 925 | 904 | 190.7 |
| B | 10 | 16 | 74296 | 413.44 | 924 | 902 | 177.5 |
| B | 0 | 214 | 35205 | 193.23 | 924 | 902 | 177.5 |
| B | 4 | 81 | 28556 | 155.78 | 924 | 902 | 177.5 |
| C | 13 | 61 | 6840 | 28.65 | 887 | 892 | 207.6 |
| C | 3 | 202 | 2241 | 6.5 | 887 | 892 | 207.6 |
| C | 1 | 16 | 2125 | 5.94 | 887 | 892 | 207.6 |
| D | 14 | 34 | 116938 | 530.97 | 888 | 863 | 218.6 |
| D | 7 | 71 | 70530 | 318.68 | 888 | 863 | 218.6 |
| D | 2 | 14 | 49177 | 221.01 | 888 | 863 | 218.6 |
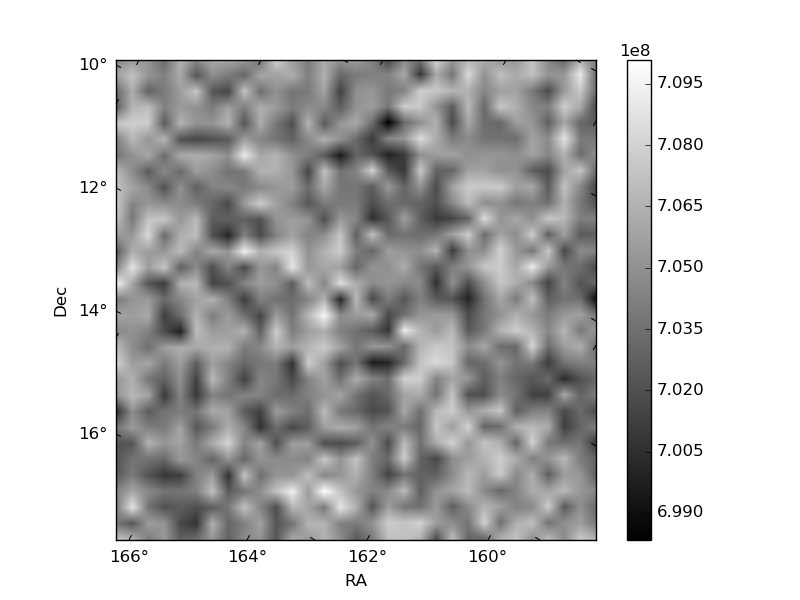
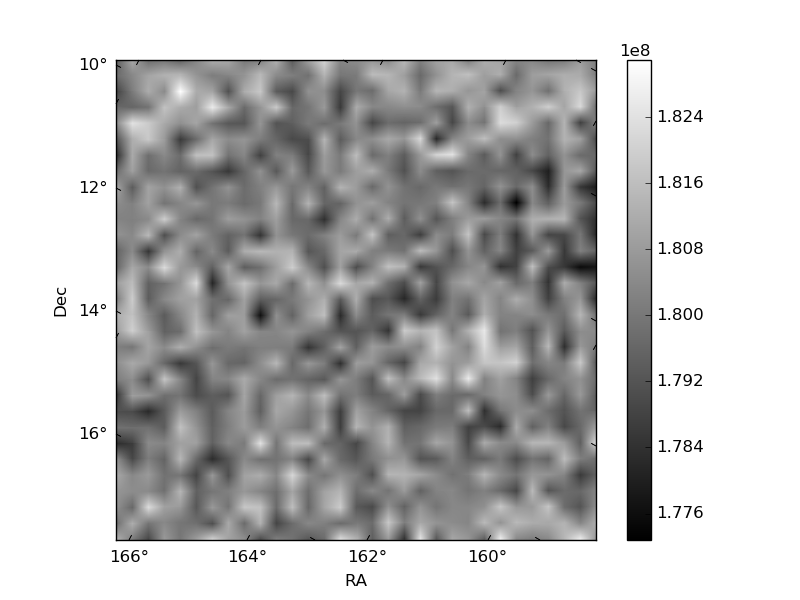
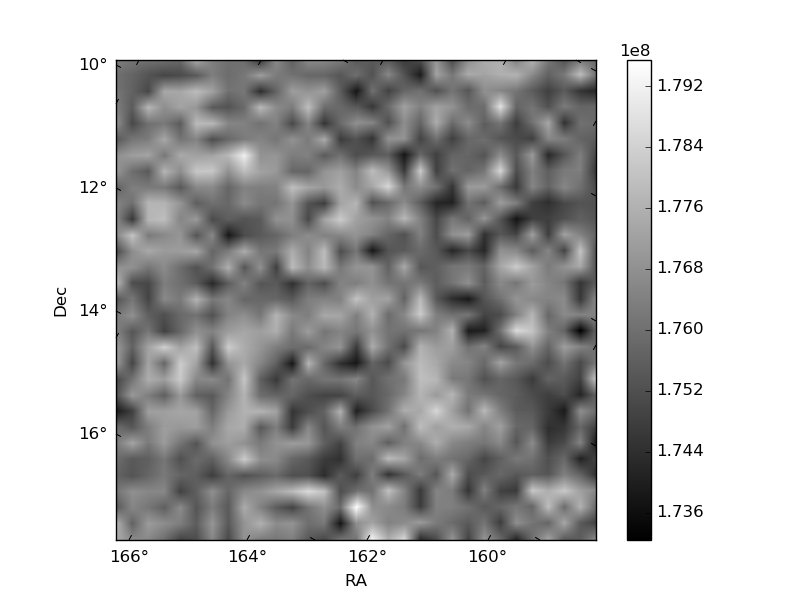
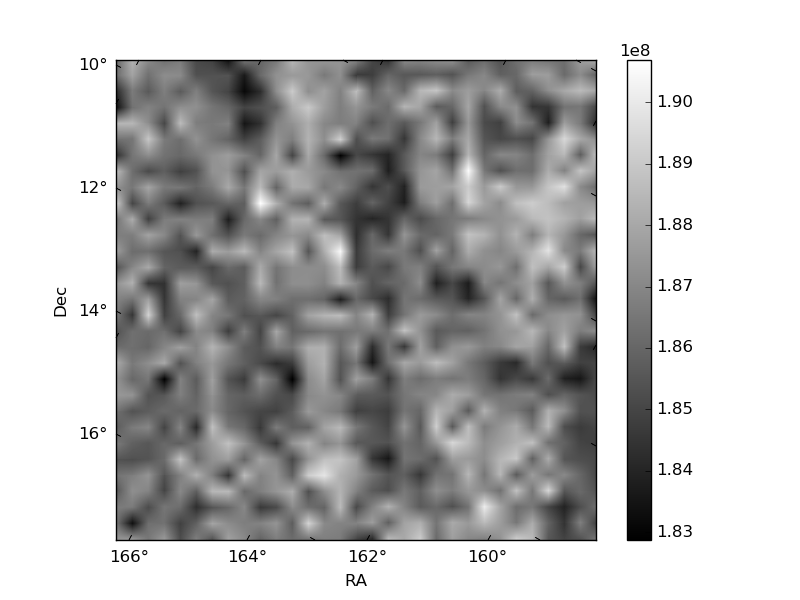
Histogram calculated using DETX and DETY for each event in the final _common_clean file
| Quadrant A | 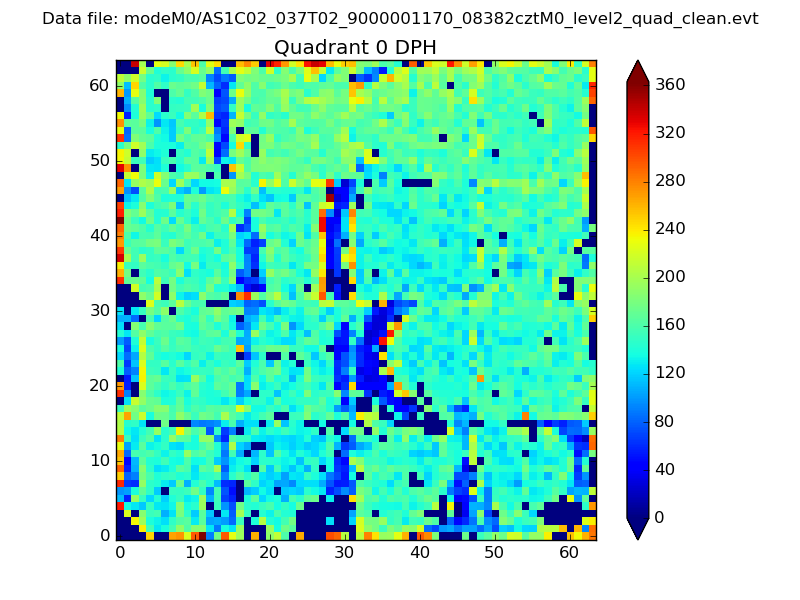 |
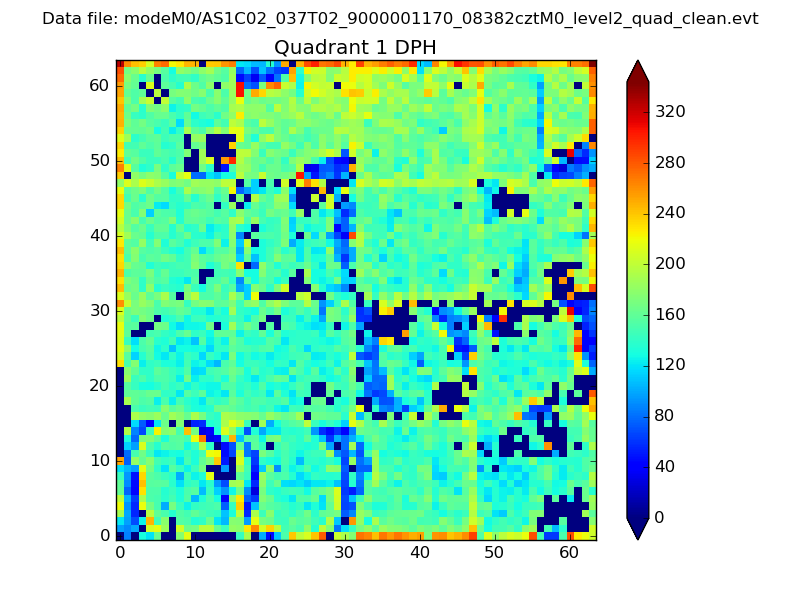 |
Quadrant B |
|---|---|---|---|
| Quadrant D | 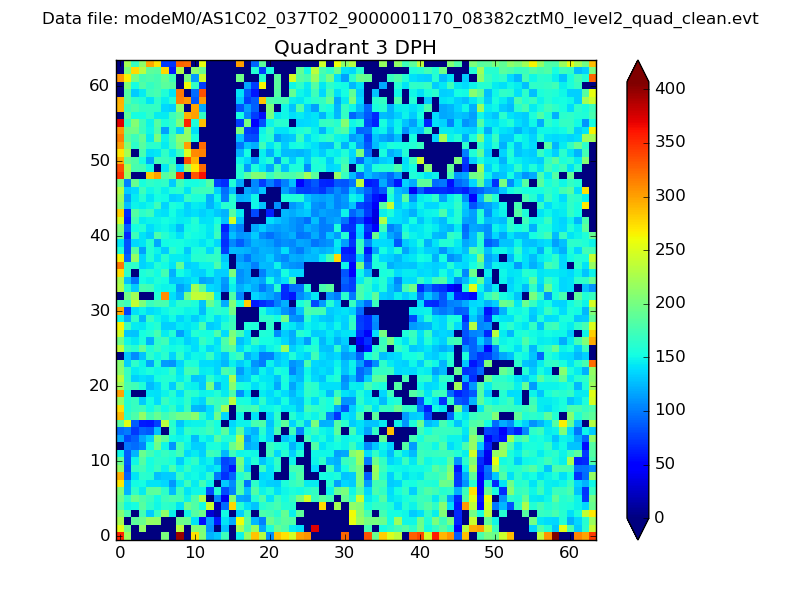 |
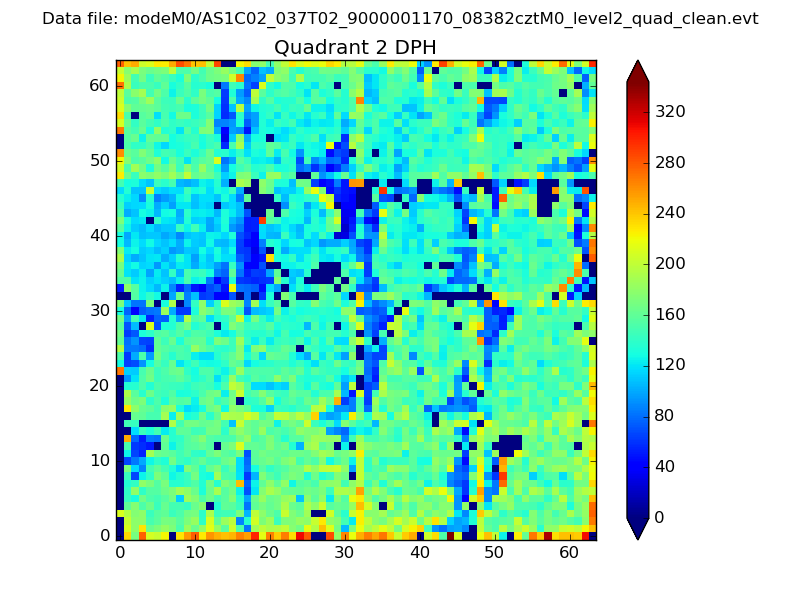 |
Quadrant C |
| Plot type | Count rate plots | Images |
|---|---|---|
| Comparison with Poisson distribution Blue bars denote a histogram of data divided into 1 sec bins. Red curve is a Poisson curve with rate = median count rate of data. |
 |
 |
| Quadrant-wise count rates Data is divided into 100 sec bins |
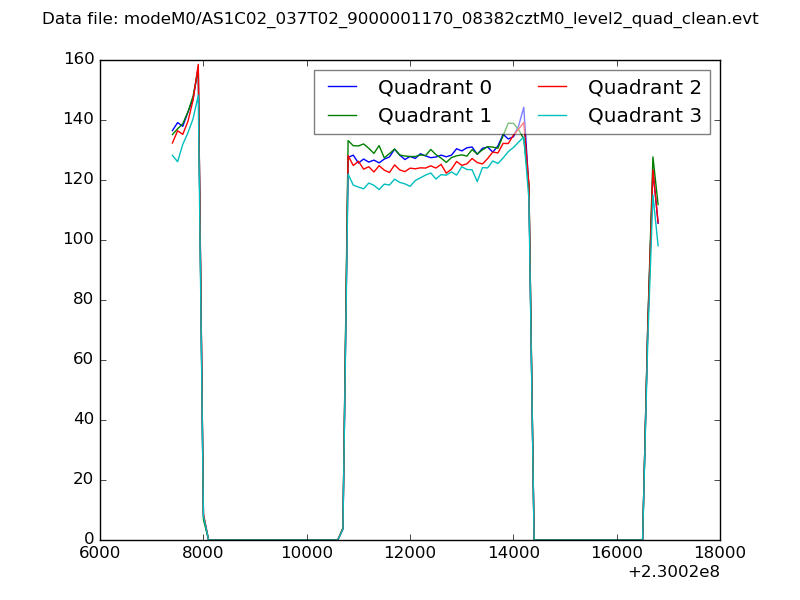 |
|
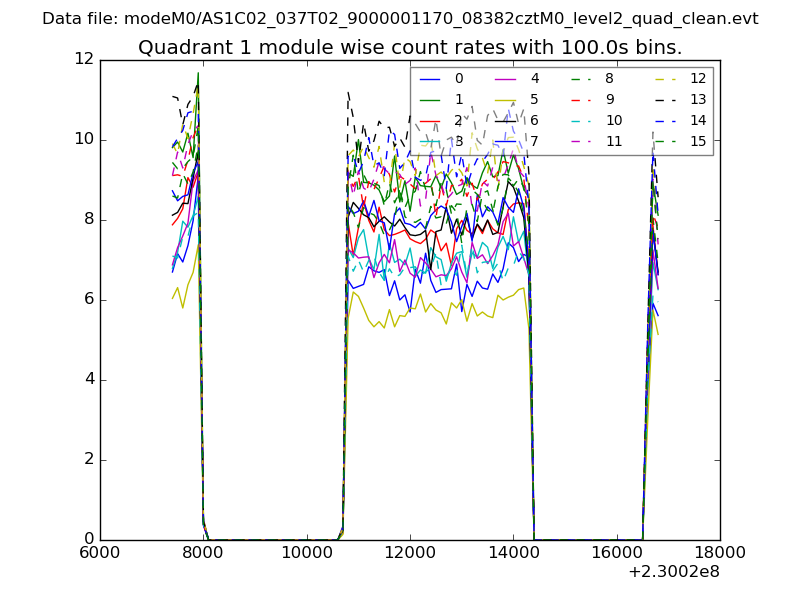
| Module-wise count rates for Quadrant A Data is divided into 100 sec bins |
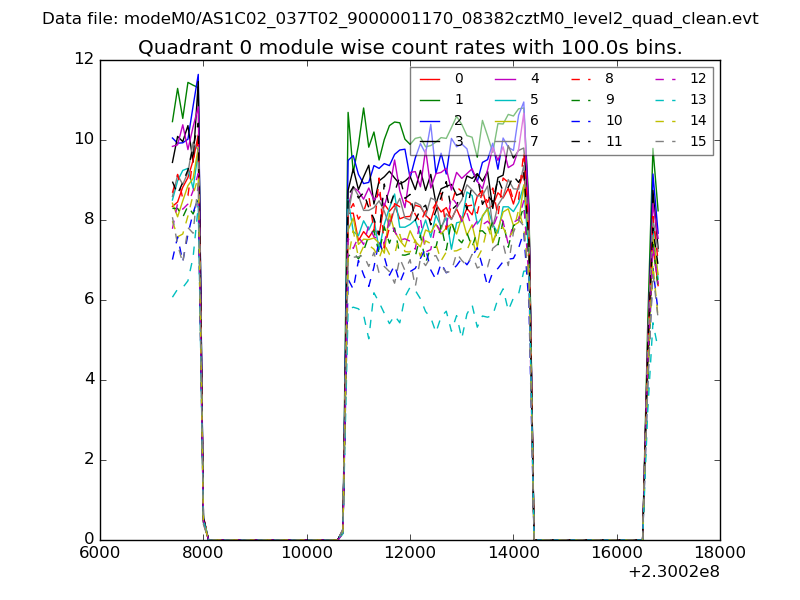 |
 |
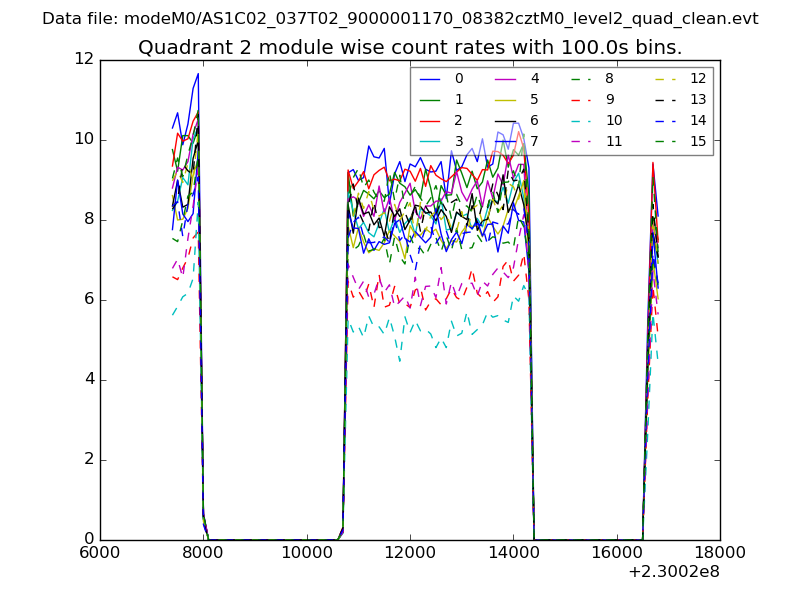
| Module-wise count rates for Quadrant B Data is divided into 100 sec bins |
 |
 |
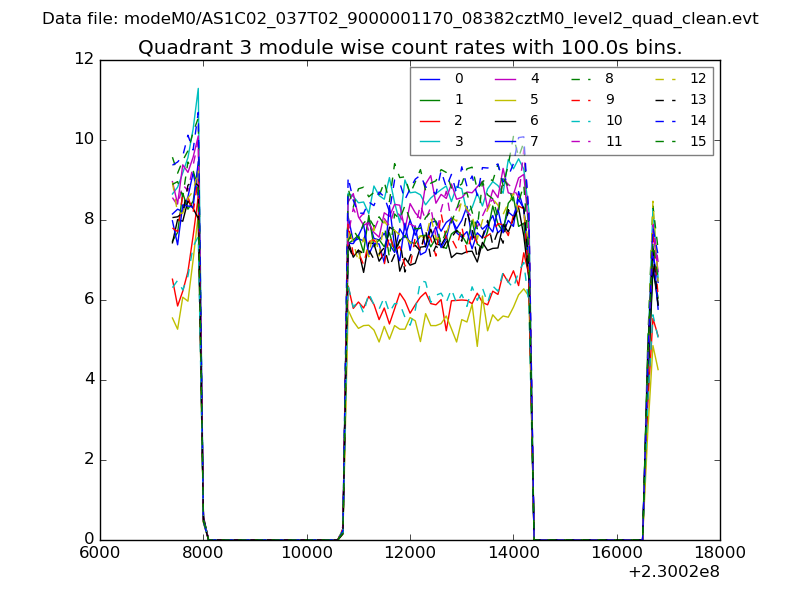
| Module-wise count rates for Quadrant C Data is divided into 100 sec bins |
 |
 |
| Module-wise count rates for Quadrant D Data is divided into 100 sec bins |
 |
 |
| Parameter | Plot |
|---|---|
| CZT HV Monitor | 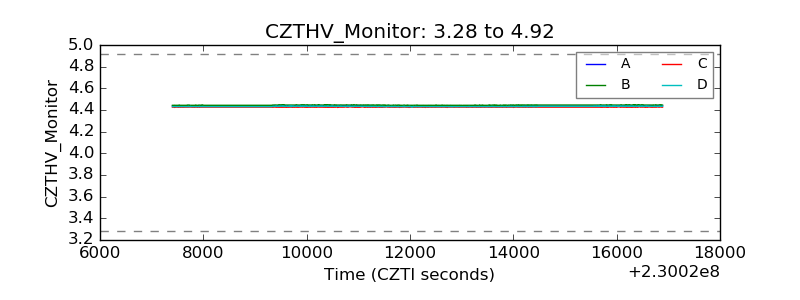 |
| D_VDD | 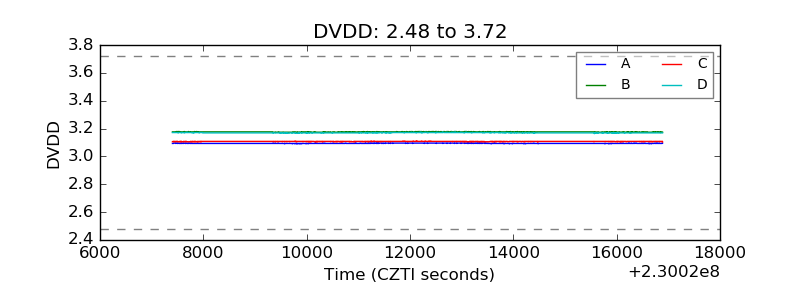 |
| Temperature 1 | 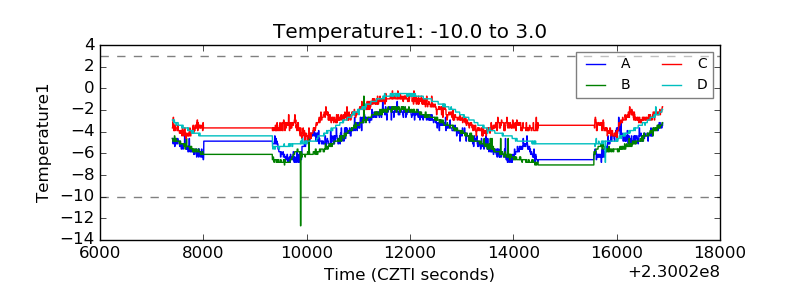 |
| Veto HV Monitor | 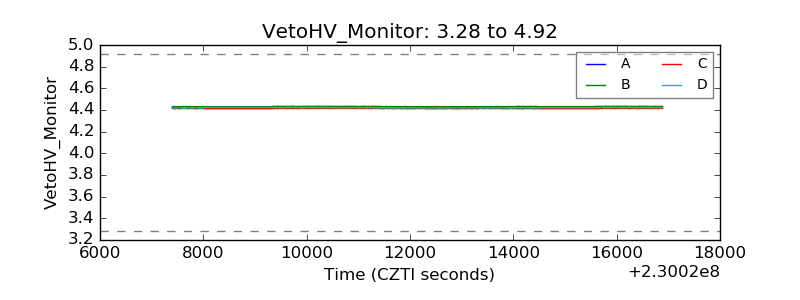 |
| Veto LLD | 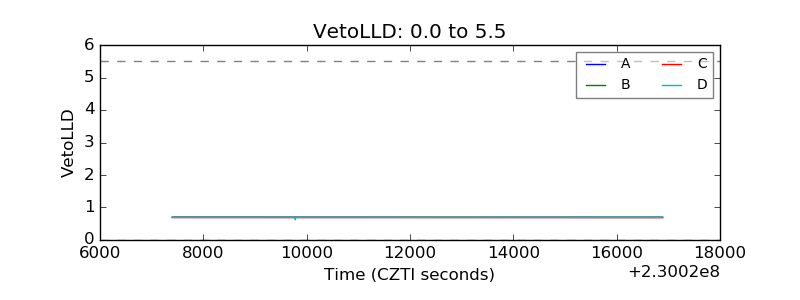 |
| Alpha Counter | 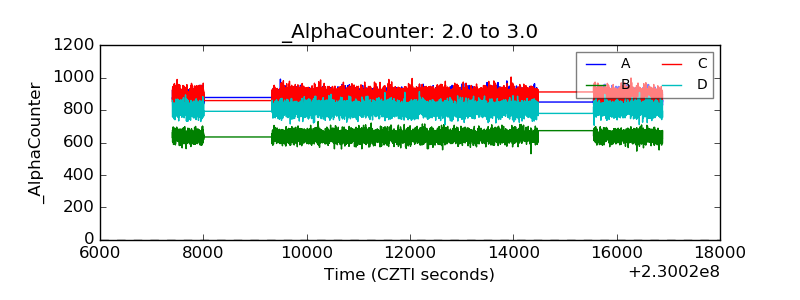 |
| _CPM_Rate | 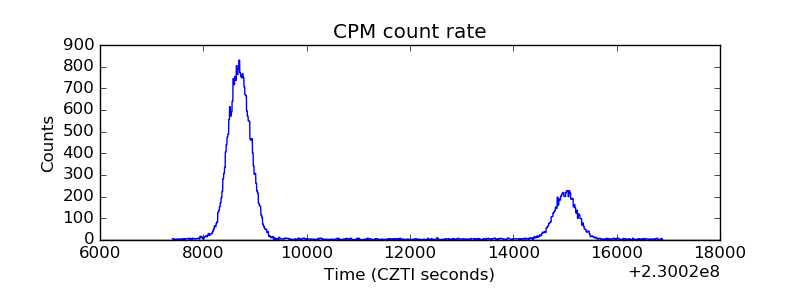 |
| CZT Counter | 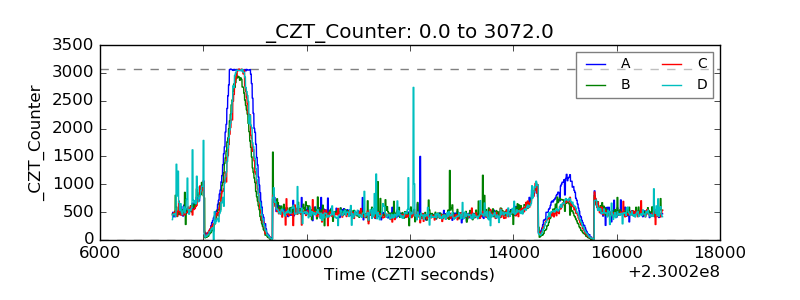 |
| +2.5 Volts monitor |  |
| +5 Volts monitor |  |
| _ROLL_ROT | 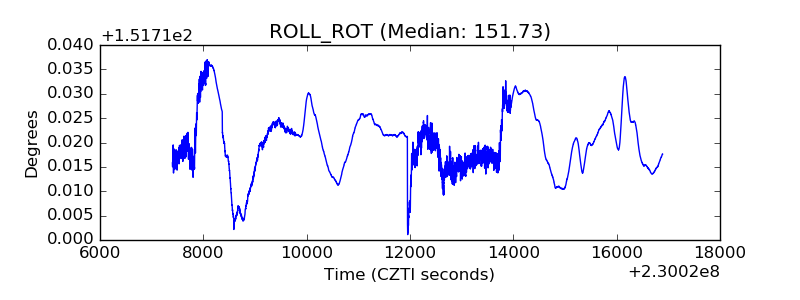 |
| _Roll_DEC |  |
| _Roll_RA | 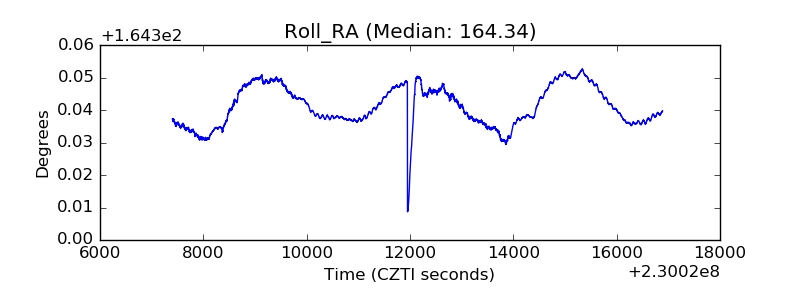 |
| Veto Counter | 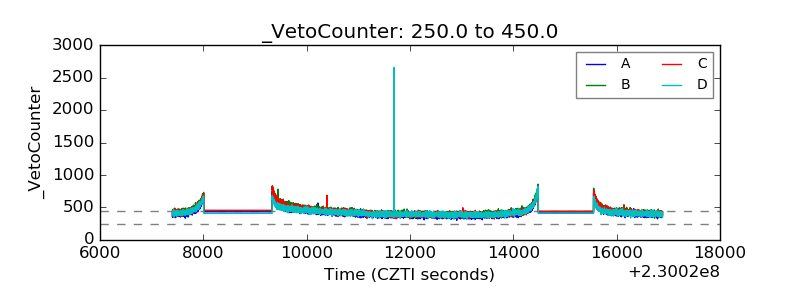 |