| Param | Original file | Final file |
|---|---|---|
| Filename | modeM0/AS1C02_037T02_9000001170_08383cztM0_level2.evt | modeM0/AS1C02_037T02_9000001170_08383cztM0_level2_quad_clean.evt |
| Size (bytes) | 292,890,240 | 63,996,480 |
| Size | 279.3 MB | 61.0 MB |
| Events in quadrant A | 2,084,322 | 413,679 |
| Events in quadrant B | 2,343,984 | 412,174 |
| Events in quadrant C | 1,979,757 | 405,254 |
| Events in quadrant D | 2,157,462 | 392,743 |
| Mode SS | |||
|---|---|---|---|
| Quadrant | BADHDUFLAG | Total packets | Discarded packets |
| A | 0 | 90 | 0 |
| B | 0 | 90 | 0 |
| C | 0 | 90 | 0 |
| D | 0 | 90 | 0 |
| Mode M0 | |||
|---|---|---|---|
| Quadrant | BADHDUFLAG | Total packets | Discarded packets |
| A | 0 | 9157 | 1 |
| B | 0 | 9693 | 1 |
| C | 0 | 9012 | 1 |
| D | 0 | 9492 | 1 |
| Mode M9 | |||
|---|---|---|---|
| Quadrant | BADHDUFLAG | Total packets | Discarded packets |
| A | 0 | 8 | 0 |
| B | 0 | 8 | 0 |
| C | 0 | 8 | 0 |
| D | 0 | 9 | 0 |
| Quadrant | Total seconds | Saturated seconds | Saturation percentage |
|---|---|---|---|
| A | 4460 | 29 | 0.650224% |
| B | 4460 | 37 | 0.829596% |
| C | 4460 | 8 | 0.179372% |
| D | 4460 | 31 | 0.695067% |
Noise dominated data is calculated using 1-second bins in cleaned event files. If a bin has >2000 counts, and if more than 50% of those come from <1% of pixels, then it is considered to be noise-dominated and hence unusable.
| Quadrant | # 1 sec bins | Bins with >0 counts | Bins with >2000 counts | High rate bins dominated by noise | Noise dominated (total time) | Noise dominated (detector-on time) | Marked lightcurve |
|---|---|---|---|---|---|---|---|
| A | 4460 | 4460 | 1 | 1 | 0.02% | 0.02% | 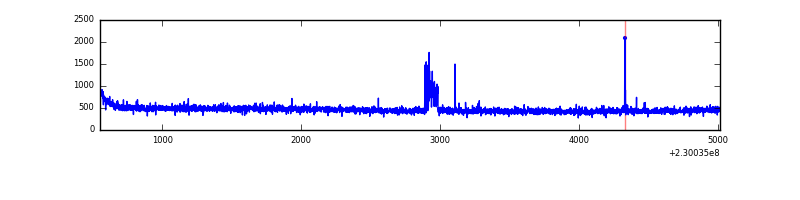 |
| B | 4460 | 4460 | 11 | 11 | 0.25% | 0.25% | 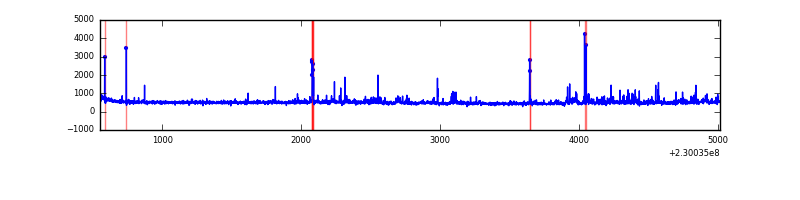 |
| C | 4460 | 4460 | 0 | 0 | 0.00% | 0.00% |  |
| D | 4460 | 4460 | 20 | 20 | 0.45% | 0.45% | 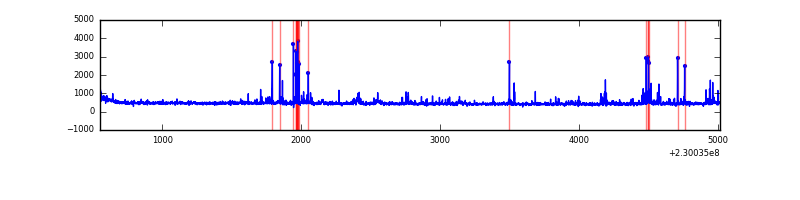 |
Top three noisy pixels from each quadrant. If the there are fewer than three noisy pixels in the level2.evt file, extra rows are filled as -1
| Pixel properties | Quadrant properties | ||||||
|---|---|---|---|---|---|---|---|
| Quadrant | DetID | PixID | Counts | Sigma | Mean | Median | Sigma |
| A | 14 | 111 | 41576 | 375.85 | 528 | 516 | 109.2 |
| A | 5 | 16 | 7823 | 66.89 | 528 | 516 | 109.2 |
| A | 0 | 226 | 4899 | 40.12 | 528 | 516 | 109.2 |
| B | 4 | 48 | 131103 | 1285.75 | 527 | 516 | 101.6 |
| B | 0 | 214 | 78933 | 772.09 | 527 | 516 | 101.6 |
| B | 10 | 252 | 24868 | 239.77 | 527 | 516 | 101.6 |
| C | 13 | 61 | 3841 | 28.15 | 507 | 508 | 118.4 |
| C | 1 | 16 | 1488 | 8.28 | 507 | 508 | 118.4 |
| C | 3 | 202 | 1259 | 6.34 | 507 | 508 | 118.4 |
| D | 14 | 34 | 84061 | 664.34 | 509 | 493 | 125.8 |
| D | 7 | 71 | 56899 | 448.41 | 509 | 493 | 125.8 |
| D | 2 | 14 | 36934 | 289.69 | 509 | 493 | 125.8 |
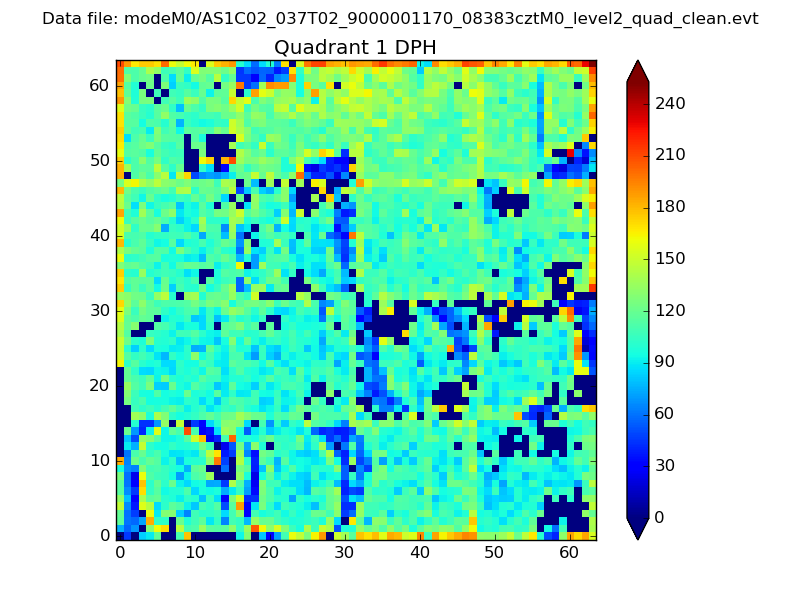
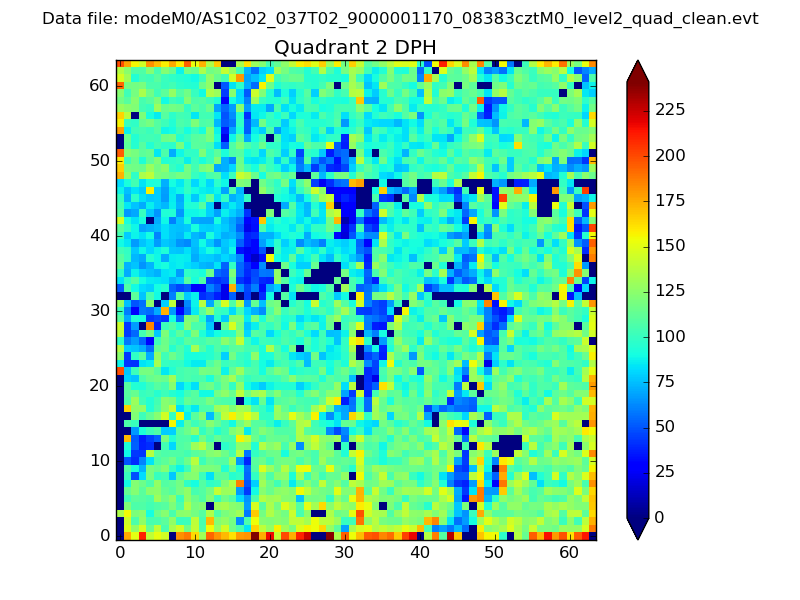
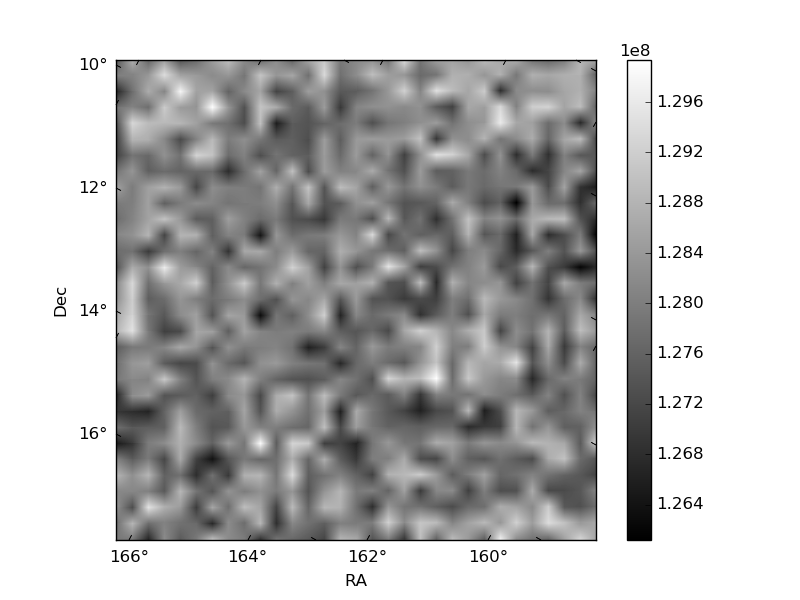
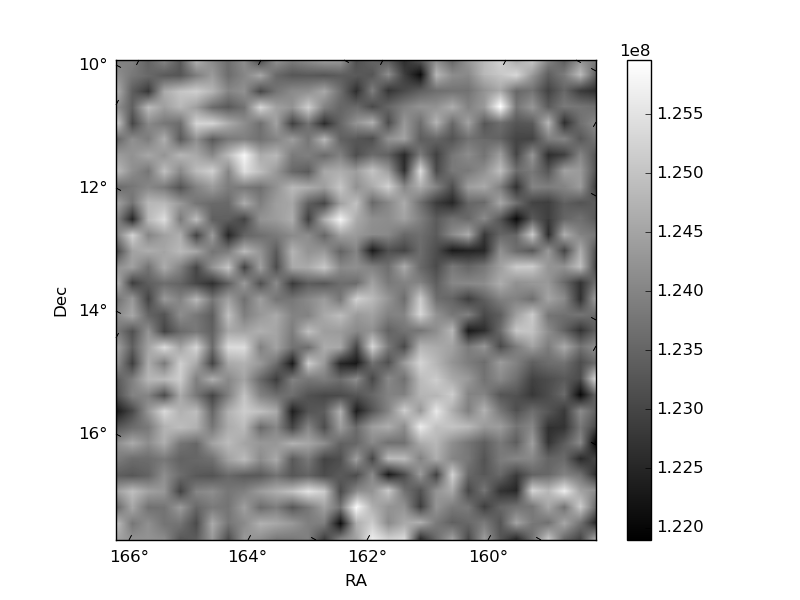
Histogram calculated using DETX and DETY for each event in the final _common_clean file
| Quadrant A | 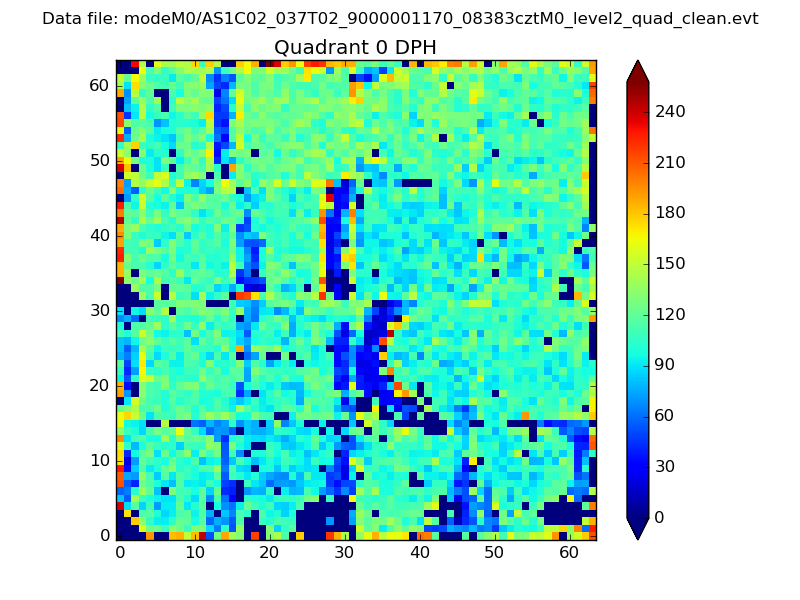 |
 |
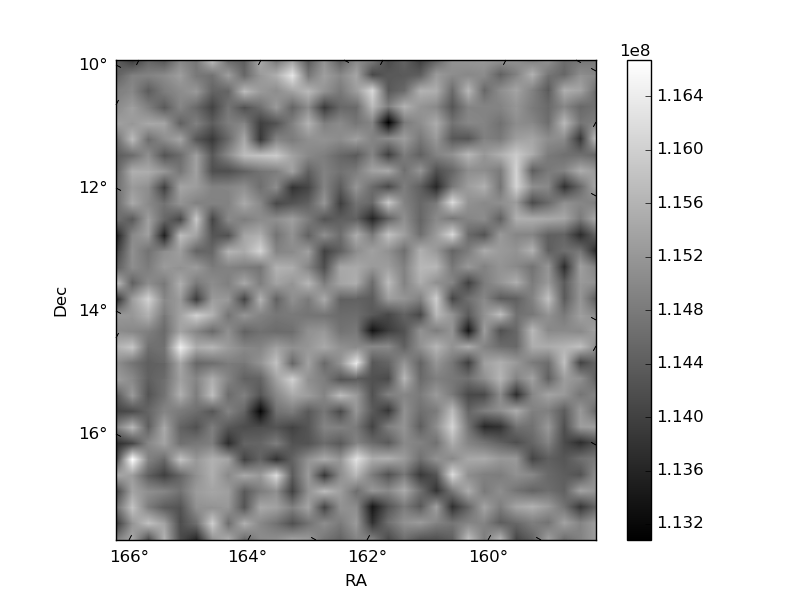
Quadrant B |
|---|---|---|---|
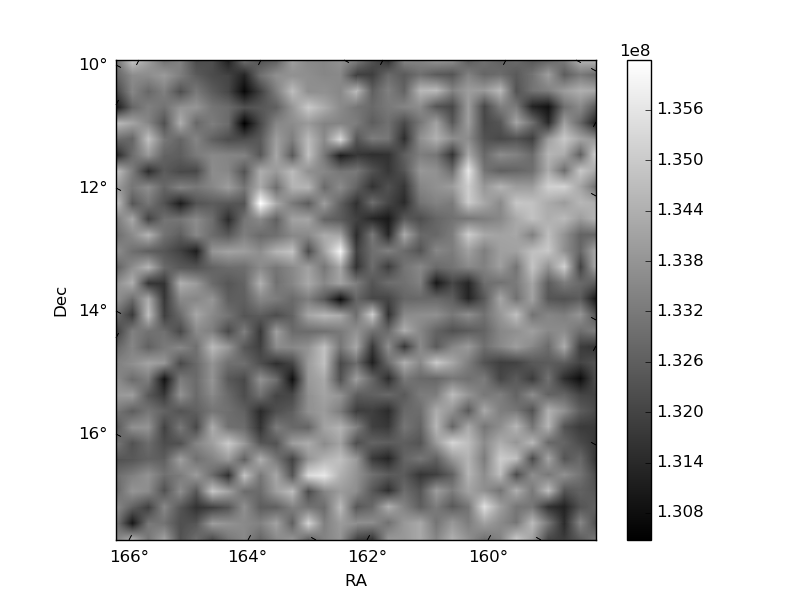
| Quadrant D | 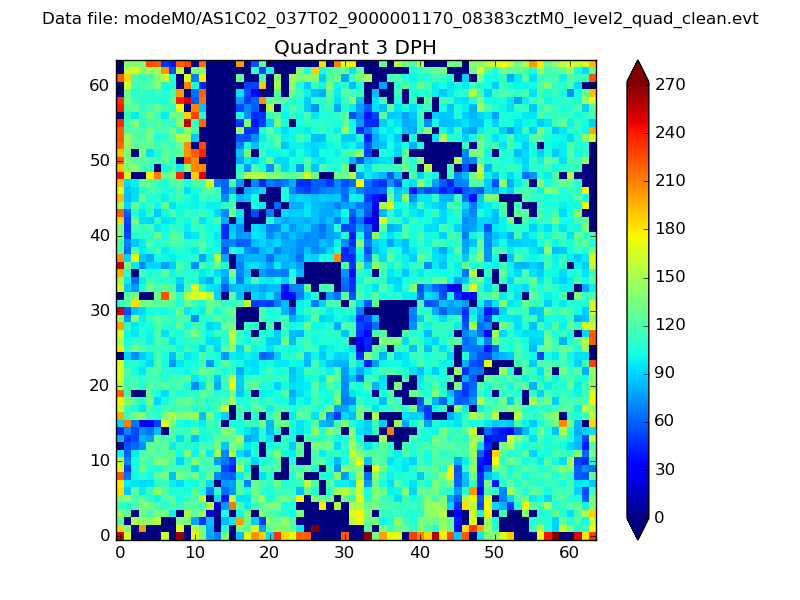 |
 |
Quadrant C |
| Plot type | Count rate plots | Images |
|---|---|---|
| Comparison with Poisson distribution Blue bars denote a histogram of data divided into 1 sec bins. Red curve is a Poisson curve with rate = median count rate of data. |
 |
 |
| Quadrant-wise count rates Data is divided into 100 sec bins |
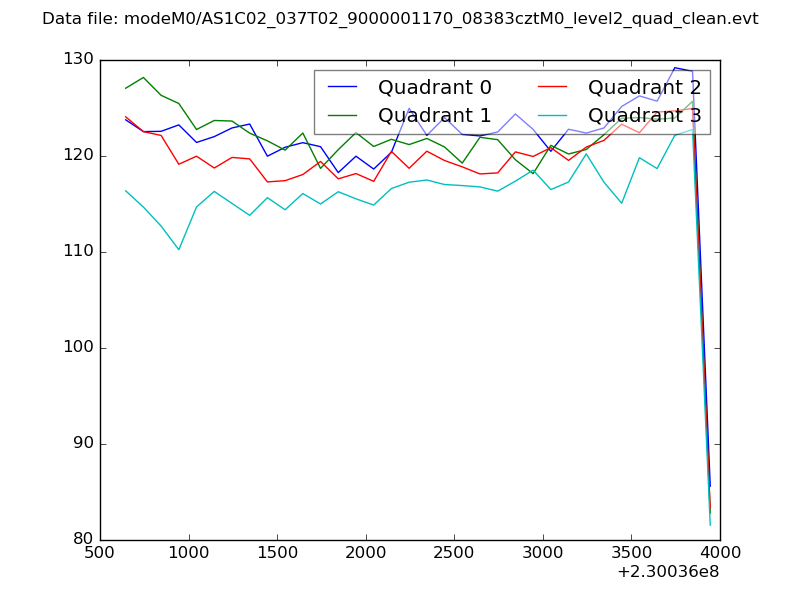 |
|
| Module-wise count rates for Quadrant A Data is divided into 100 sec bins |
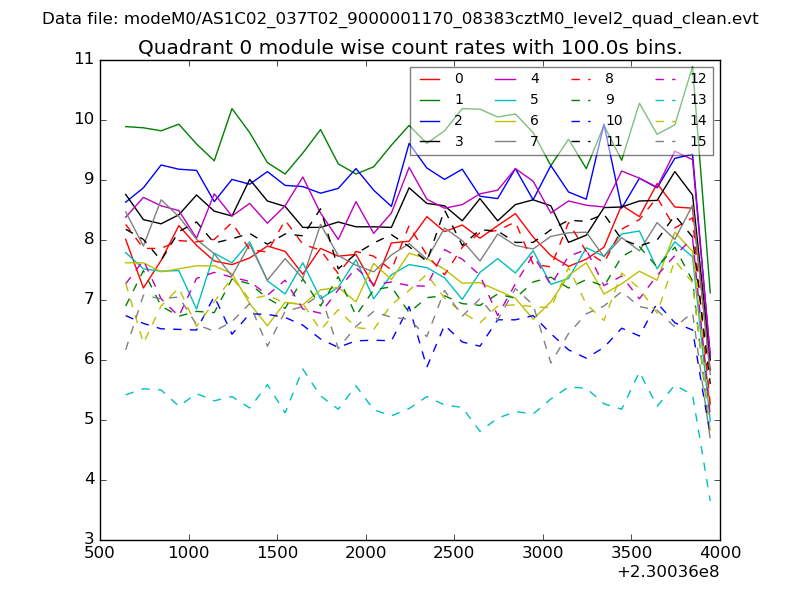 |
 |
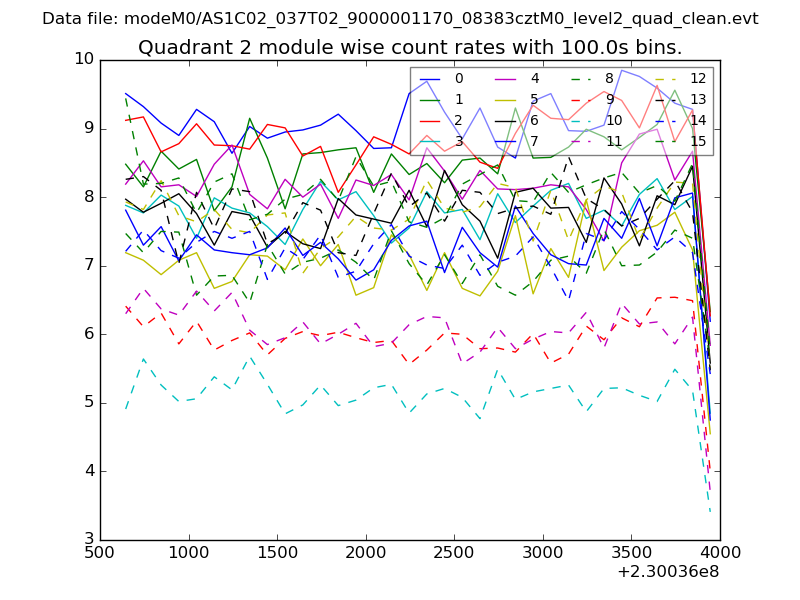
| Module-wise count rates for Quadrant B Data is divided into 100 sec bins |
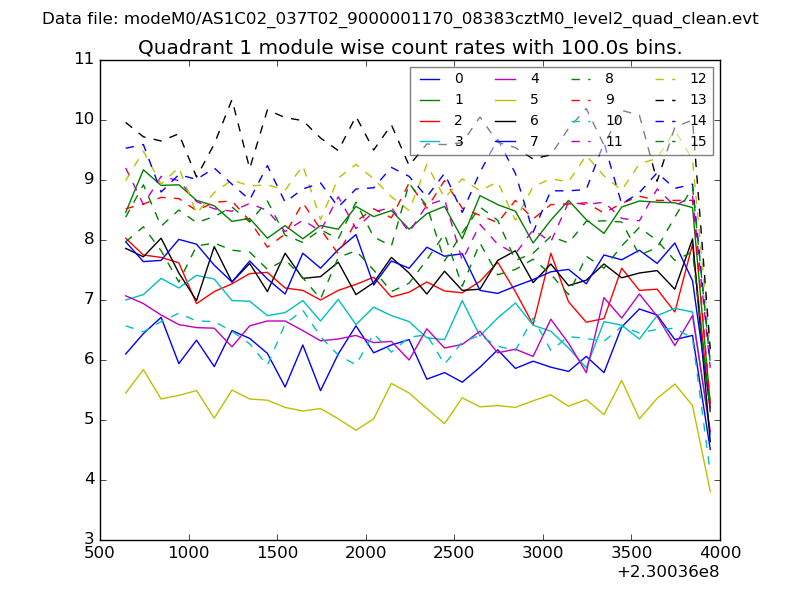 |
 |
| Module-wise count rates for Quadrant C Data is divided into 100 sec bins |
 |
 |
| Module-wise count rates for Quadrant D Data is divided into 100 sec bins |
 |
 |
| Parameter | Plot |
|---|---|
| CZT HV Monitor | 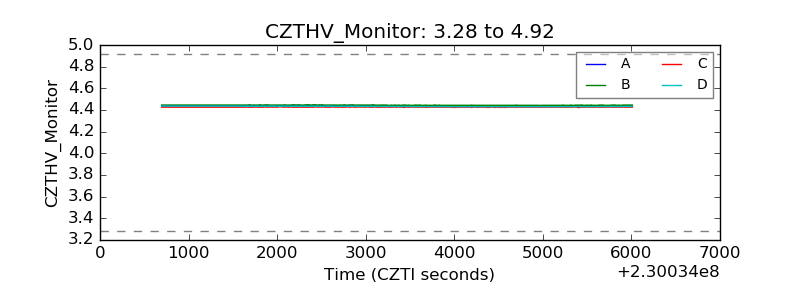 |
| D_VDD | 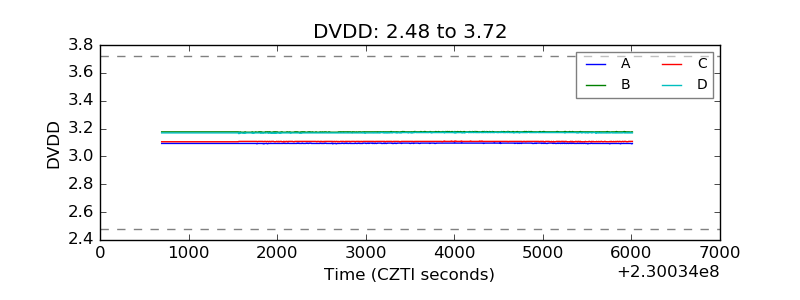 |
| Temperature 1 | 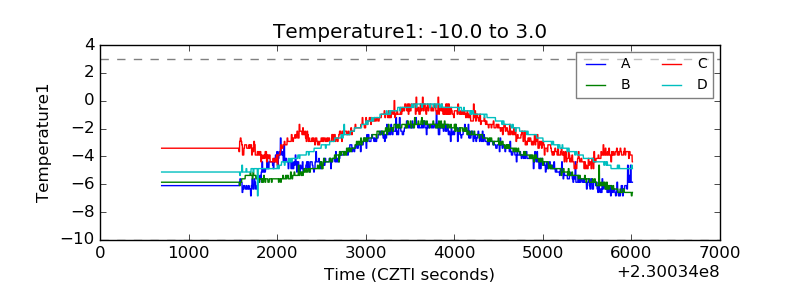 |
| Veto HV Monitor | 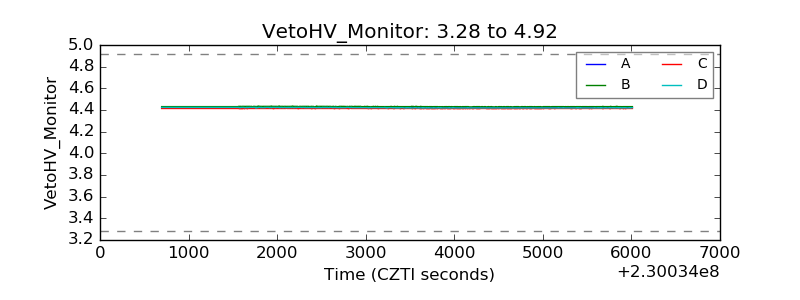 |
| Veto LLD | 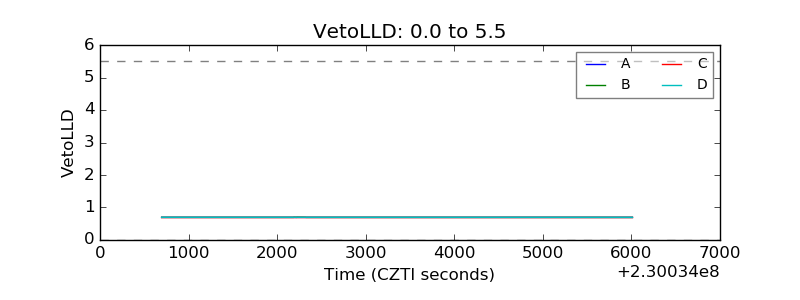 |
| Alpha Counter | 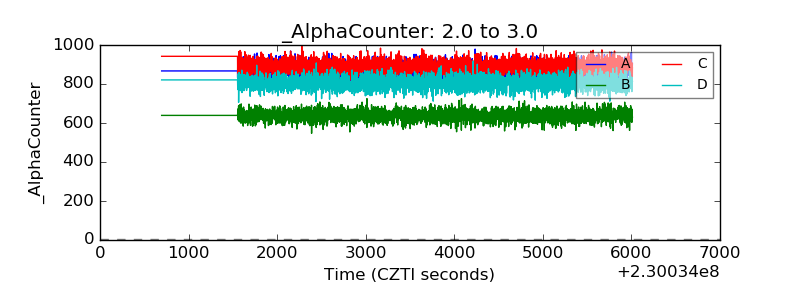 |
| _CPM_Rate | 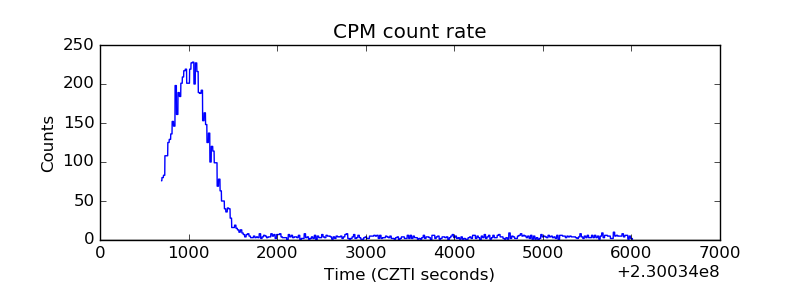 |
| CZT Counter | 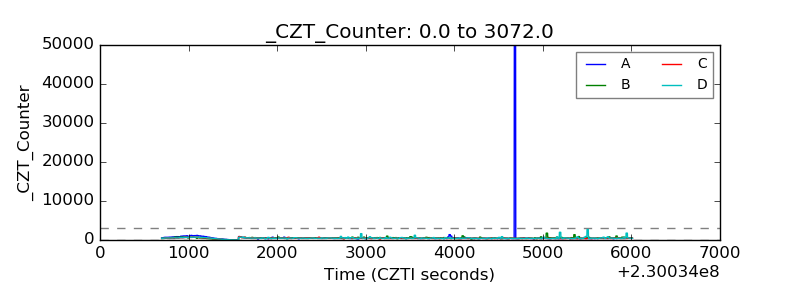 |
| +2.5 Volts monitor |  |
| +5 Volts monitor |  |
| _ROLL_ROT |  |
| _Roll_DEC |  |
| _Roll_RA | 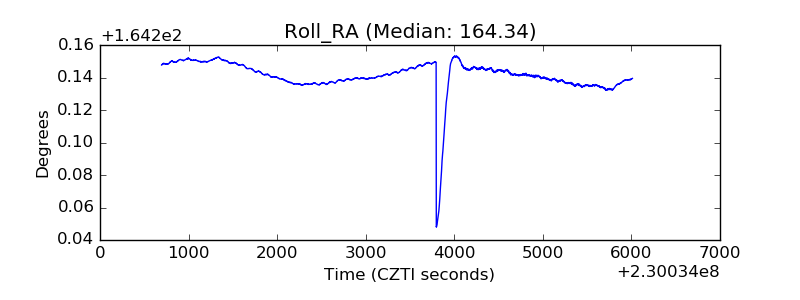 |
| Veto Counter | 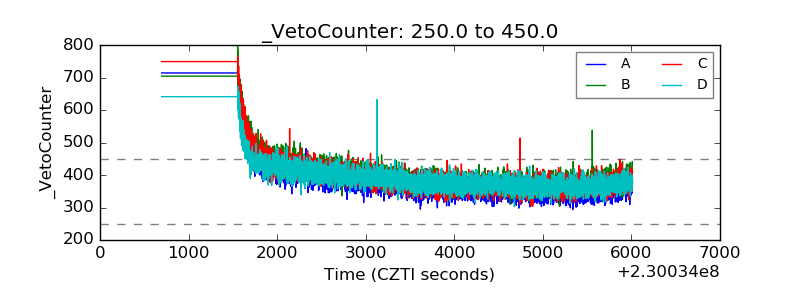 |