| Param | Original file | Final file |
|---|---|---|
| Filename | modeM0/AS1G07_076T04_9000001172cztM0_level2.fits | modeM0/AS1G07_076T04_9000001172cztM0_level2_quad_clean.evt |
| Size (bytes) | 136,483,200 | 140,967,360 |
| Size | 130.2 MB | 134.4 MB |
| Events in quadrant A | 823,460 | 854,517 |
| Events in quadrant B | 787,714 | 848,436 |
| Events in quadrant C | 806,164 | 804,712 |
| Events in quadrant D | 705,392 | 750,655 |
| Mode SS | |||
|---|---|---|---|
| Quadrant | BADHDUFLAG | Total packets | Discarded packets |
| A | 0 | 298 | 0 |
| B | 0 | 298 | 0 |
| C | 0 | 298 | 0 |
| D | 0 | 298 | 0 |
| Mode M0 | |||
|---|---|---|---|
| Quadrant | BADHDUFLAG | Total packets | Discarded packets |
| A | 0 | 30545 | 0 |
| B | 0 | 32855 | 0 |
| C | 0 | 30572 | 0 |
| D | 0 | 31455 | 0 |
| Mode M9 | |||
|---|---|---|---|
| Quadrant | BADHDUFLAG | Total packets | Discarded packets |
| A | 0 | 8 | 0 |
| B | 0 | 8 | 0 |
| C | 0 | 8 | 0 |
| D | 0 | 8 | 0 |
| Quadrant | Total seconds | Saturated seconds | Saturation percentage |
|---|---|---|---|
| A | 14633 | 489 | 3.341762% |
| B | 14633 | 563 | 3.847468% |
| C | 14633 | 352 | 2.405522% |
| D | 14633 | 368 | 2.514864% |
Noise dominated data is calculated using 1-second bins in cleaned event files. If a bin has >2000 counts, and if more than 50% of those come from <1% of pixels, then it is considered to be noise-dominated and hence unusable.
| Quadrant | # 1 sec bins | Bins with >0 counts | Bins with >2000 counts | High rate bins dominated by noise | Noise dominated (total time) | Noise dominated (detector-on time) | Marked lightcurve |
|---|---|---|---|---|---|---|---|
| A | 15433 | 14632 | 0 | 0 | 0.00% | 0.00% |  |
| B | 15433 | 14632 | 0 | 0 | 0.00% | 0.00% |  |
| C | 15433 | 14632 | 0 | 0 | 0.00% | 0.00% |  |
| D | 15433 | 14633 | 0 | 0 | 0.00% | 0.00% |  |
Top three noisy pixels from each quadrant. If the there are fewer than three noisy pixels in the level2.evt file, extra rows are filled as -1
| Pixel properties | Quadrant properties | ||||||
|---|---|---|---|---|---|---|---|
| Quadrant | DetID | PixID | Counts | Sigma | Mean | Median | Sigma |
| A | 14 | 188 | 818 | 11.07 | 213 | 198 | 56.0 |
| A | 0 | 29 | 756 | 9.96 | 213 | 198 | 56.0 |
| A | 14 | 204 | 705 | 9.05 | 213 | 198 | 56.0 |
| B | 2 | 9 | 679 | 10.96 | 207 | 197 | 44.0 |
| B | 14 | 254 | 568 | 8.43 | 207 | 197 | 44.0 |
| B | 2 | 8 | 524 | 7.43 | 207 | 197 | 44.0 |
| C | 1 | 81 | 567 | 6.38 | 212 | 195 | 58.3 |
| C | 1 | 80 | 564 | 6.33 | 212 | 195 | 58.3 |
| C | 12 | 241 | 543 | 5.97 | 212 | 195 | 58.3 |
| D | 3 | 14 | 531 | 6.29 | 200 | 182 | 55.5 |
| D | 7 | 3 | 507 | 5.85 | 200 | 182 | 55.5 |
| D | 7 | 5 | 504 | 5.8 | 200 | 182 | 55.5 |
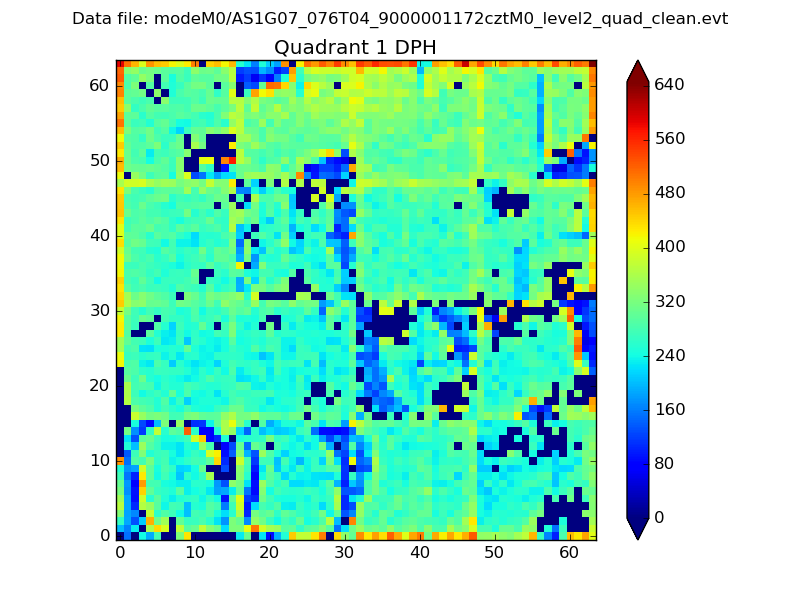
Histogram calculated using DETX and DETY for each event in the final _common_clean file
| Quadrant A |  |
 |
Quadrant B |
|---|---|---|---|
| Quadrant D |  |
 |
Quadrant C |
| Plot type | Count rate plots | Images |
|---|---|---|
| Comparison with Poisson distribution Blue bars denote a histogram of data divided into 1 sec bins. Red curve is a Poisson curve with rate = median count rate of data. |
 |
 |
| Quadrant-wise count rates Data is divided into 100 sec bins |
 |
|
| Module-wise count rates for Quadrant A Data is divided into 100 sec bins |
 |
 |
| Module-wise count rates for Quadrant B Data is divided into 100 sec bins |
 |
 |
| Module-wise count rates for Quadrant C Data is divided into 100 sec bins |
 |
 |
| Module-wise count rates for Quadrant D Data is divided into 100 sec bins |
 |
 |
| Parameter | Plot |
|---|---|
| CZT HV Monitor |  |
| D_VDD |  |
| Temperature 1 |  |
| Veto HV Monitor |  |
| Veto LLD |  |
| Alpha Counter |  |
| _CPM_Rate |  |
| CZT Counter |  |
| +2.5 Volts monitor |  |
| +5 Volts monitor |  |
| _ROLL_ROT |  |
| _Roll_DEC |  |
| _Roll_RA |  |
| Veto Counter |  |