| Param | Original file | Final file |
|---|---|---|
| Filename | modeM0/AS1G07_076T04_9000001172_08383cztM0_level2.evt | modeM0/AS1G07_076T04_9000001172_08383cztM0_level2_quad_clean.evt |
| Size (bytes) | 145,817,280 | 14,448,960 |
| Size | 139.1 MB | 13.8 MB |
| Events in quadrant A | 1,036,131 | 73,088 |
| Events in quadrant B | 1,200,794 | 75,277 |
| Events in quadrant C | 1,005,192 | 70,998 |
| Events in quadrant D | 1,032,217 | 68,728 |
| Mode SS | |||
|---|---|---|---|
| Quadrant | BADHDUFLAG | Total packets | Discarded packets |
| A | 0 | 44 | 0 |
| B | 0 | 44 | 0 |
| C | 0 | 44 | 0 |
| D | 0 | 44 | 0 |
| Mode M0 | |||
|---|---|---|---|
| Quadrant | BADHDUFLAG | Total packets | Discarded packets |
| A | 0 | 4327 | 2 |
| B | 0 | 4833 | 1 |
| C | 0 | 4306 | 1 |
| D | 0 | 4415 | 1 |
| Mode M9 | |||
|---|---|---|---|
| Quadrant | BADHDUFLAG | Total packets | Discarded packets |
| A | 0 | 7 | 0 |
| B | 0 | 7 | 0 |
| C | 0 | 7 | 0 |
| D | 0 | 7 | 0 |
| Quadrant | Total seconds | Saturated seconds | Saturation percentage |
|---|---|---|---|
| A | 2043 | 89 | 4.356339% |
| B | 2043 | 108 | 5.286344% |
| C | 2043 | 67 | 3.279491% |
| D | 2043 | 66 | 3.230543% |
Noise dominated data is calculated using 1-second bins in cleaned event files. If a bin has >2000 counts, and if more than 50% of those come from <1% of pixels, then it is considered to be noise-dominated and hence unusable.
| Quadrant | # 1 sec bins | Bins with >0 counts | Bins with >2000 counts | High rate bins dominated by noise | Noise dominated (total time) | Noise dominated (detector-on time) | Marked lightcurve |
|---|---|---|---|---|---|---|---|
| A | 2763 | 2044 | 0 | 0 | 0.00% | 0.00% | 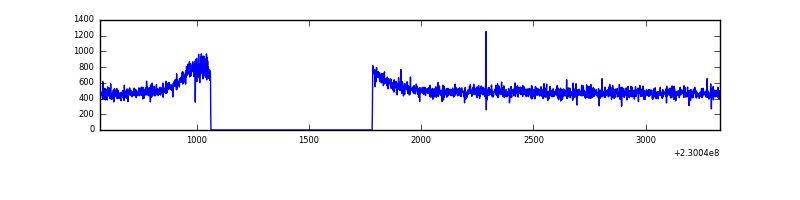 |
| B | 2763 | 2043 | 0 | 0 | 0.00% | 0.00% | 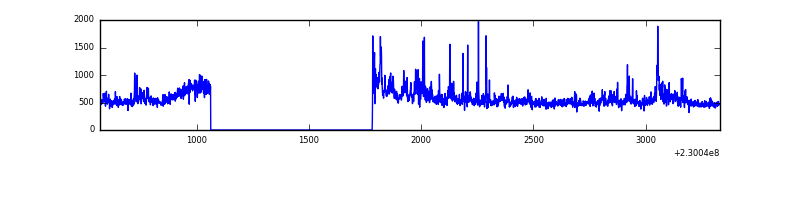 |
| C | 2763 | 2044 | 0 | 0 | 0.00% | 0.00% | 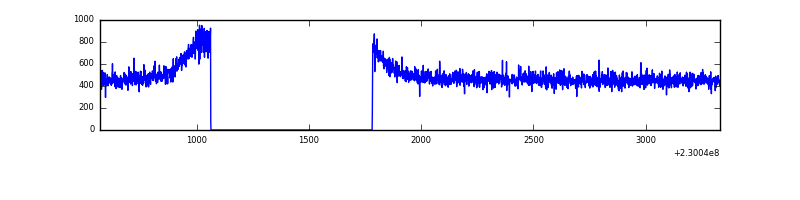 |
| D | 2763 | 2044 | 1 | 1 | 0.04% | 0.05% | 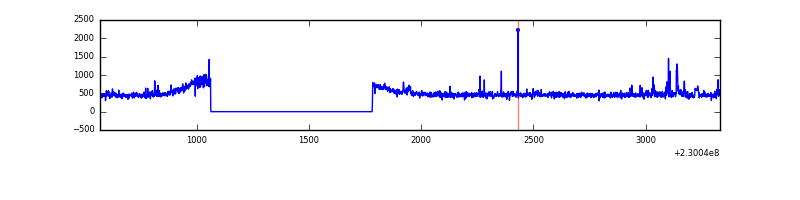 |
Top three noisy pixels from each quadrant. If the there are fewer than three noisy pixels in the level2.evt file, extra rows are filled as -1
| Pixel properties | Quadrant properties | ||||||
|---|---|---|---|---|---|---|---|
| Quadrant | DetID | PixID | Counts | Sigma | Mean | Median | Sigma |
| A | 12 | 194 | 2506 | 39.16 | 268 | 262 | 57.3 |
| A | 0 | 226 | 2474 | 38.61 | 268 | 262 | 57.3 |
| A | 13 | 14 | 2052 | 31.24 | 268 | 262 | 57.3 |
| B | 4 | 48 | 107519 | 1969.45 | 268 | 261 | 54.5 |
| B | 0 | 231 | 23994 | 435.78 | 268 | 261 | 54.5 |
| B | 0 | 214 | 9772 | 174.64 | 268 | 261 | 54.5 |
| C | 13 | 61 | 1940 | 27.16 | 257 | 257 | 62.0 |
| C | 14 | 67 | 866 | 9.83 | 257 | 257 | 62.0 |
| C | 3 | 202 | 585 | 5.29 | 257 | 257 | 62.0 |
| D | 1 | 52 | 15904 | 243.89 | 258 | 249 | 64.2 |
| D | 12 | 233 | 8962 | 135.74 | 258 | 249 | 64.2 |
| D | 7 | 71 | 8306 | 125.52 | 258 | 249 | 64.2 |
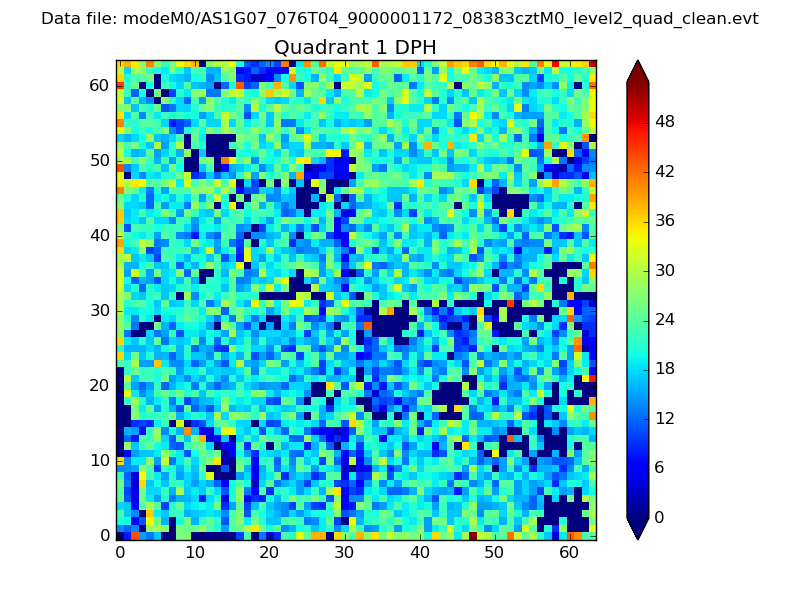
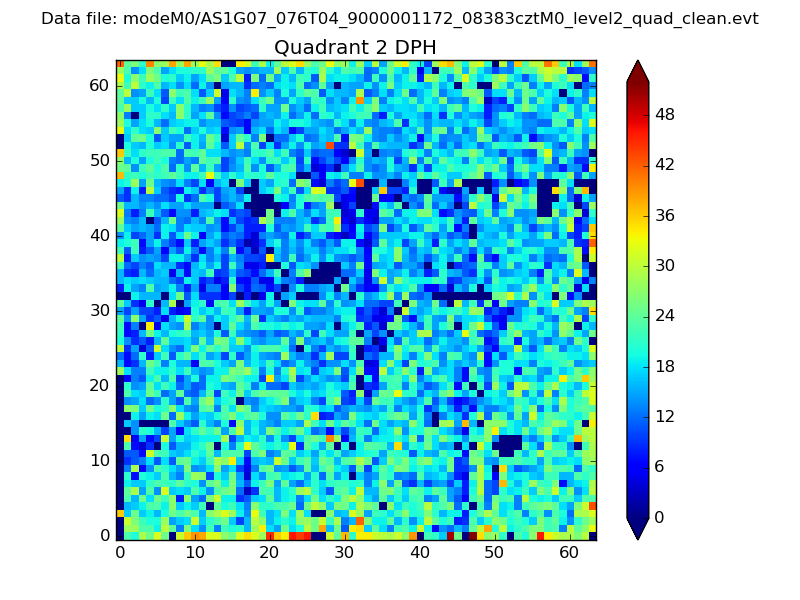
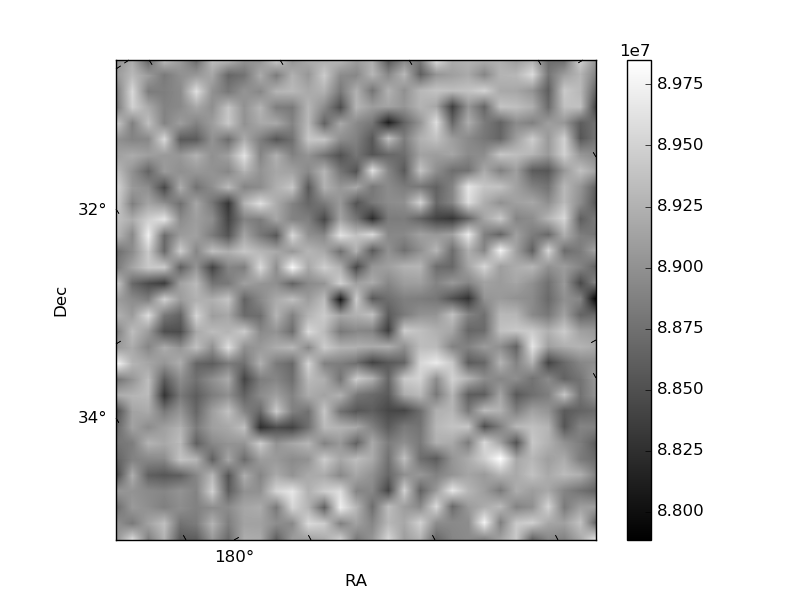
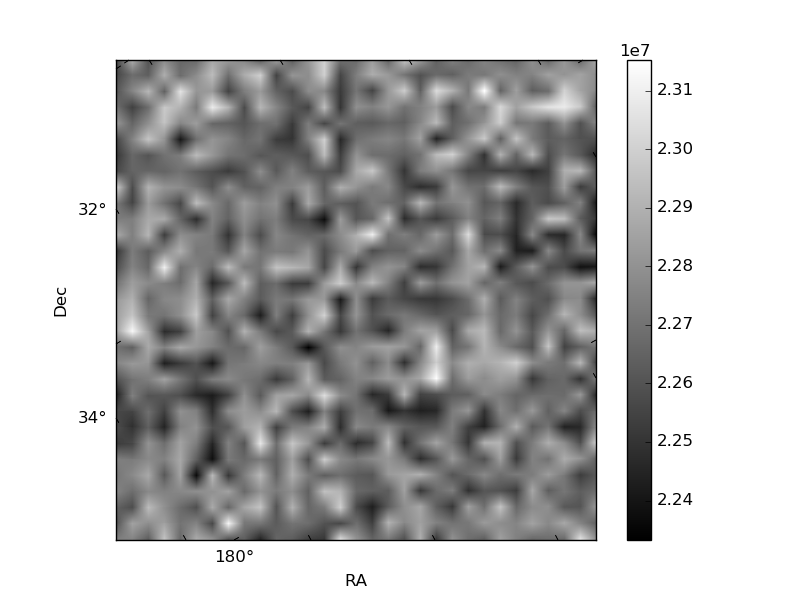
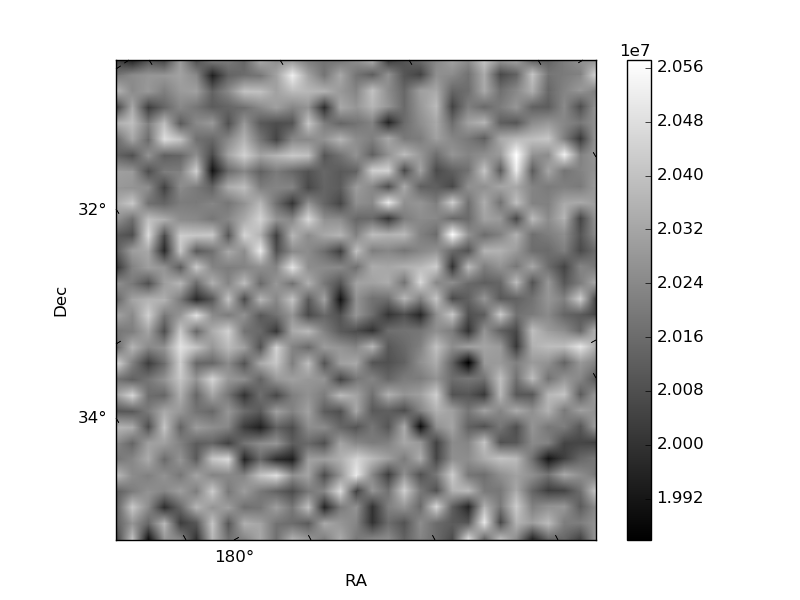
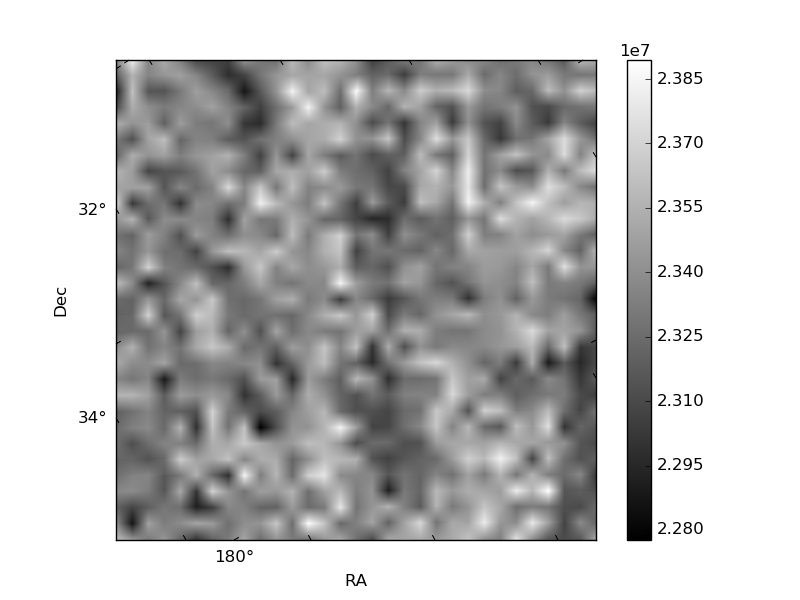
Histogram calculated using DETX and DETY for each event in the final _common_clean file
| Quadrant A |  |
 |
Quadrant B |
|---|---|---|---|
| Quadrant D | 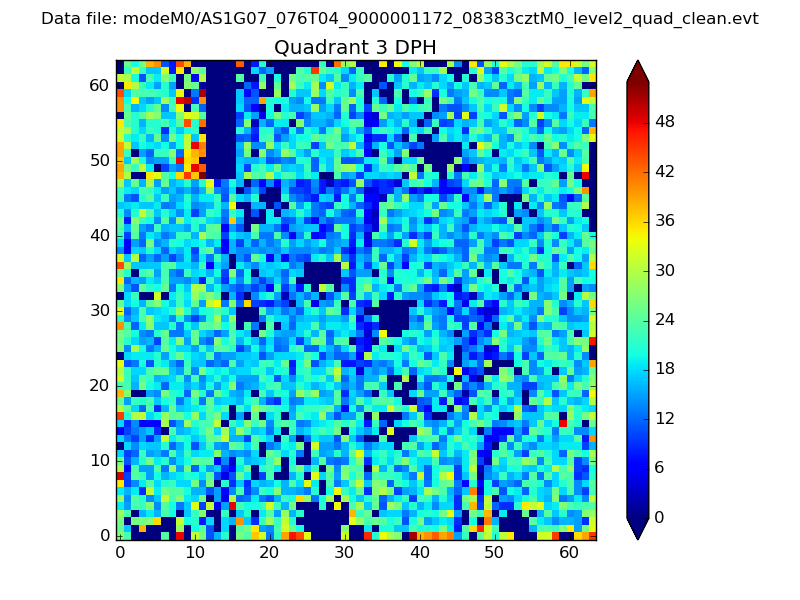 |
 |
Quadrant C |
| Plot type | Count rate plots | Images |
|---|---|---|
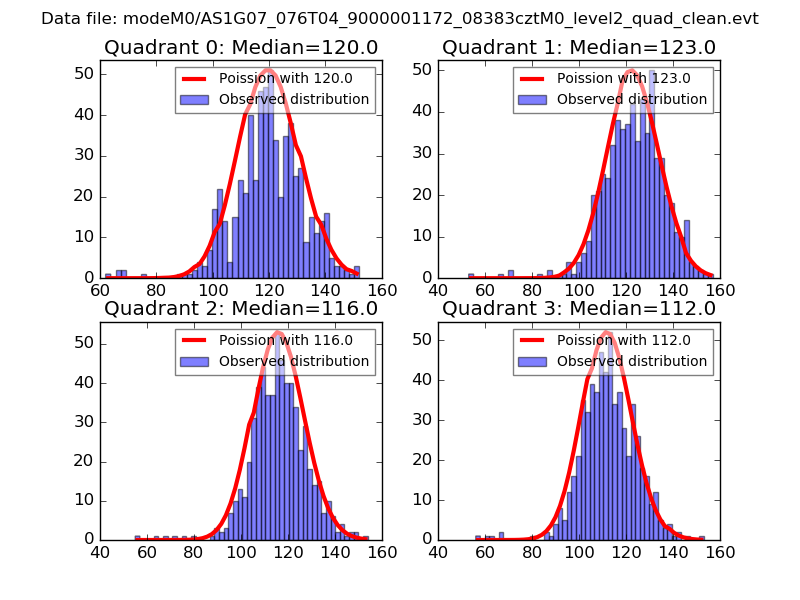
| Comparison with Poisson distribution Blue bars denote a histogram of data divided into 1 sec bins. Red curve is a Poisson curve with rate = median count rate of data. |
 |
 |
| Quadrant-wise count rates Data is divided into 100 sec bins |
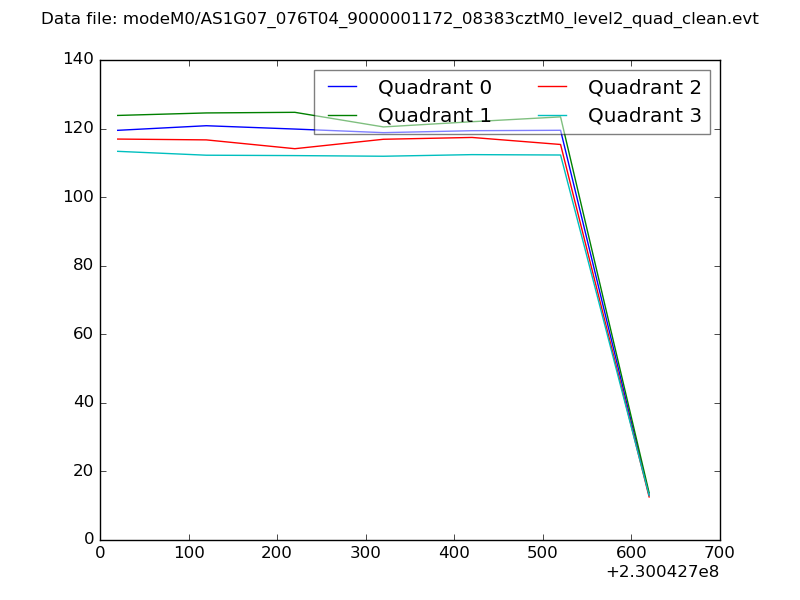 |
|
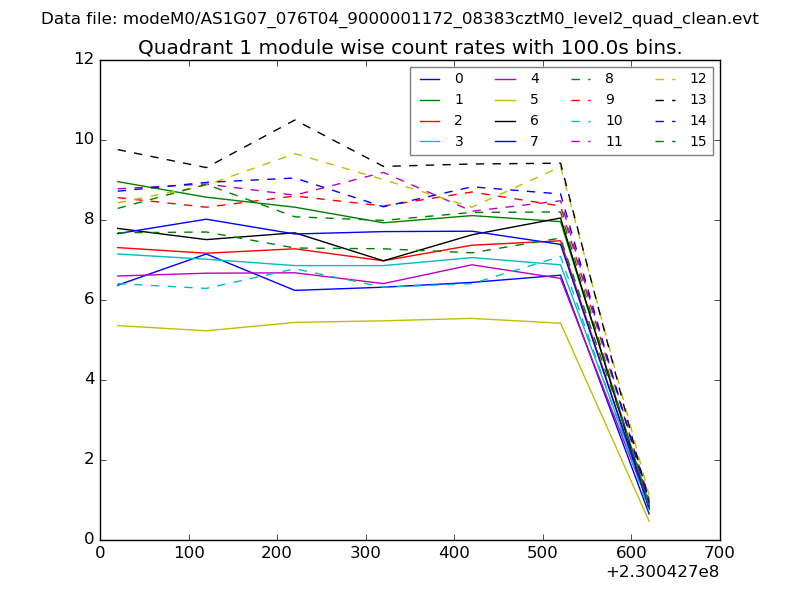
| Module-wise count rates for Quadrant A Data is divided into 100 sec bins |
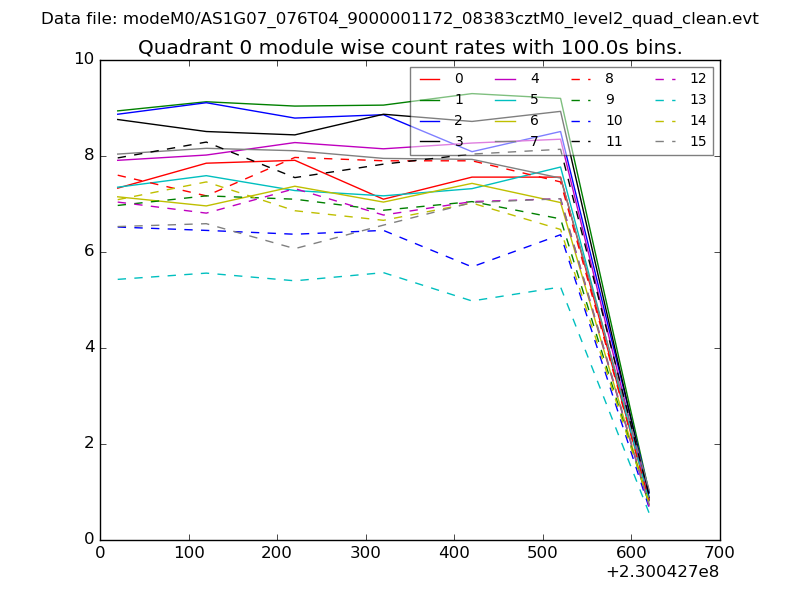 |
 |
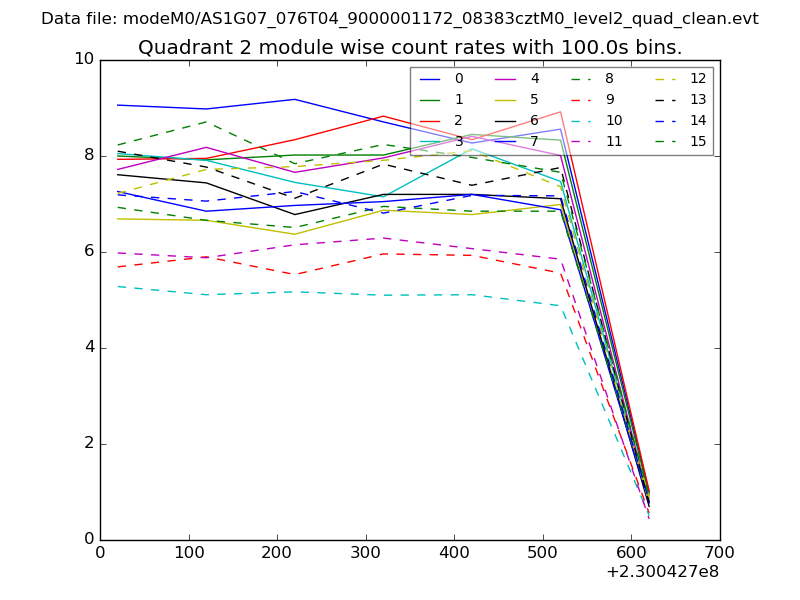
| Module-wise count rates for Quadrant B Data is divided into 100 sec bins |
 |
 |
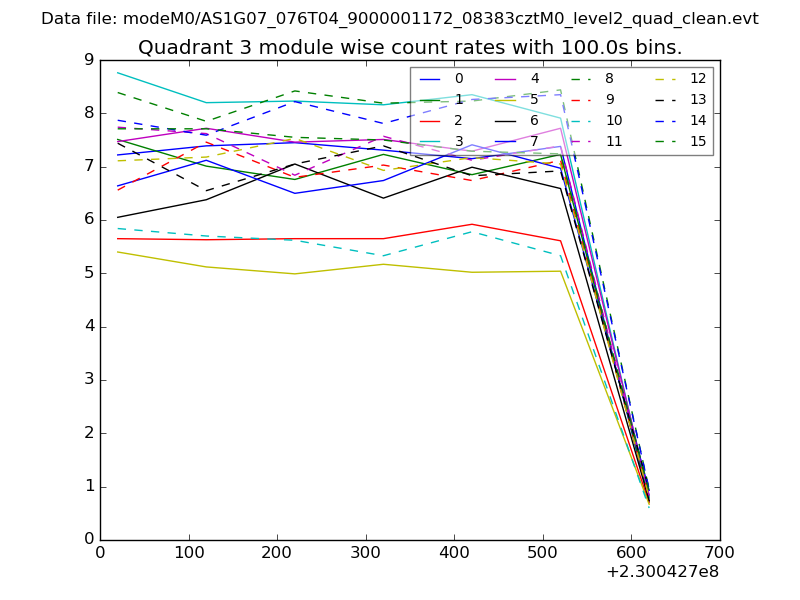
| Module-wise count rates for Quadrant C Data is divided into 100 sec bins |
 |
 |
| Module-wise count rates for Quadrant D Data is divided into 100 sec bins |
 |
 |
| Parameter | Plot |
|---|---|
| CZT HV Monitor | 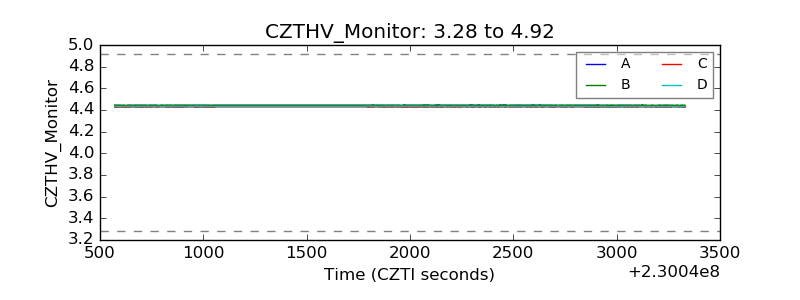 |
| D_VDD | 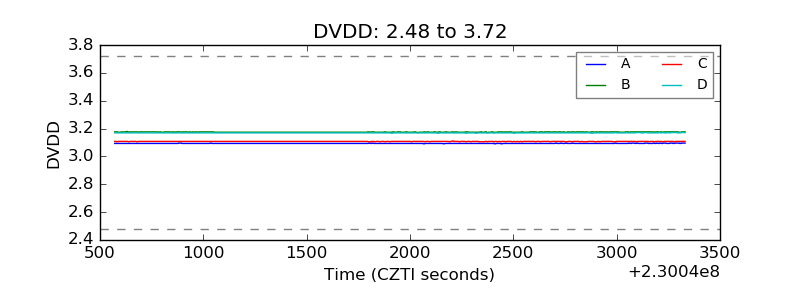 |
| Temperature 1 | 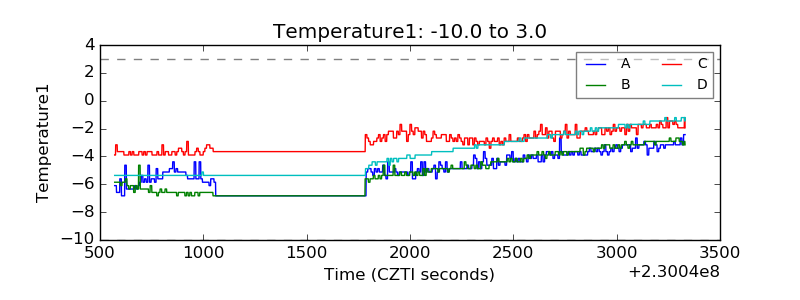 |
| Veto HV Monitor | 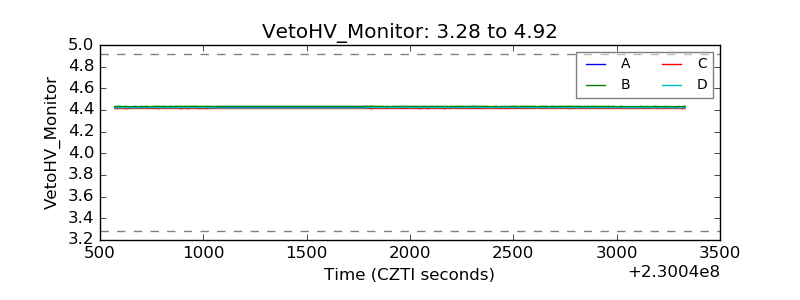 |
| Veto LLD | 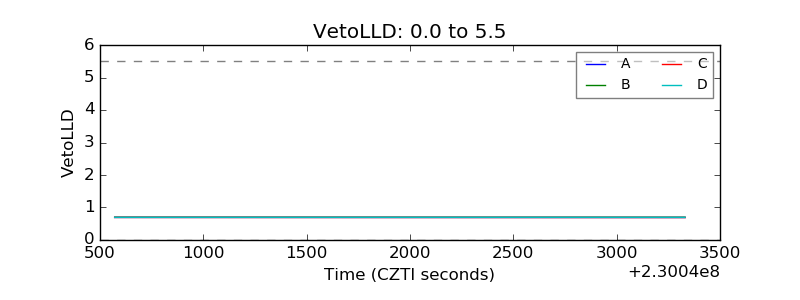 |
| Alpha Counter | 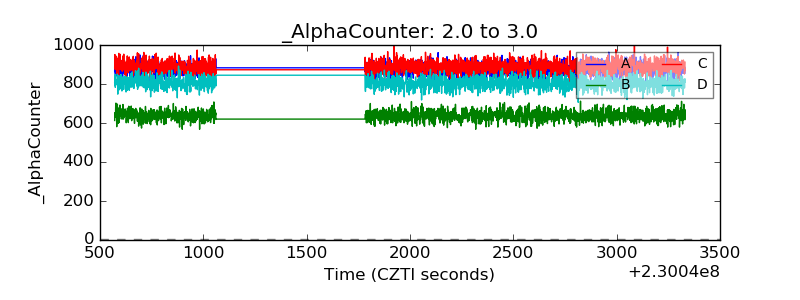 |
| _CPM_Rate | 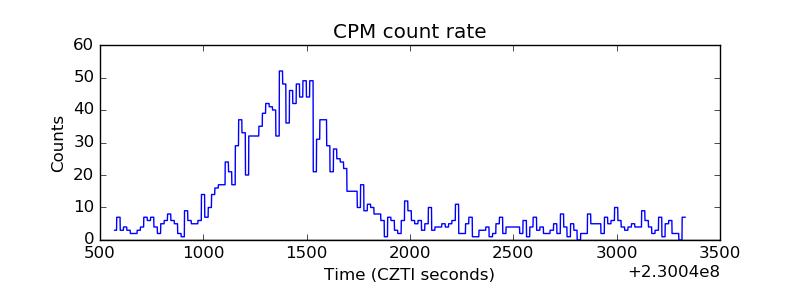 |
| CZT Counter | 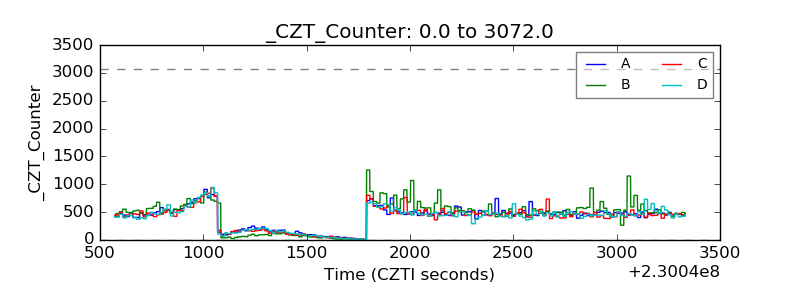 |
| +2.5 Volts monitor |  |
| +5 Volts monitor |  |
| _ROLL_ROT | 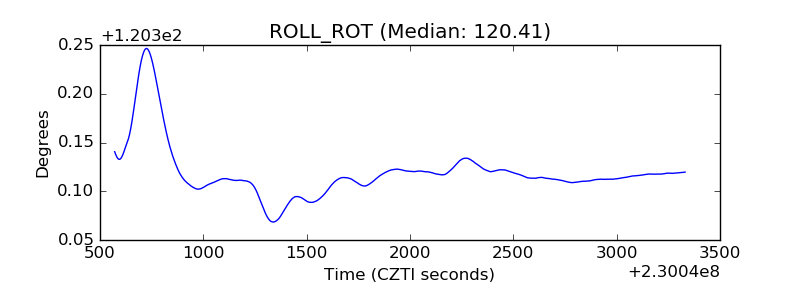 |
| _Roll_DEC | 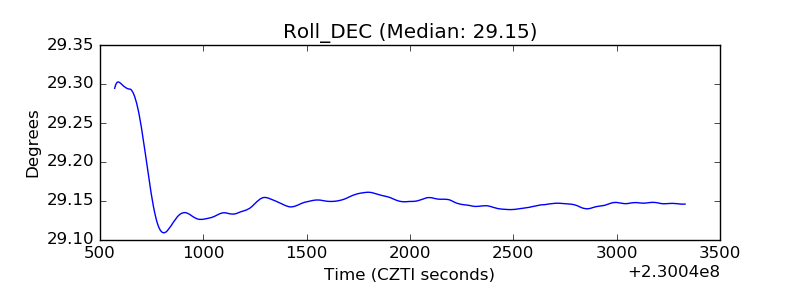 |
| _Roll_RA | 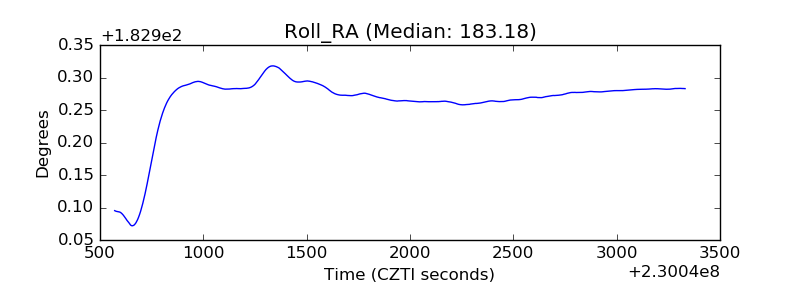 |
| Veto Counter | 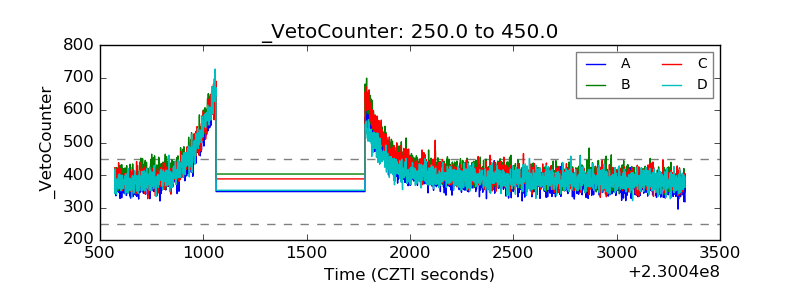 |