| Param | Original file | Final file |
|---|---|---|
| Filename | modeM0/AS1G07_076T04_9000001172_08384cztM0_level2.evt | modeM0/AS1G07_076T04_9000001172_08384cztM0_level2_quad_clean.evt |
| Size (bytes) | 482,616,000 | 87,684,480 |
| Size | 460.3 MB | 83.6 MB |
| Events in quadrant A | 3,350,831 | 546,303 |
| Events in quadrant B | 3,976,847 | 547,419 |
| Events in quadrant C | 3,313,711 | 536,504 |
| Events in quadrant D | 3,486,914 | 525,703 |
| Mode SS | |||
|---|---|---|---|
| Quadrant | BADHDUFLAG | Total packets | Discarded packets |
| A | 0 | 144 | 0 |
| B | 0 | 144 | 0 |
| C | 0 | 144 | 0 |
| D | 0 | 144 | 0 |
| Mode M0 | |||
|---|---|---|---|
| Quadrant | BADHDUFLAG | Total packets | Discarded packets |
| A | 0 | 14861 | 2 |
| B | 0 | 16472 | 1 |
| C | 0 | 14865 | 1 |
| D | 0 | 15377 | 1 |
| Mode M9 | |||
|---|---|---|---|
| Quadrant | BADHDUFLAG | Total packets | Discarded packets |
| A | 0 | 1 | 0 |
| B | 0 | 1 | 0 |
| C | 0 | 1 | 0 |
| D | 0 | 1 | 0 |
| Quadrant | Total seconds | Saturated seconds | Saturation percentage |
|---|---|---|---|
| A | 7177 | 256 | 3.566950% |
| B | 7177 | 297 | 4.138219% |
| C | 7177 | 193 | 2.689146% |
| D | 7177 | 208 | 2.898147% |
Noise dominated data is calculated using 1-second bins in cleaned event files. If a bin has >2000 counts, and if more than 50% of those come from <1% of pixels, then it is considered to be noise-dominated and hence unusable.
| Quadrant | # 1 sec bins | Bins with >0 counts | Bins with >2000 counts | High rate bins dominated by noise | Noise dominated (total time) | Noise dominated (detector-on time) | Marked lightcurve |
|---|---|---|---|---|---|---|---|
| A | 7257 | 7177 | 0 | 0 | 0.00% | 0.00% | 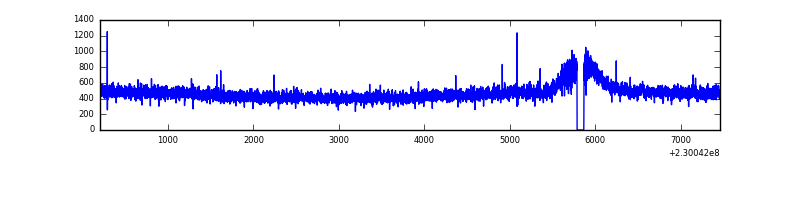 |
| B | 7257 | 7178 | 34 | 34 | 0.47% | 0.47% | 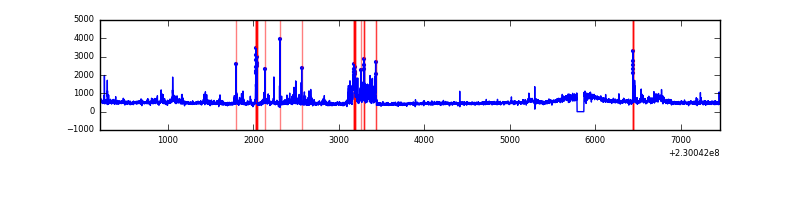 |
| C | 7257 | 7178 | 0 | 0 | 0.00% | 0.00% | 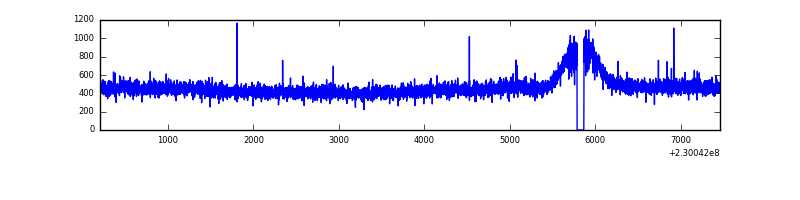 |
| D | 7257 | 7178 | 11 | 11 | 0.15% | 0.15% | 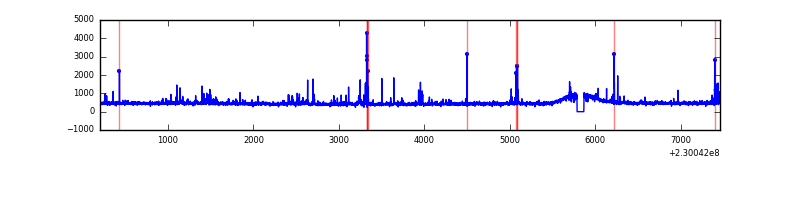 |
Top three noisy pixels from each quadrant. If the there are fewer than three noisy pixels in the level2.evt file, extra rows are filled as -1
| Pixel properties | Quadrant properties | ||||||
|---|---|---|---|---|---|---|---|
| Quadrant | DetID | PixID | Counts | Sigma | Mean | Median | Sigma |
| A | 0 | 226 | 8022 | 40.19 | 869 | 848 | 178.5 |
| A | 12 | 194 | 7832 | 39.12 | 869 | 848 | 178.5 |
| A | 15 | 236 | 5729 | 27.34 | 869 | 848 | 178.5 |
| B | 4 | 48 | 448642 | 2669.25 | 868 | 847 | 167.8 |
| B | 0 | 214 | 64220 | 377.76 | 868 | 847 | 167.8 |
| B | 0 | 231 | 28127 | 162.61 | 868 | 847 | 167.8 |
| C | 13 | 61 | 6347 | 27.76 | 846 | 847 | 198.1 |
| C | 8 | 128 | 5521 | 23.59 | 846 | 847 | 198.1 |
| C | 1 | 16 | 4698 | 19.44 | 846 | 847 | 198.1 |
| D | 1 | 52 | 67226 | 299.65 | 841 | 819 | 221.6 |
| D | 14 | 34 | 48152 | 213.58 | 841 | 819 | 221.6 |
| D | 6 | 112 | 46943 | 208.13 | 841 | 819 | 221.6 |
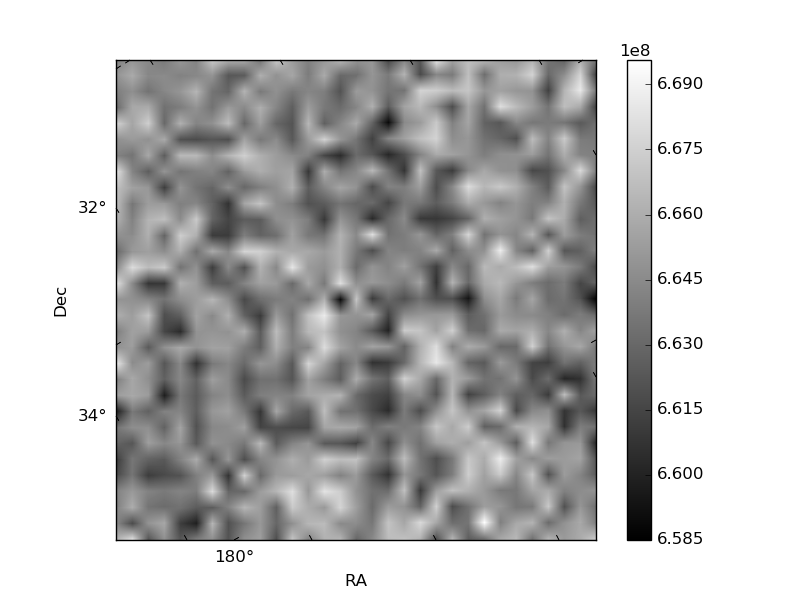
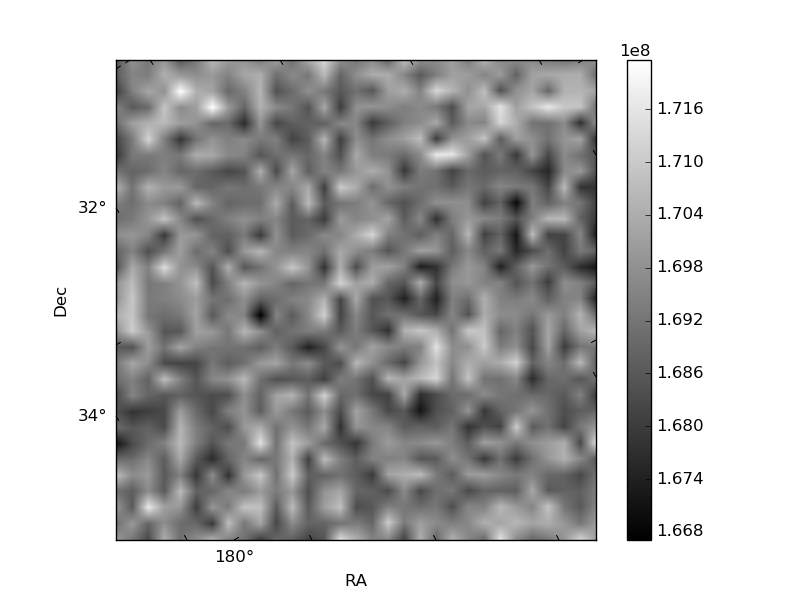
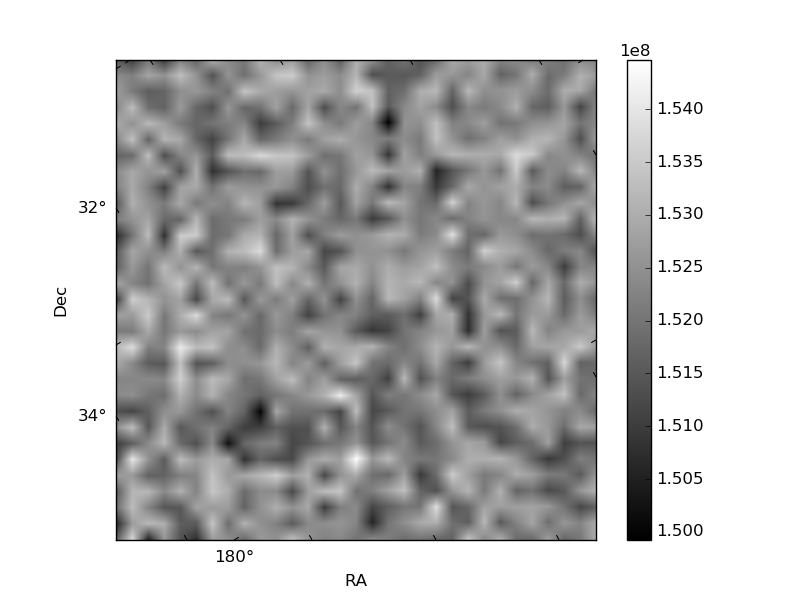
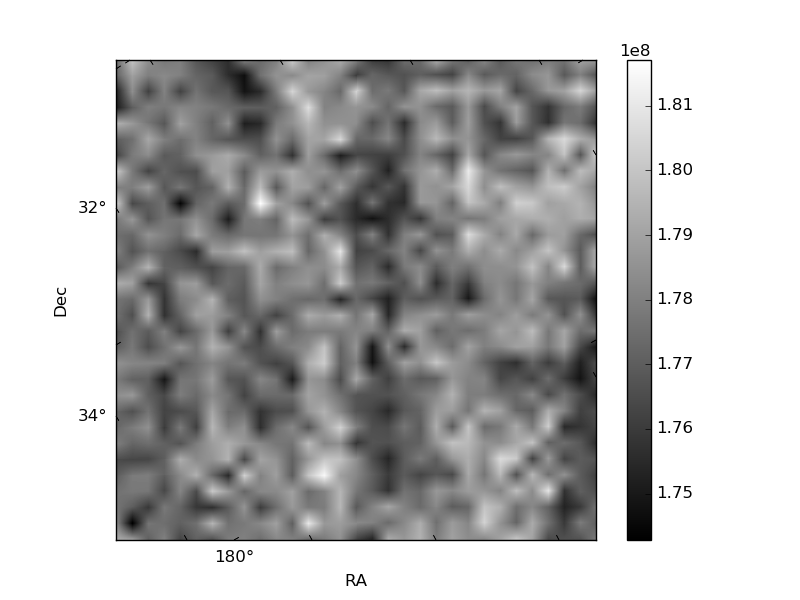
Histogram calculated using DETX and DETY for each event in the final _common_clean file
| Quadrant A | 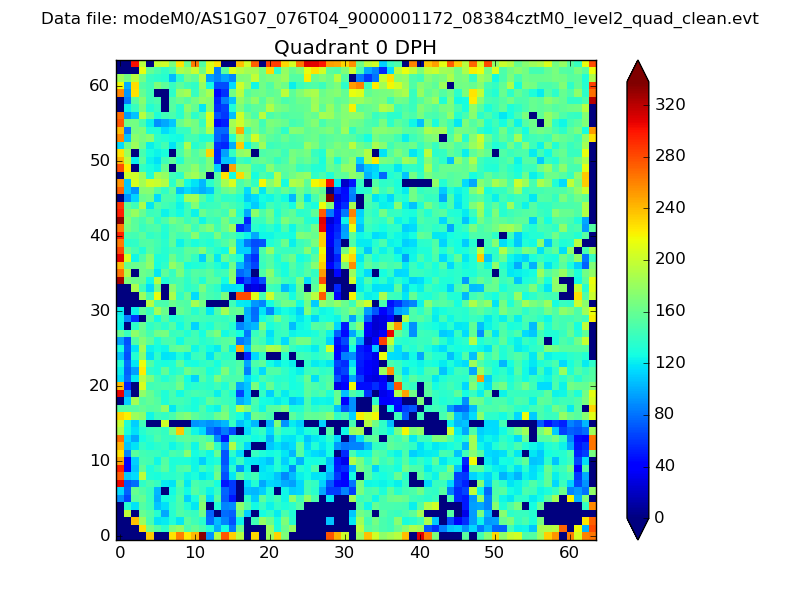 |
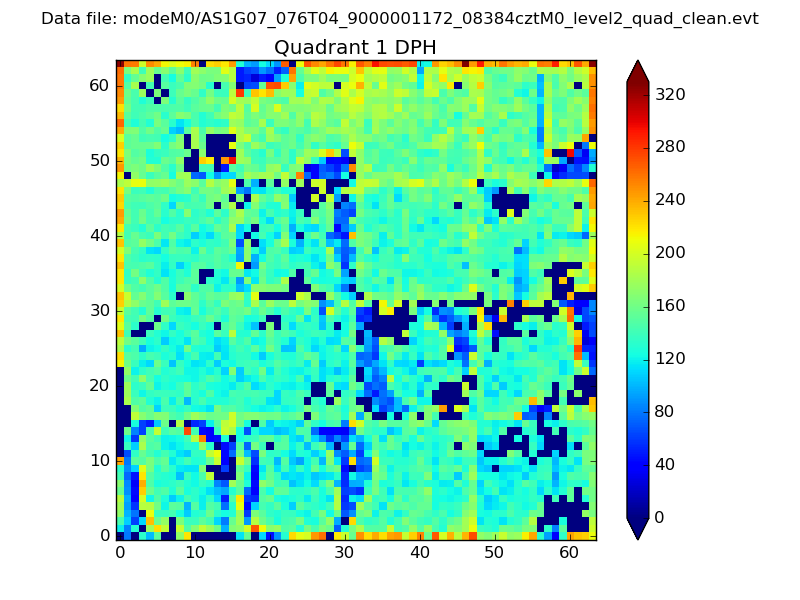 |
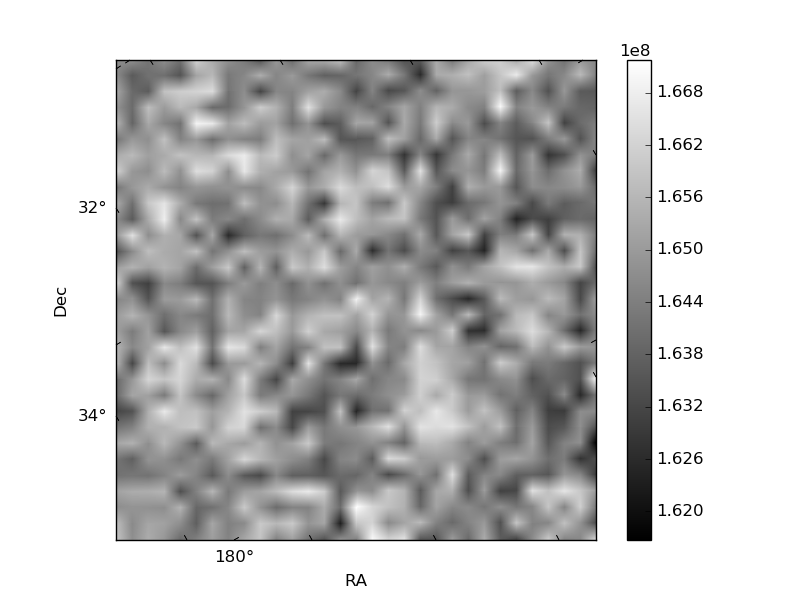
Quadrant B |
|---|---|---|---|
| Quadrant D | 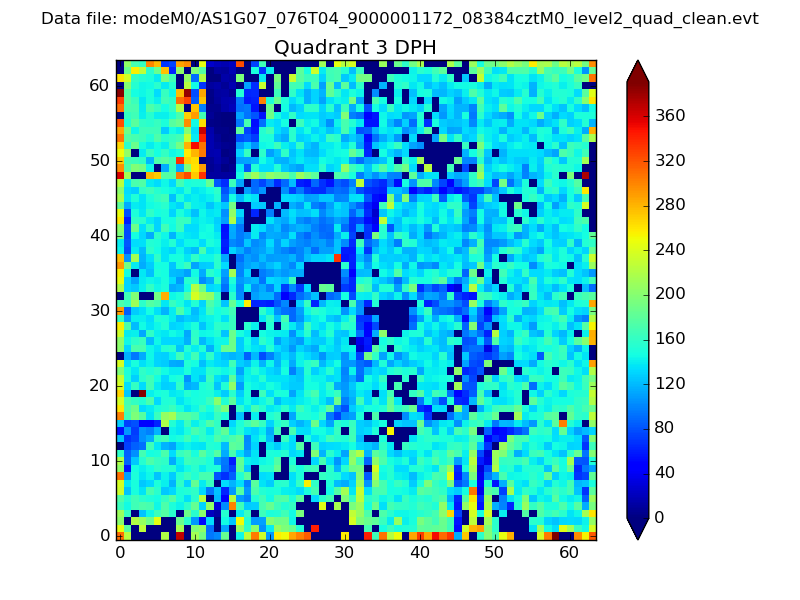 |
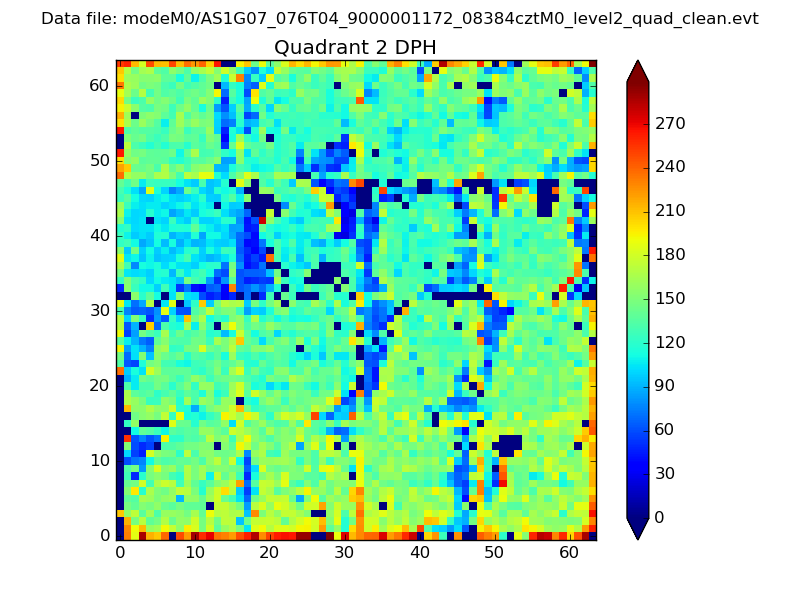 |
Quadrant C |
| Plot type | Count rate plots | Images |
|---|---|---|
| Comparison with Poisson distribution Blue bars denote a histogram of data divided into 1 sec bins. Red curve is a Poisson curve with rate = median count rate of data. |
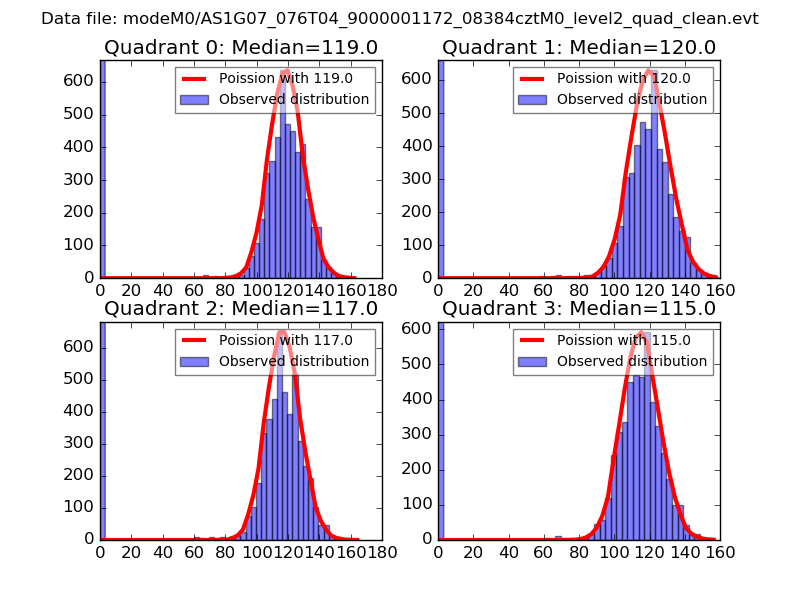 |
 |
| Quadrant-wise count rates Data is divided into 100 sec bins |
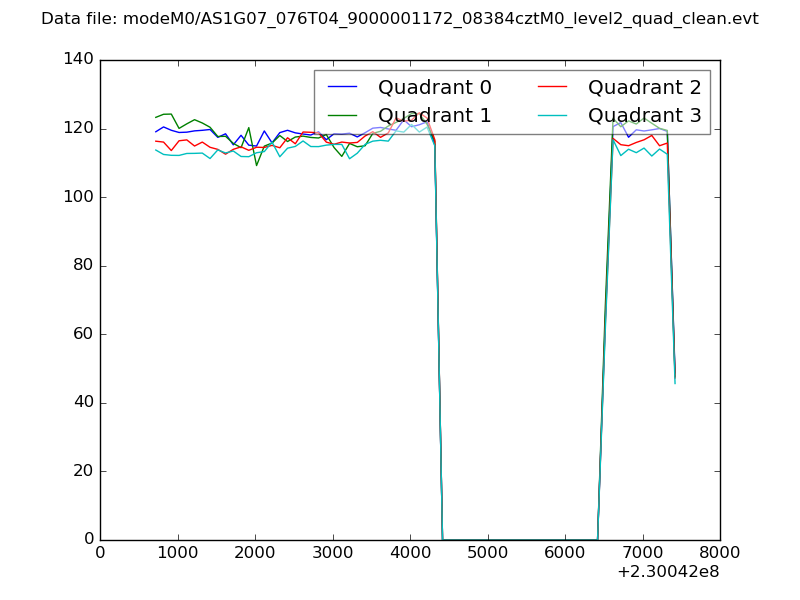 |
|
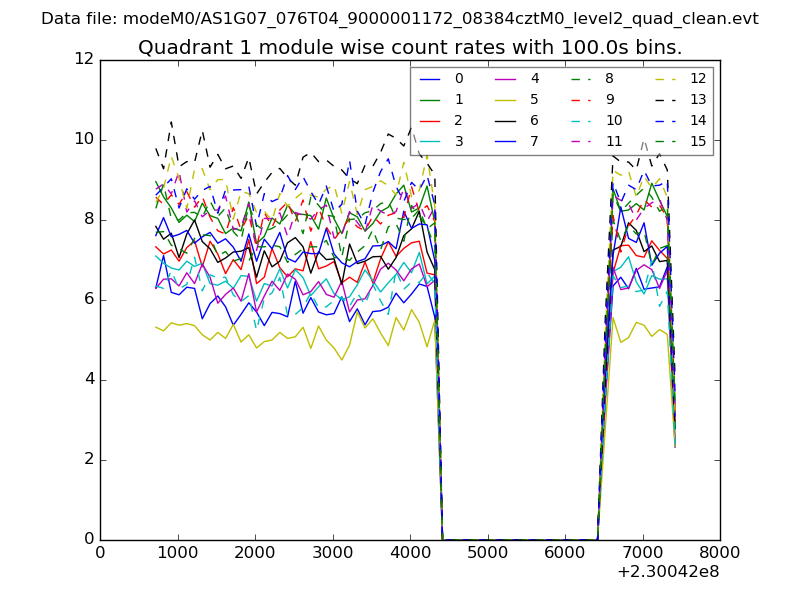
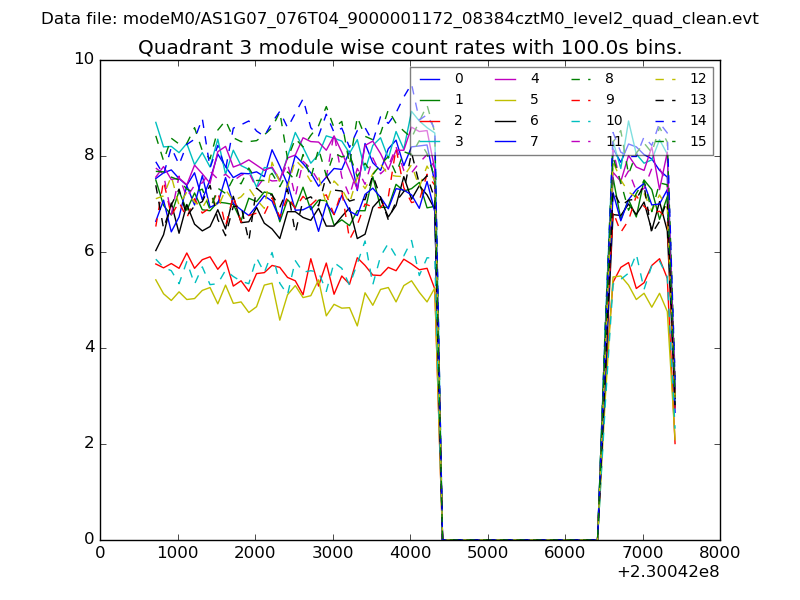
| Module-wise count rates for Quadrant A Data is divided into 100 sec bins |
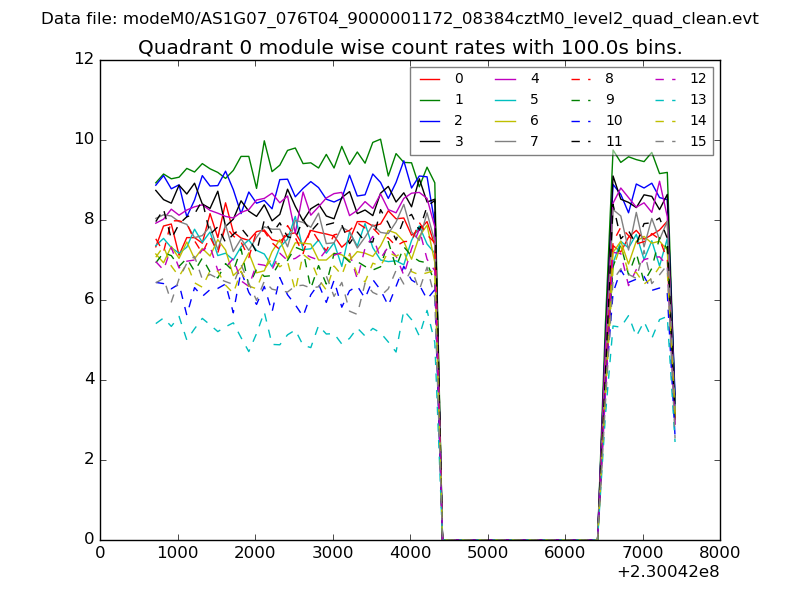 |
 |
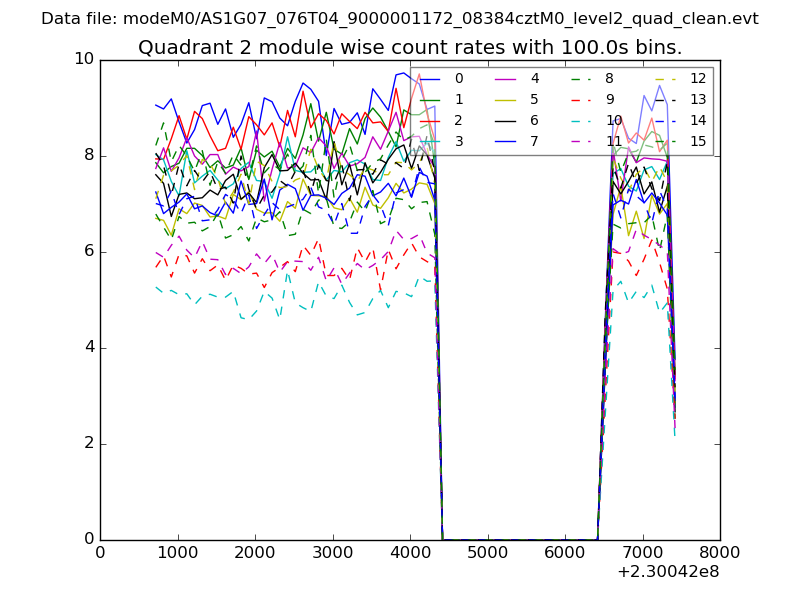
| Module-wise count rates for Quadrant B Data is divided into 100 sec bins |
 |
 |
| Module-wise count rates for Quadrant C Data is divided into 100 sec bins |
 |
 |
| Module-wise count rates for Quadrant D Data is divided into 100 sec bins |
 |
 |
| Parameter | Plot |
|---|---|
| CZT HV Monitor | 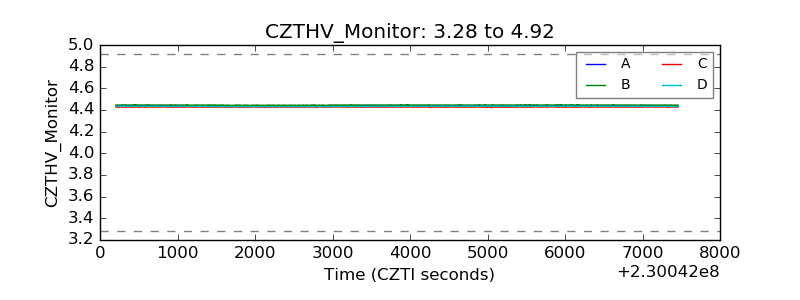 |
| D_VDD | 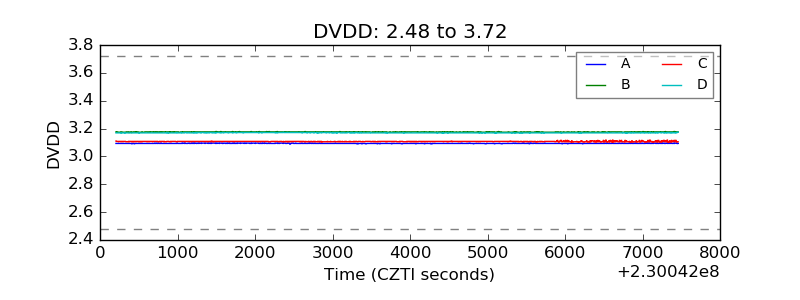 |
| Temperature 1 | 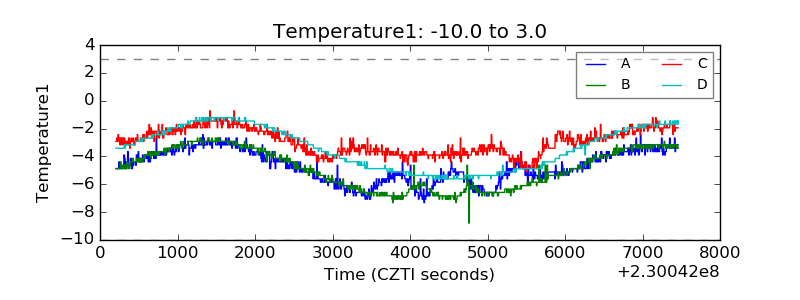 |
| Veto HV Monitor | 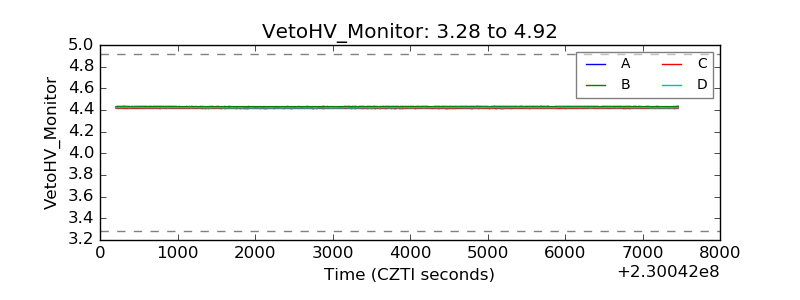 |
| Veto LLD | 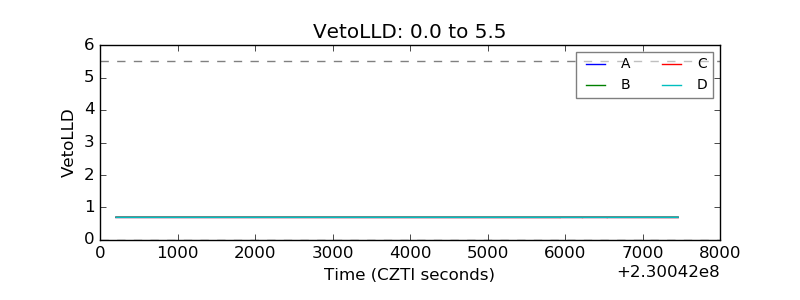 |
| Alpha Counter | 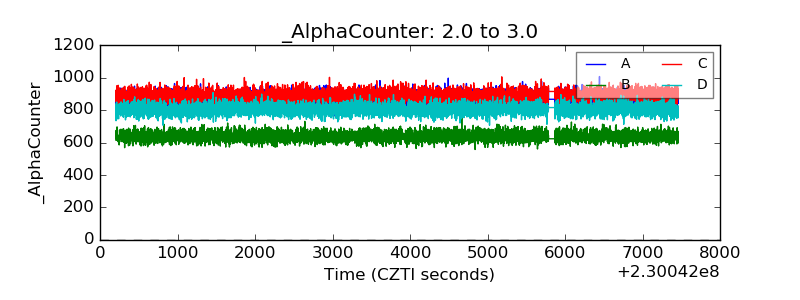 |
| _CPM_Rate | 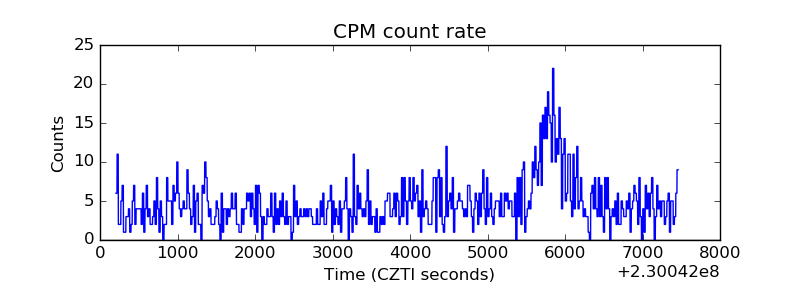 |
| CZT Counter | 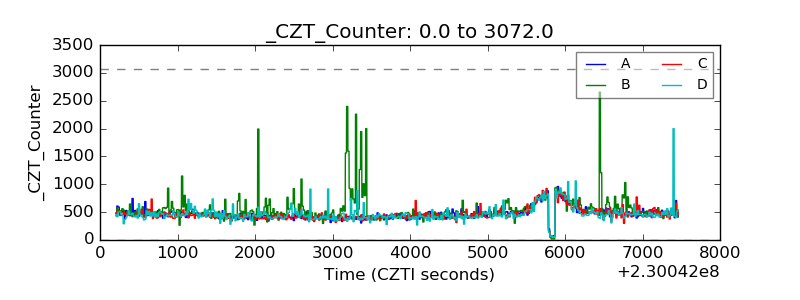 |
| +2.5 Volts monitor |  |
| +5 Volts monitor |  |
| _ROLL_ROT | 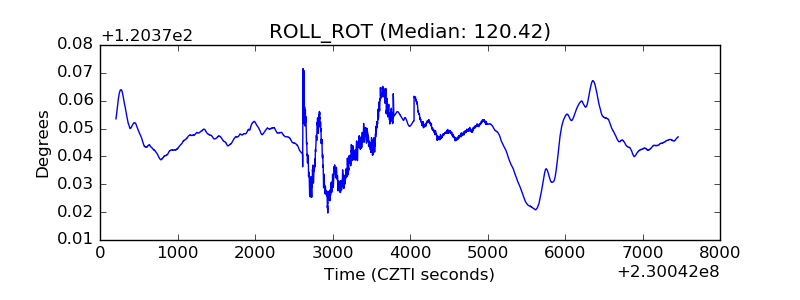 |
| _Roll_DEC | 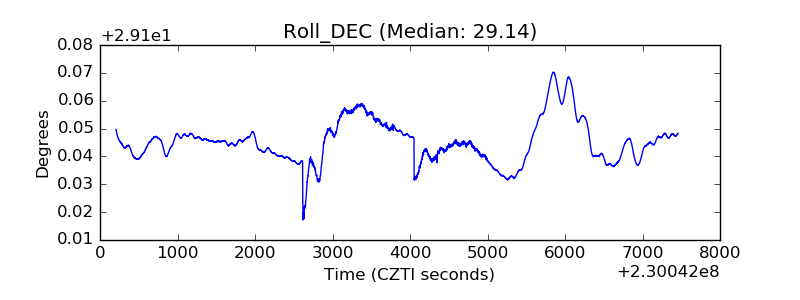 |
| _Roll_RA | 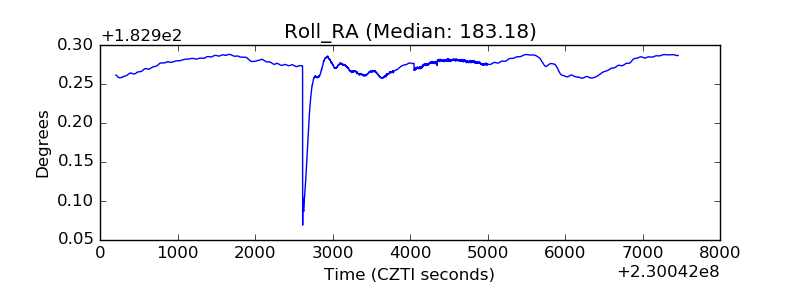 |
| Veto Counter | 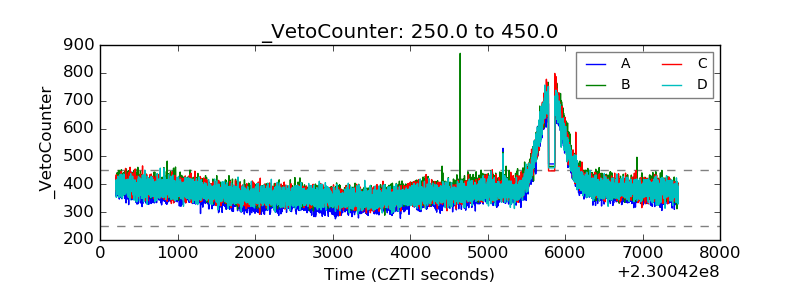 |